|
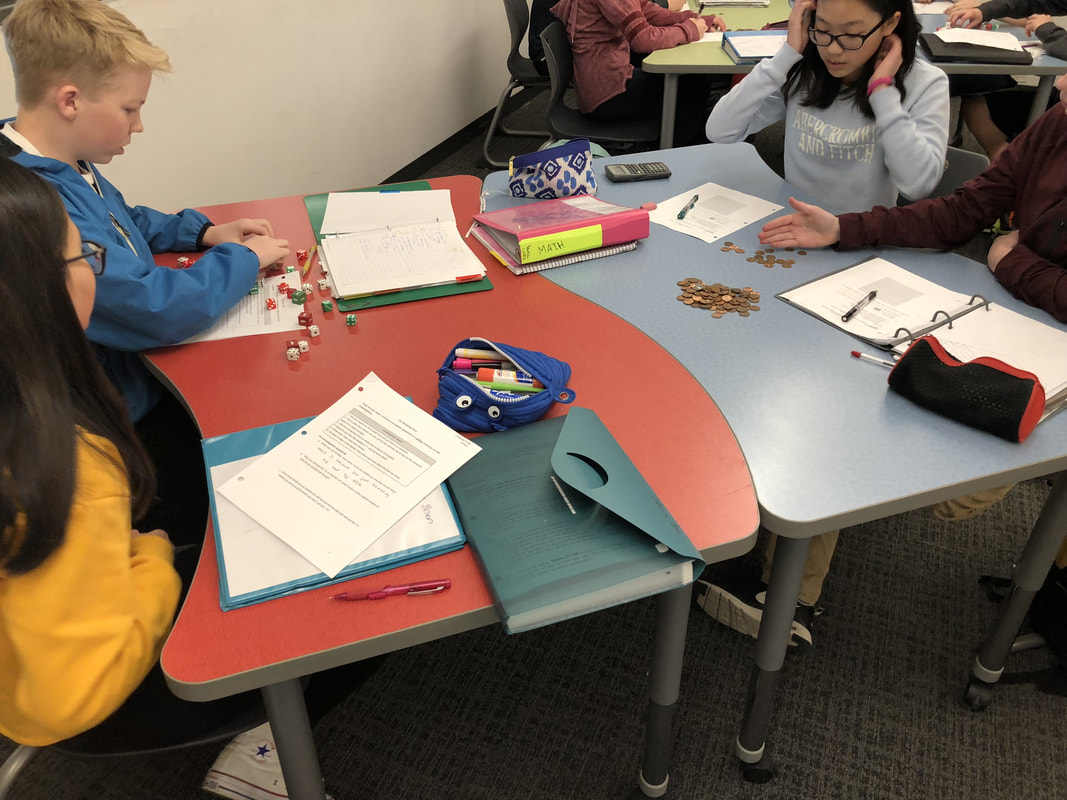
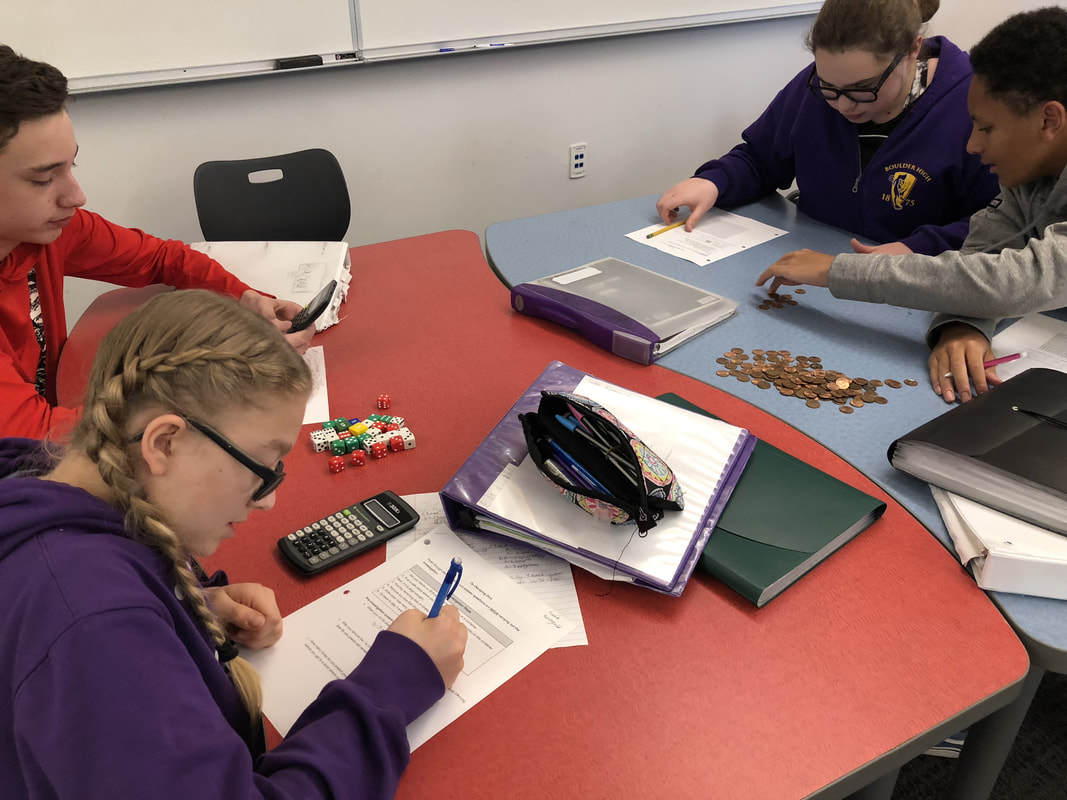
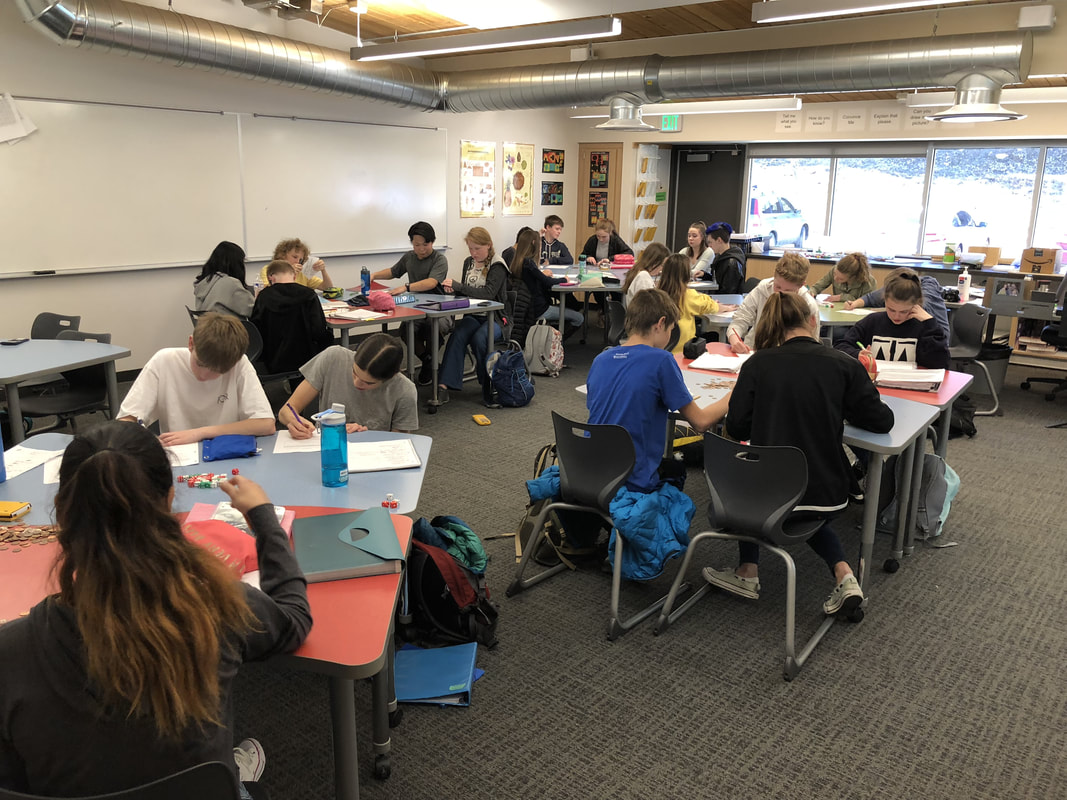
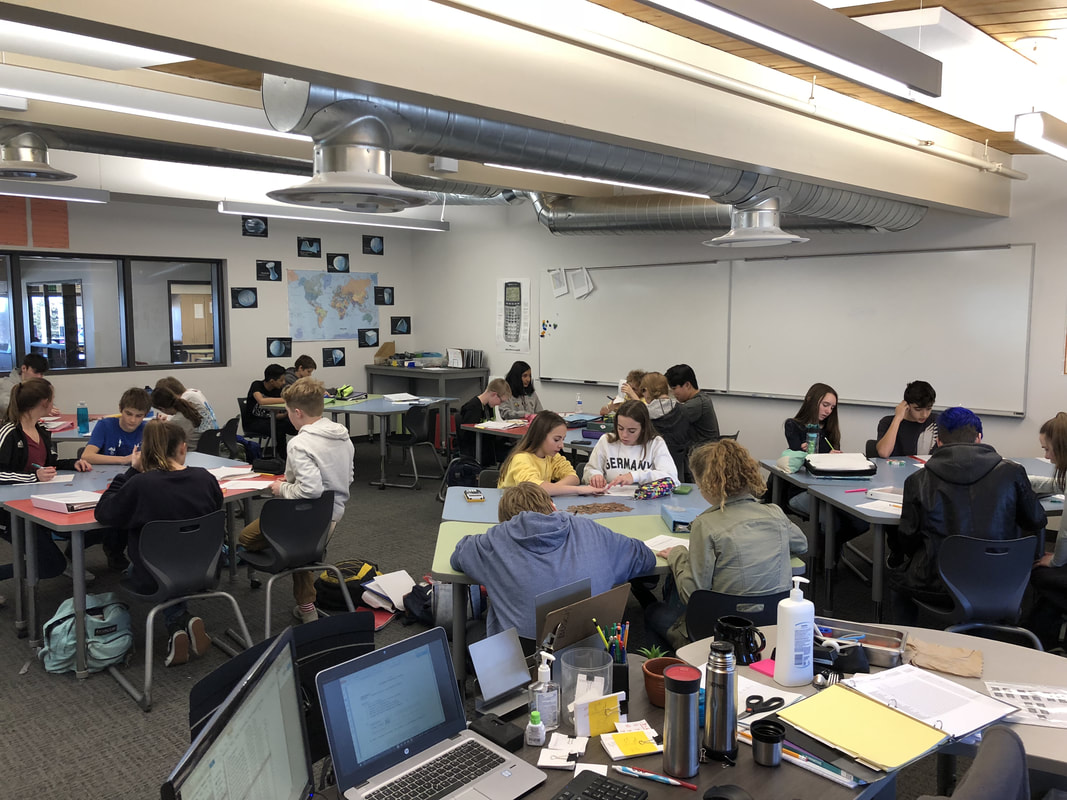
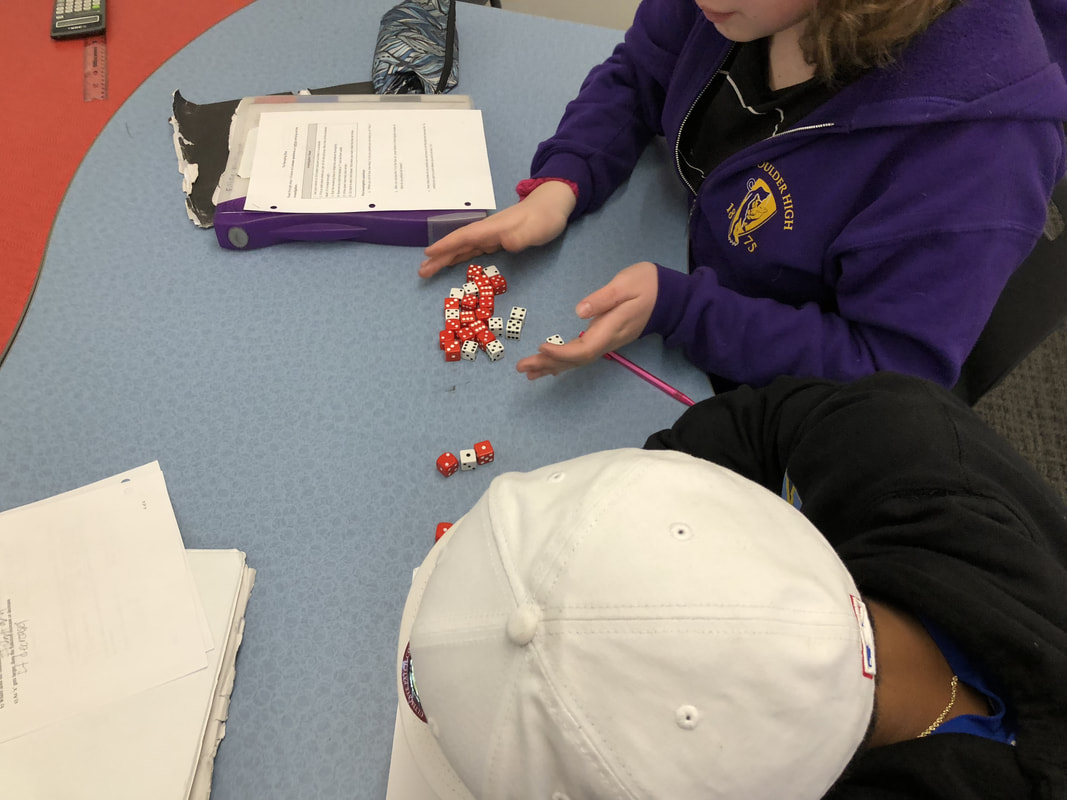
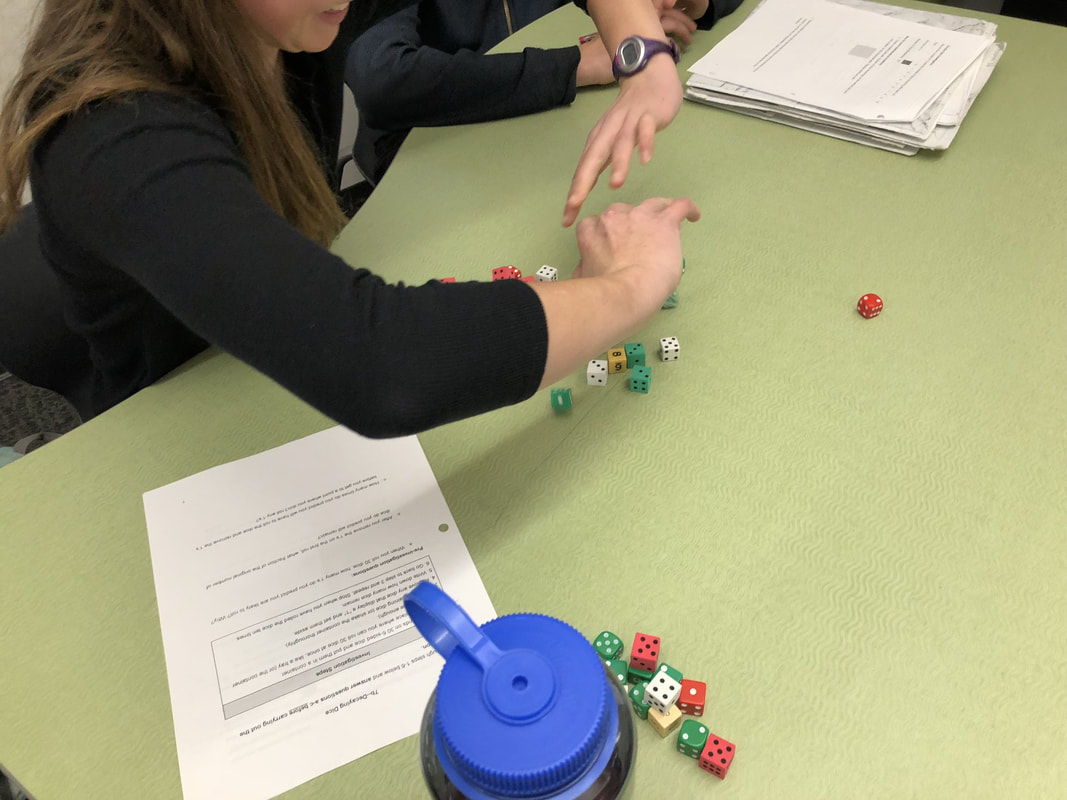
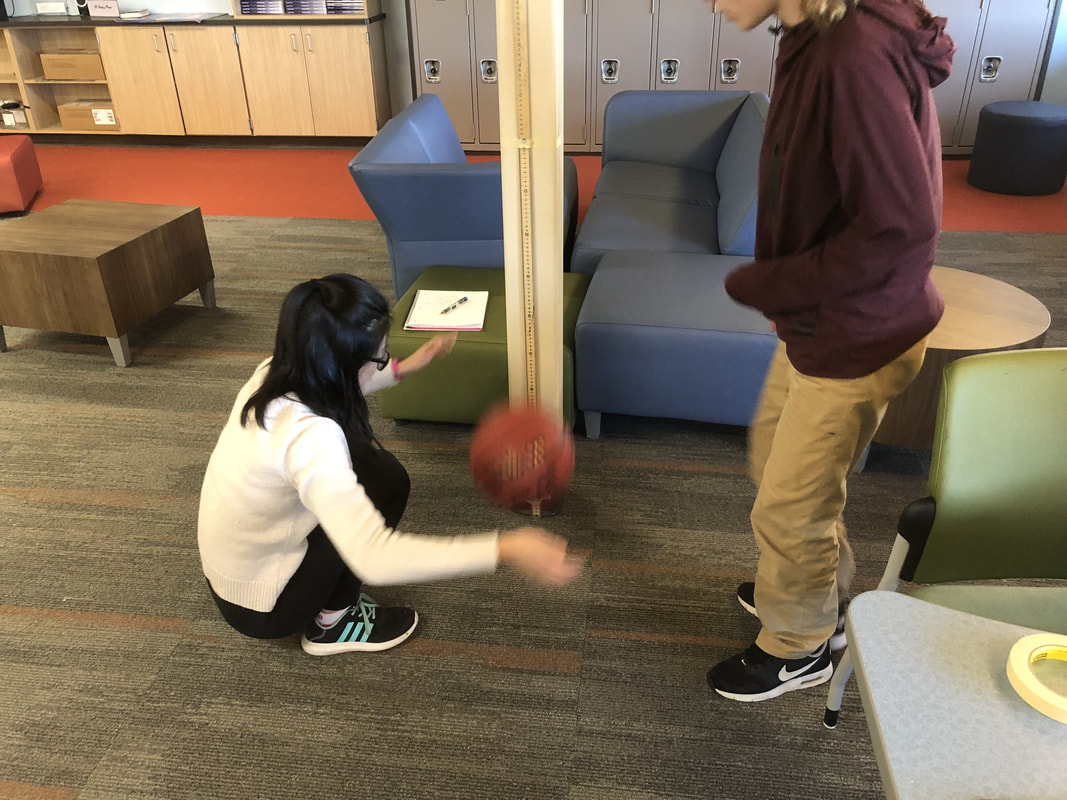
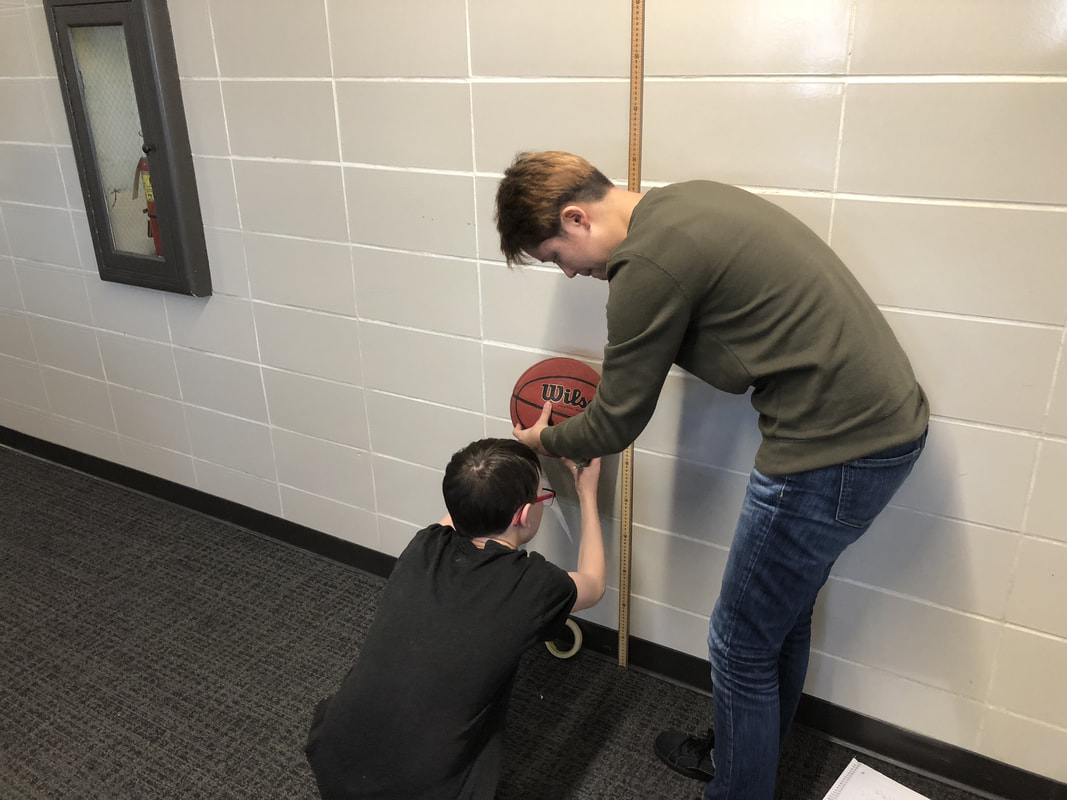
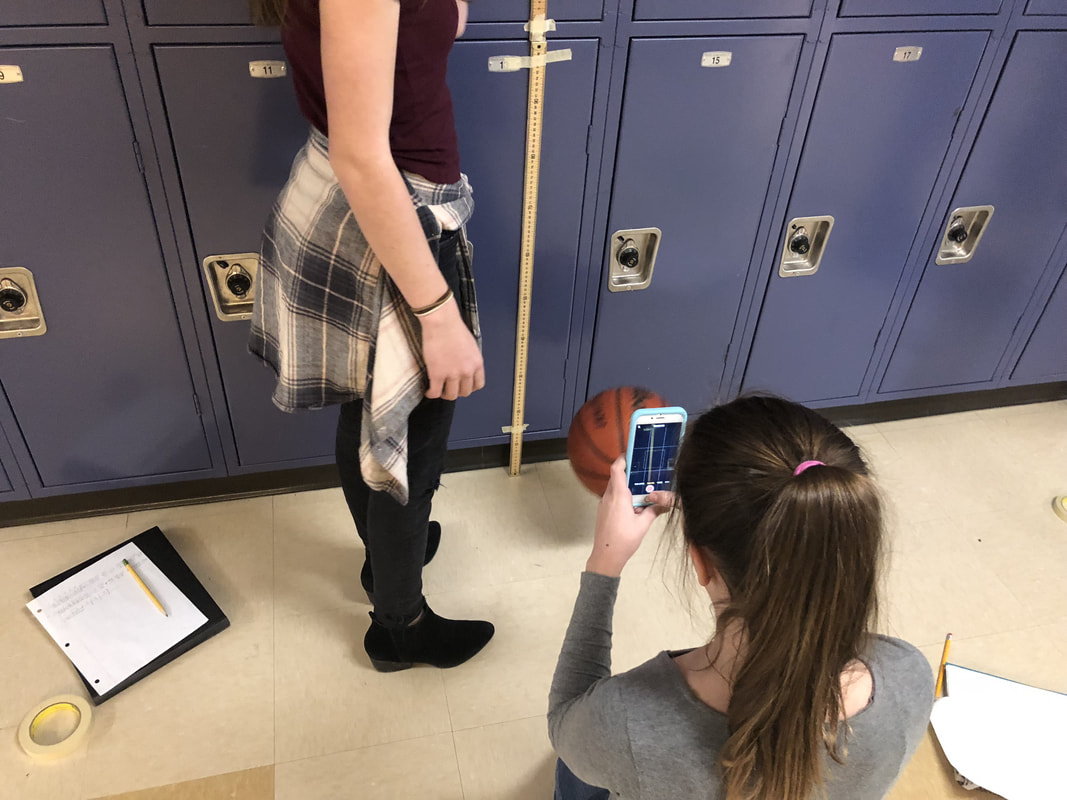
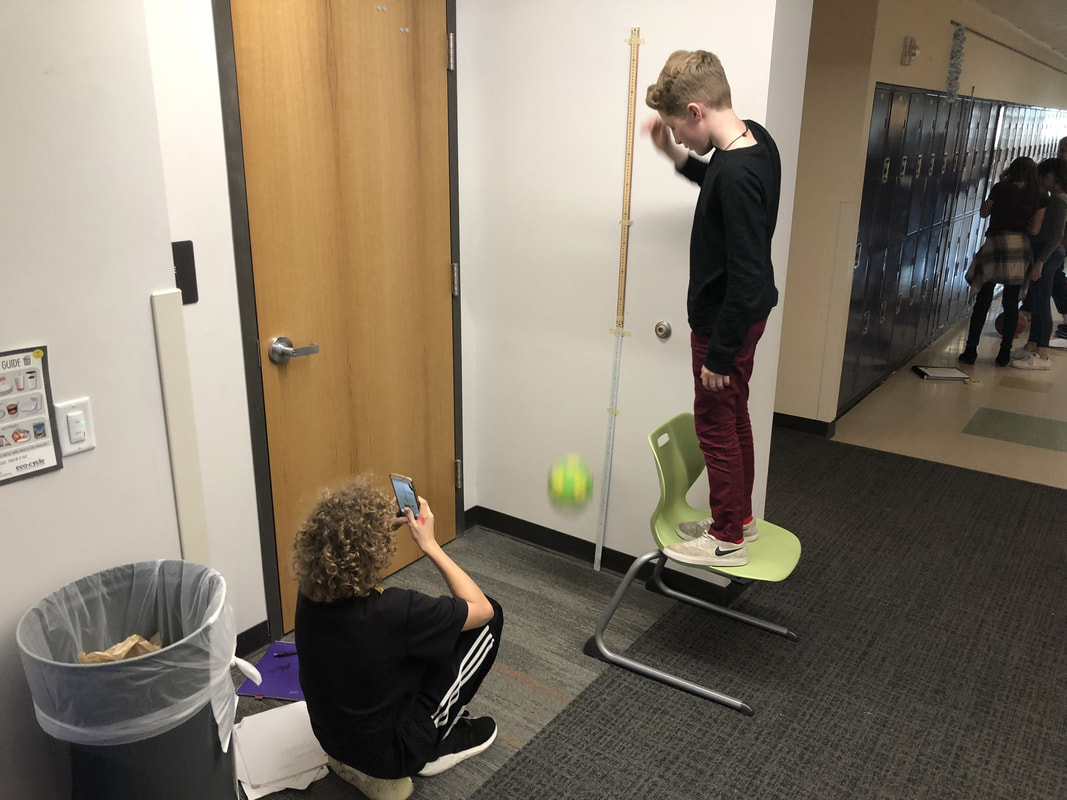
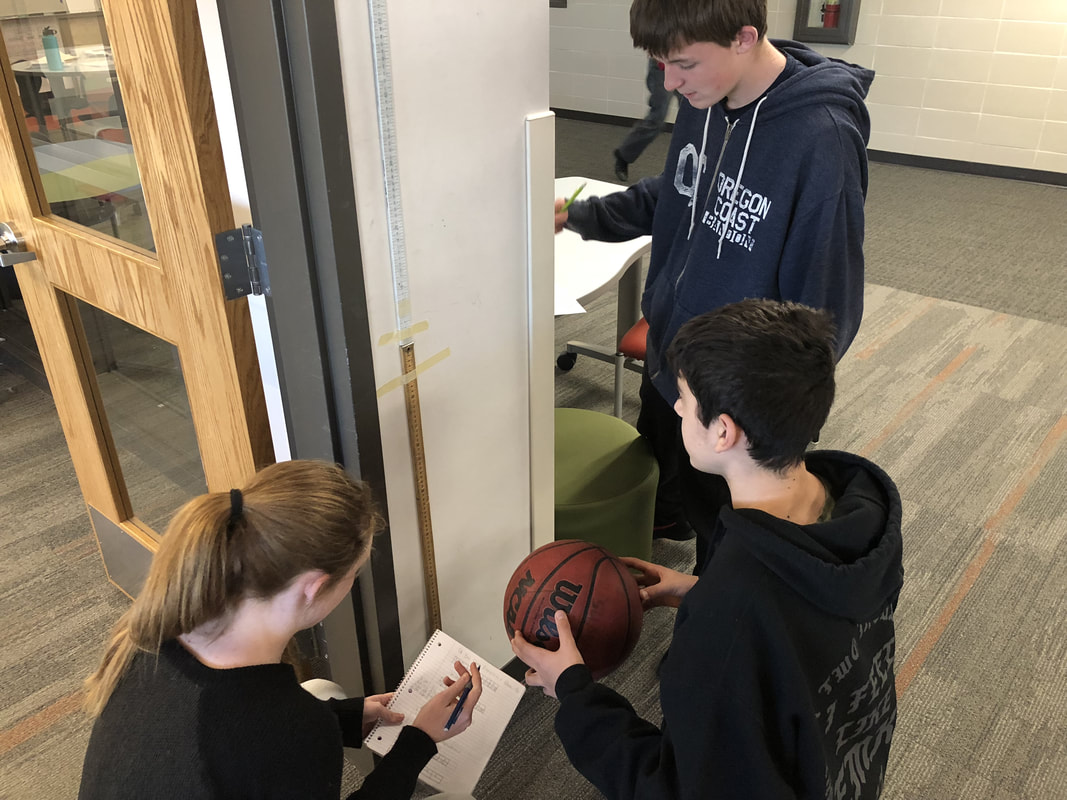
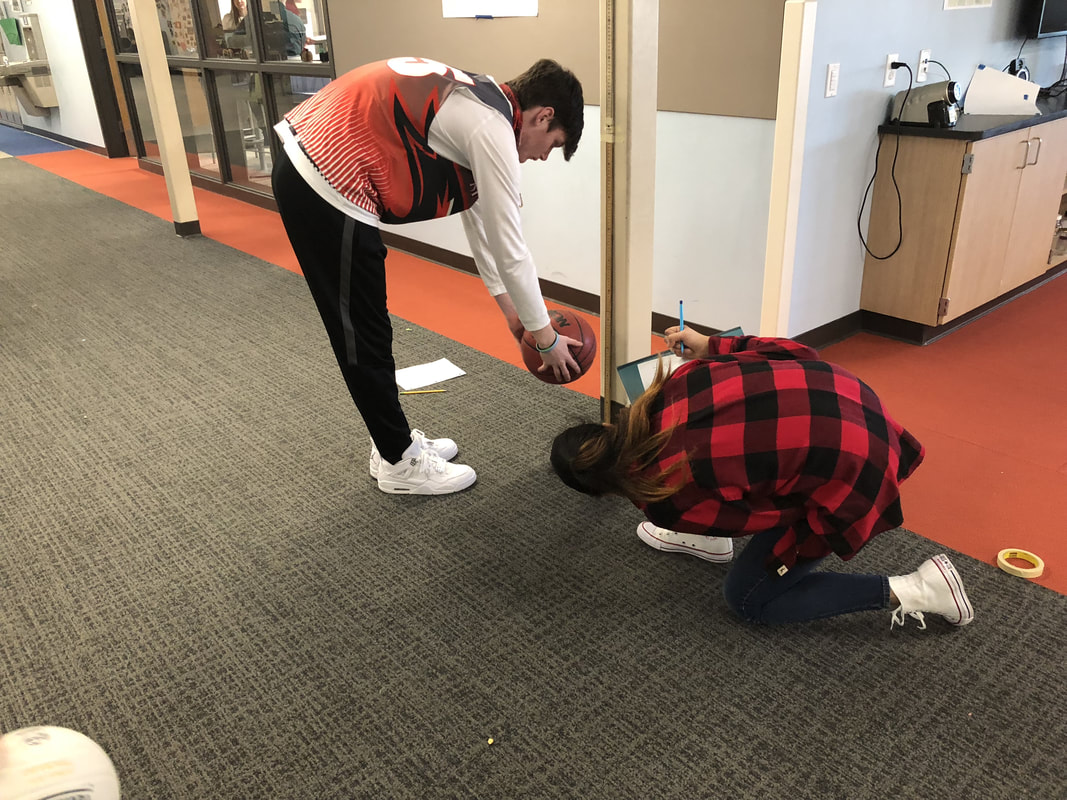
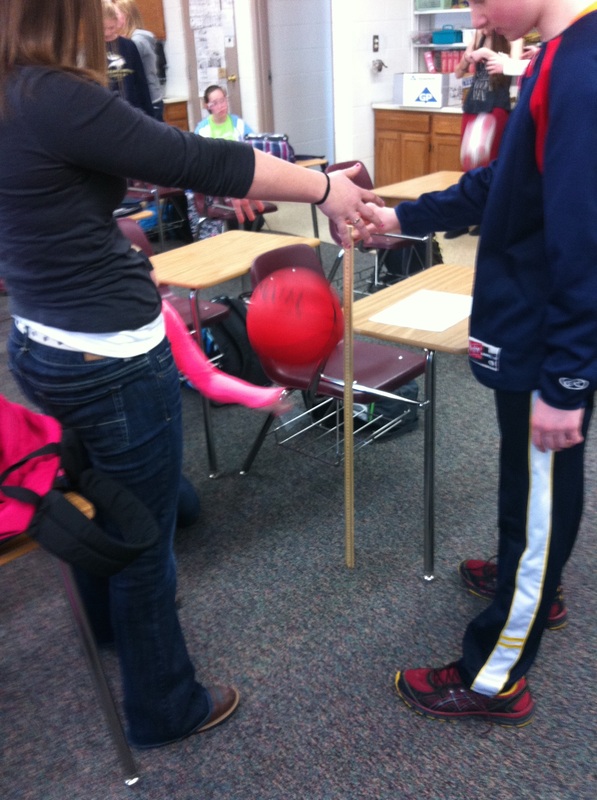
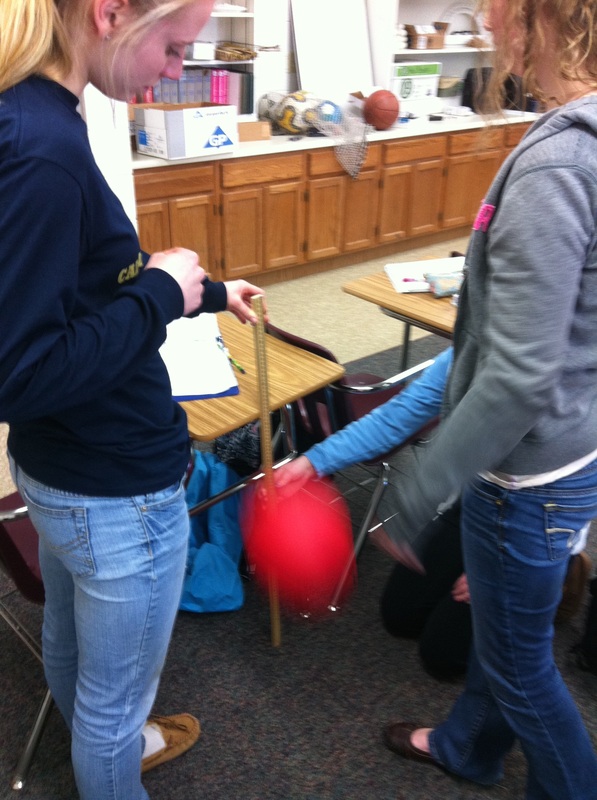
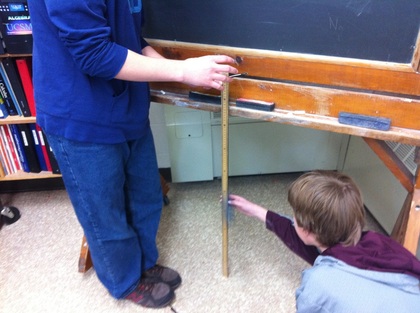
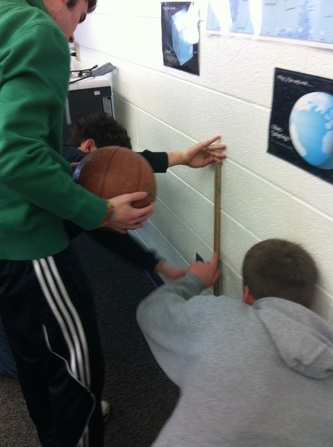
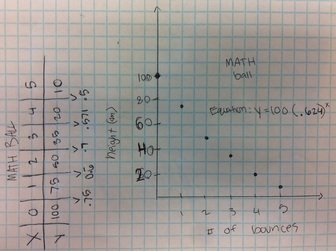
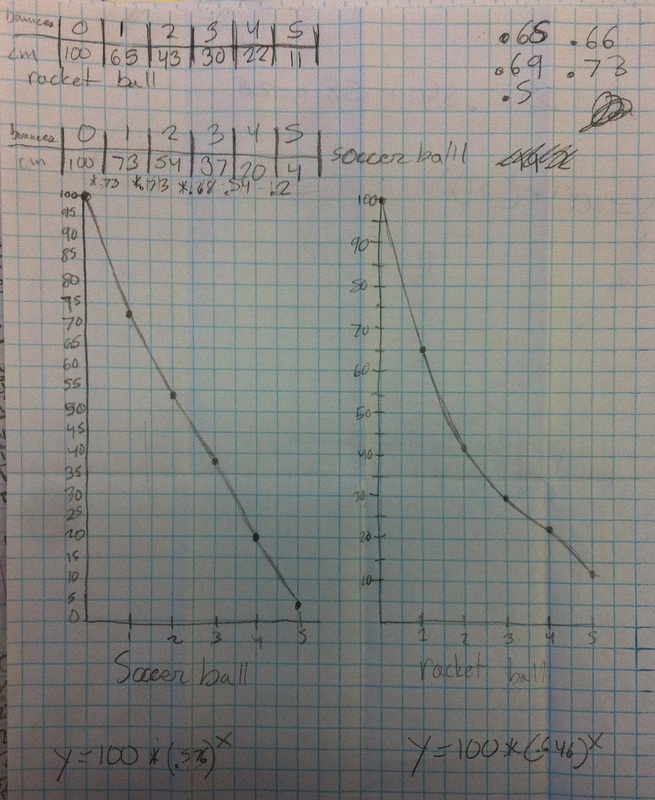
I'm struggling to find time to write thoughtful posts. But I am taking pictures. Here's some fun shots of our Ball Drop experiment in Algebra 1. The directions were simple: •Drop a ball from any initial height, measure in cm. •Measure the height for 5 bounces of a ball (I suggest using a table). •Graph the points (graph paper) •Create an equation that models/fits your data. •Do this for two different balls (don’t put both balls on the same graph) 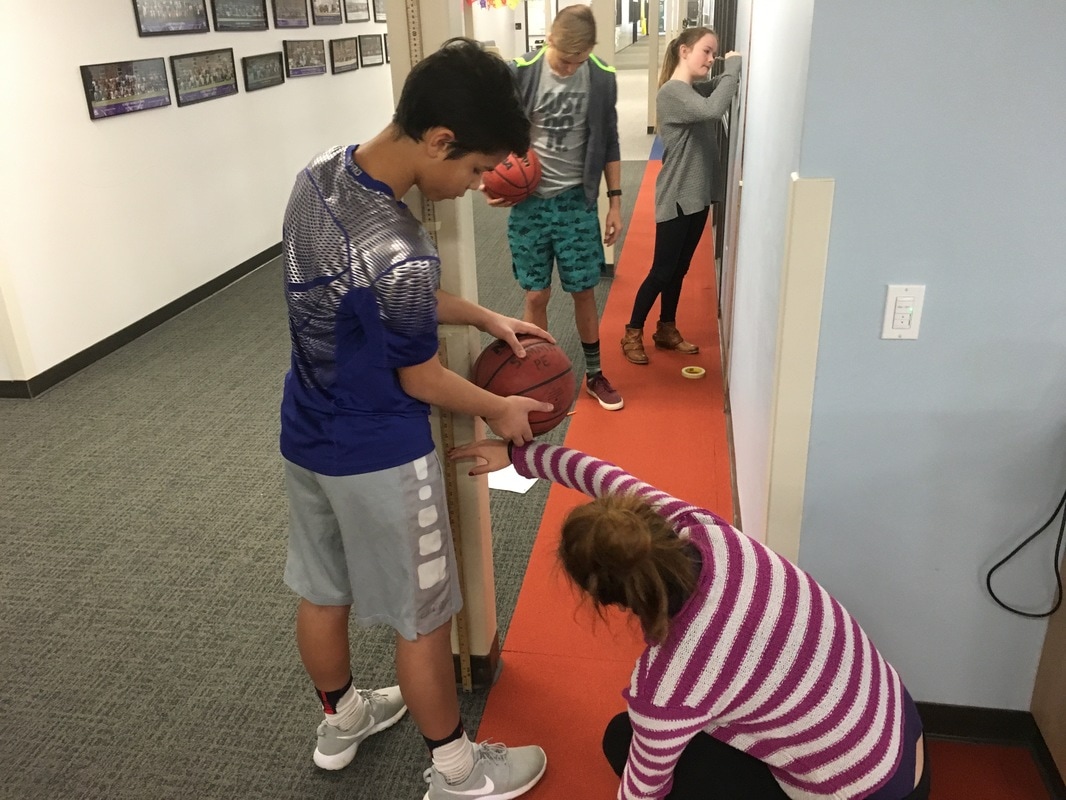 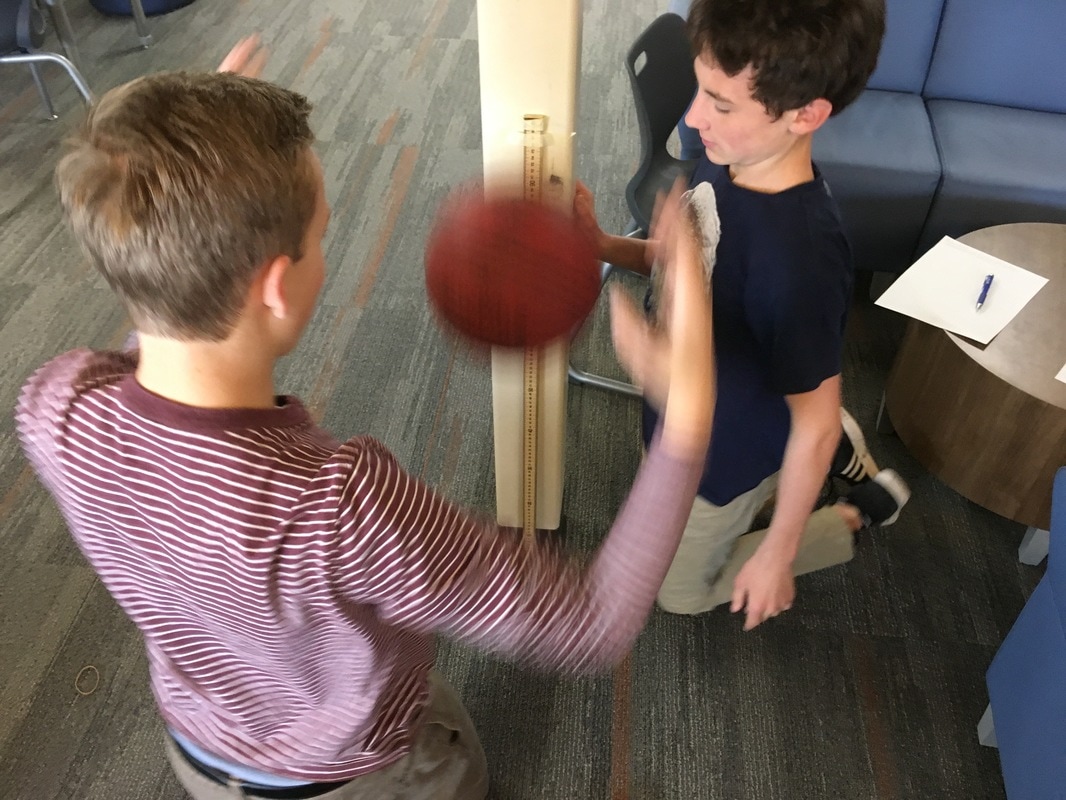 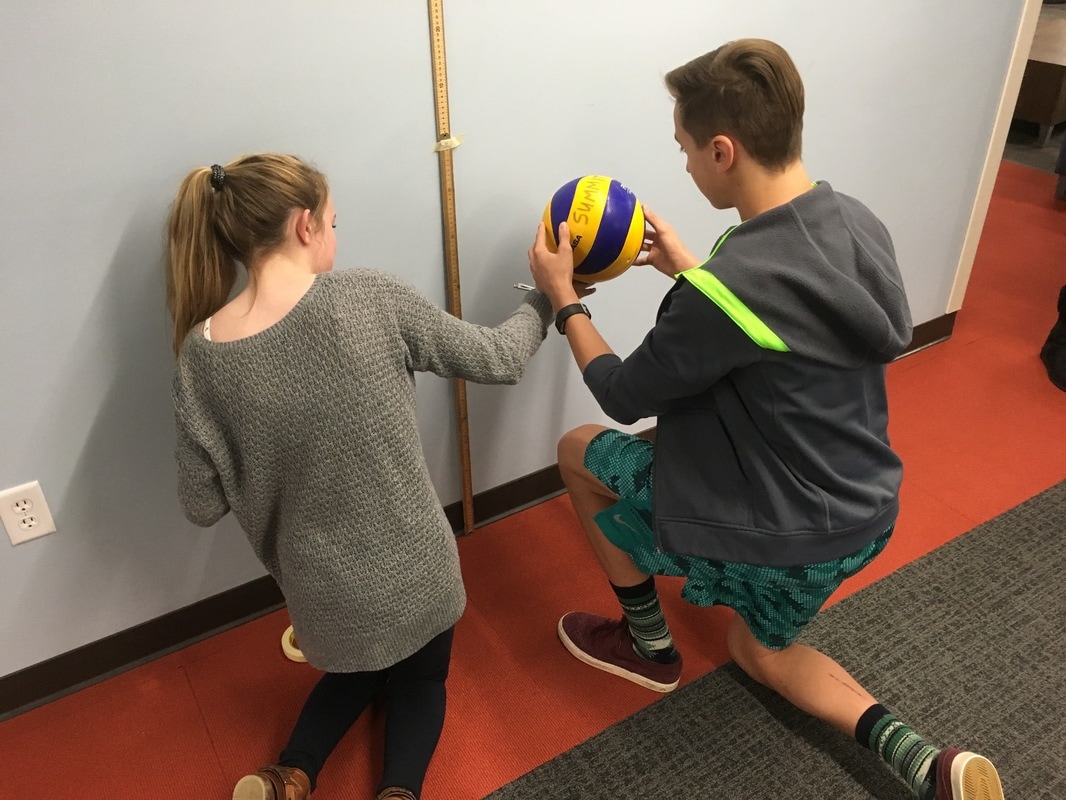 The results were fabulous! Students had great conversations surrounding how to find the constant multiplier if it never ended up being the same between bounces. We also had heated arguments about whether connecting the data points with a curve made sense in the situation. (The students came to the consensus that they did not think the graph would be continuous.) 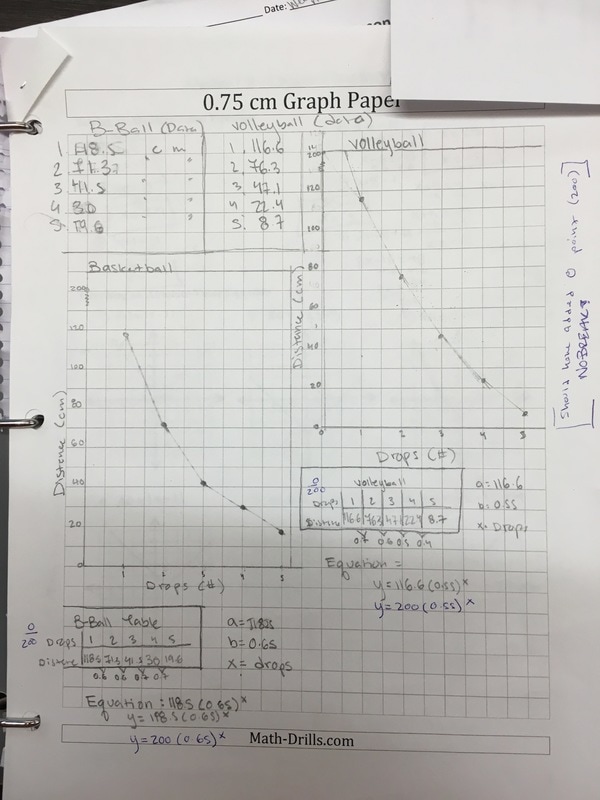 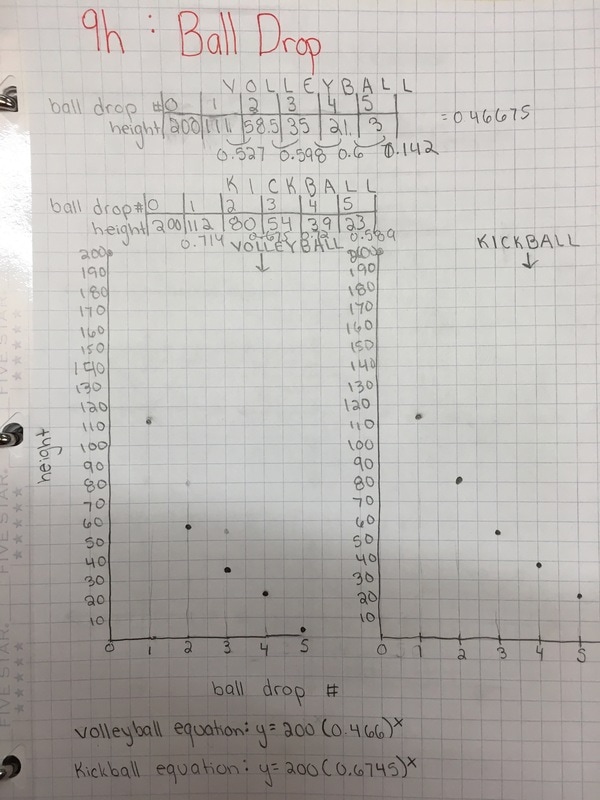 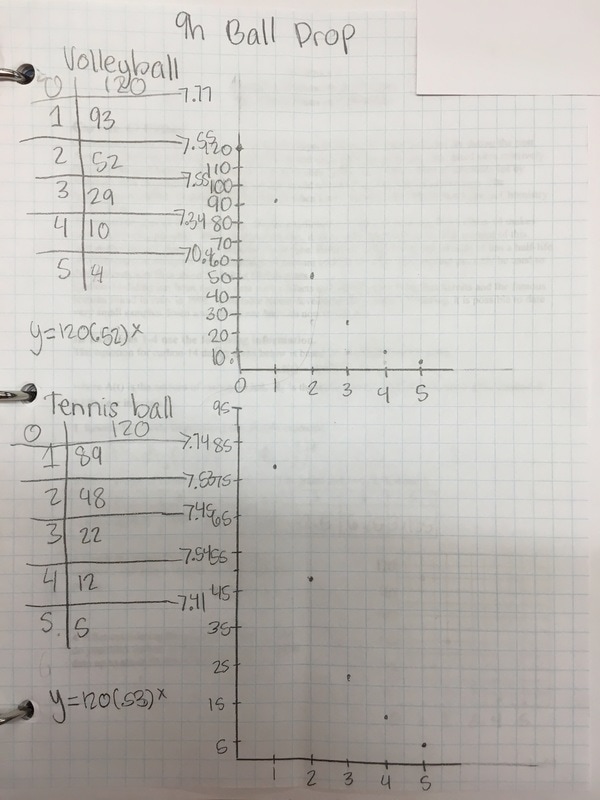 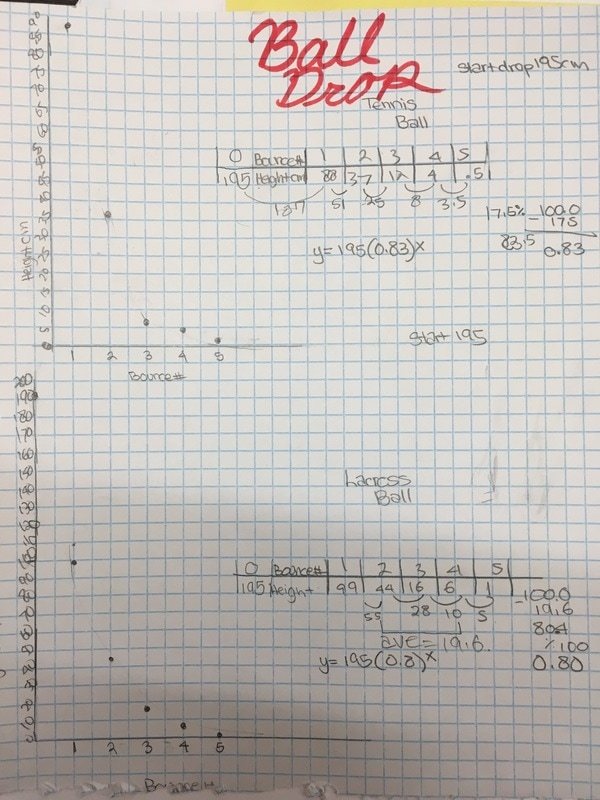 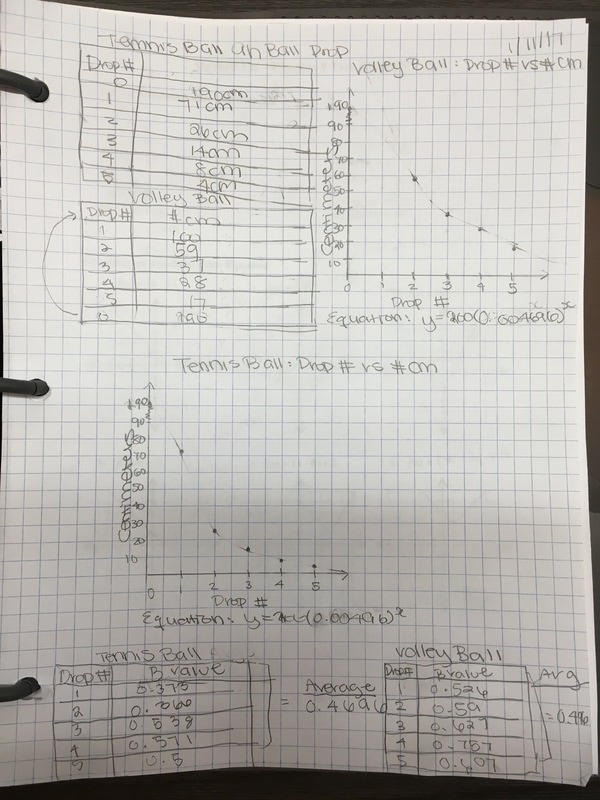 Experiments with pennies and dice exploring exponential growth and decay. 2 days. 500 dice. More pennies than you care to think about. High engagement. Excellent modeling. 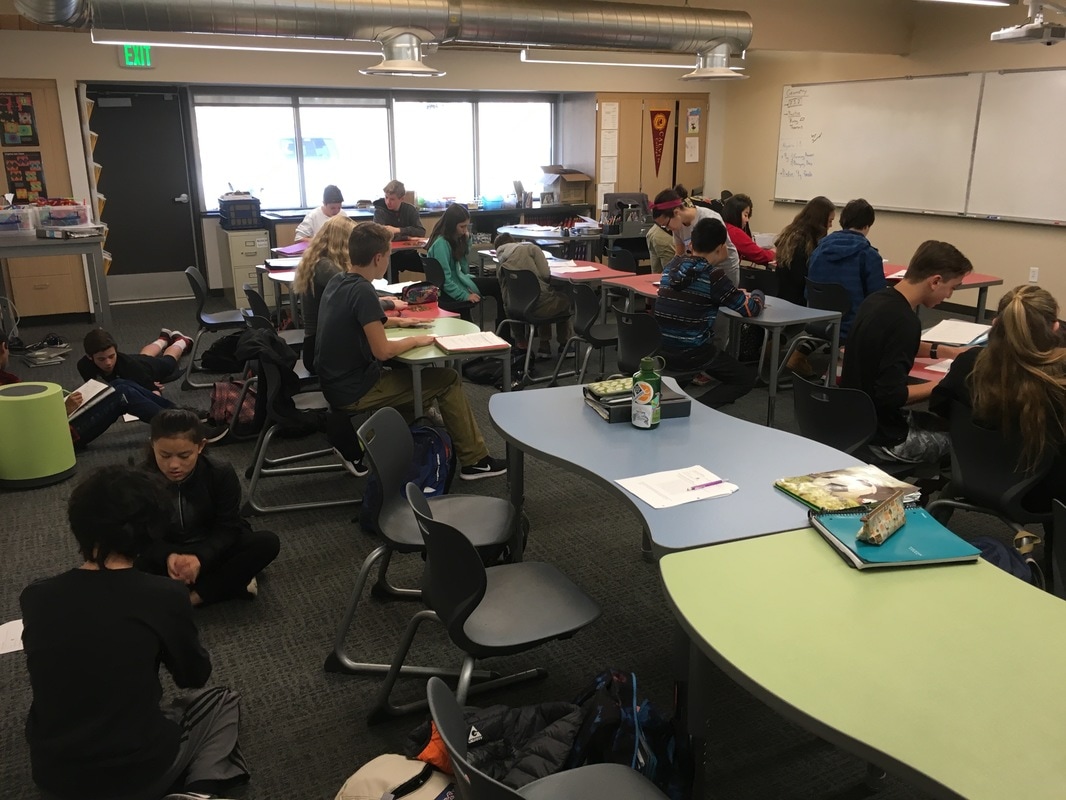 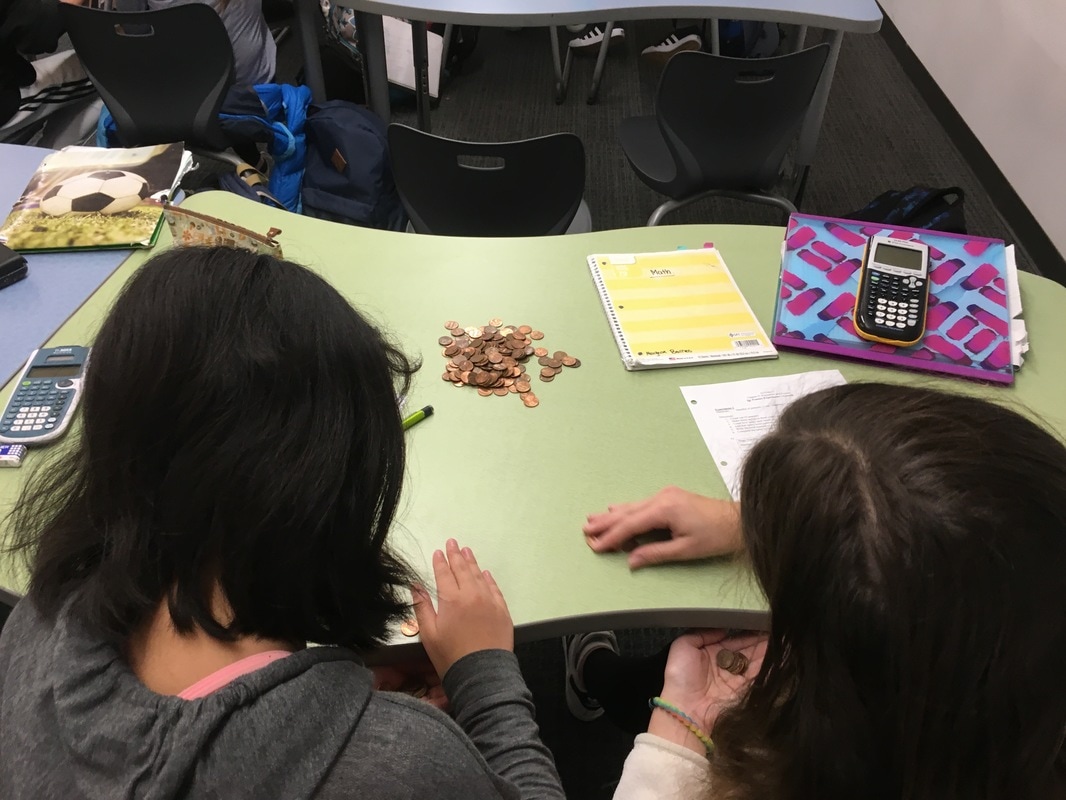 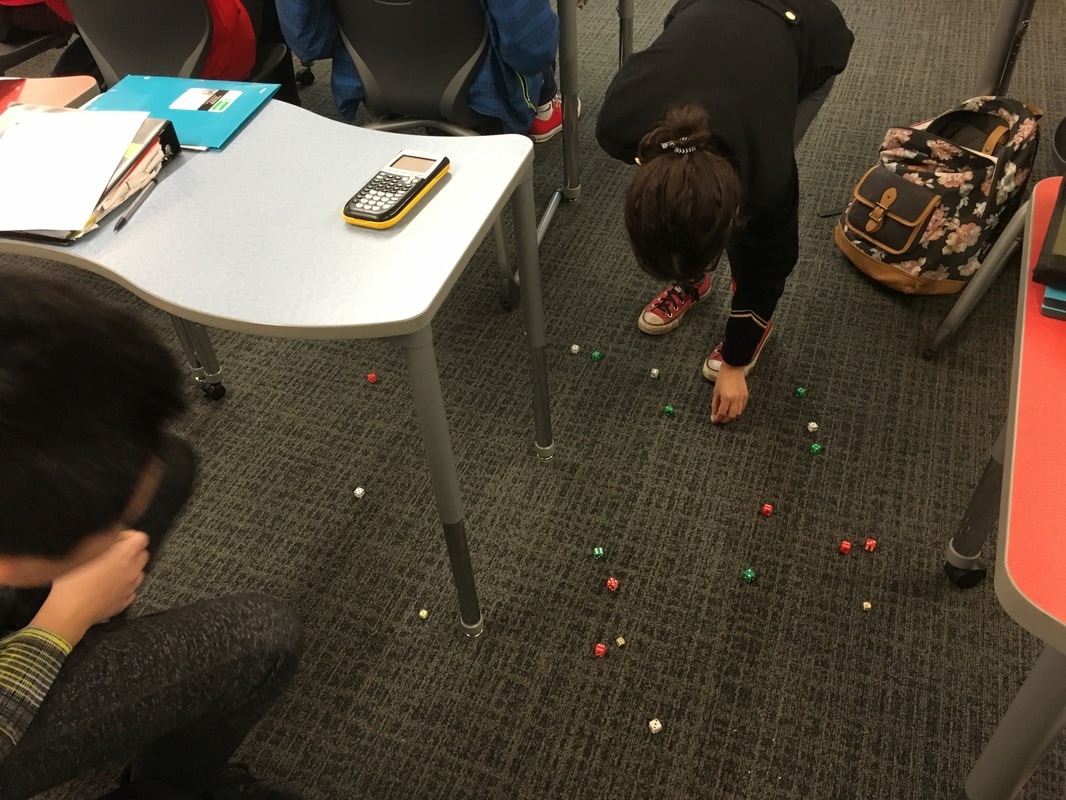 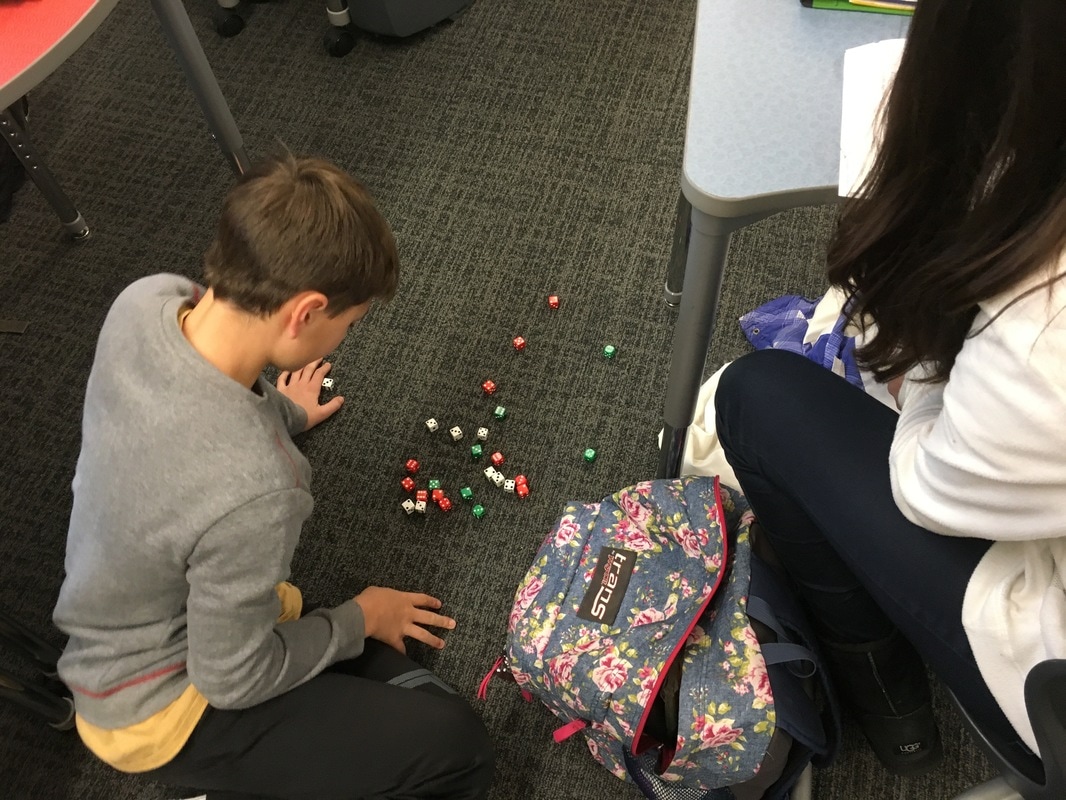
This coming Friday I have the pleasure of sharing some things I do in my class with other math teachers. Super stoked! #CCTM16
I get to talk about something near and dear to my heart--using experiments in math class. Rather than chat people up for 50 minutes, we're going to start off by doing an experiment together. The link is pretty old but you'll get the picture.
My goal is to give teachers an experience in which they see this type of lesson not simply as an add-on but as a replacement for some of the normal classroom lessons. After modeling exponential decay with bounce height, we're going to do some discussion modeling a la 5 Practices. I really should get a kickback for how often I plug that book. Then we're going to switch into teacher mode and look at the CCSS Math Practice Standards and NCTM's Principles to Actions Math Teaching Practices. It's amazing how naturally you can hit multiple standards--about 5 of the #CCSSmath and 5 of the #NCTMp2a without trying that hard. The rich conversations we have in class after these rich lessons help lay the foundation of conceptual understanding that procedural fluency builds on. If nothing else, I'll have a good time. Here's a link to the presentation. Quite a bit of time ago, I posted my intentions to review families of functions using Mary Bourassa's Which One Doesn't Belong format. This is a follow-up to that post. First, I feel overly proud of myself right now. I have all sorts of grandiose ideas I never follow through on. I did this one! Originally, I planned for this:
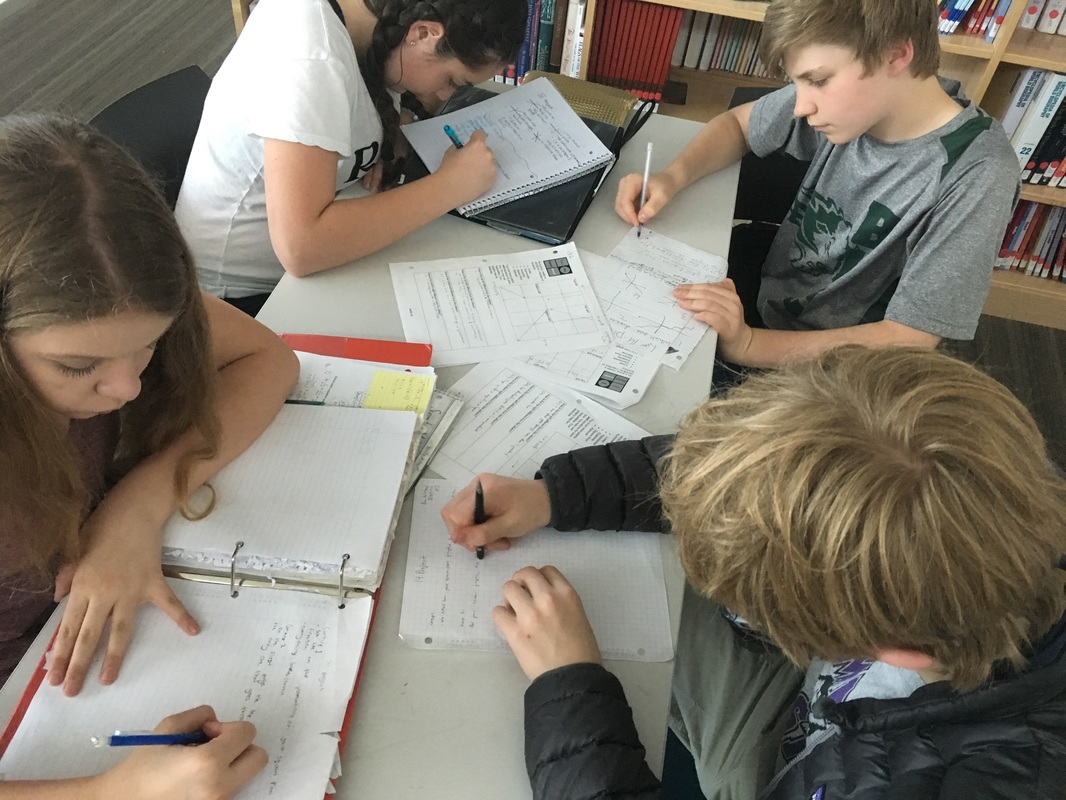
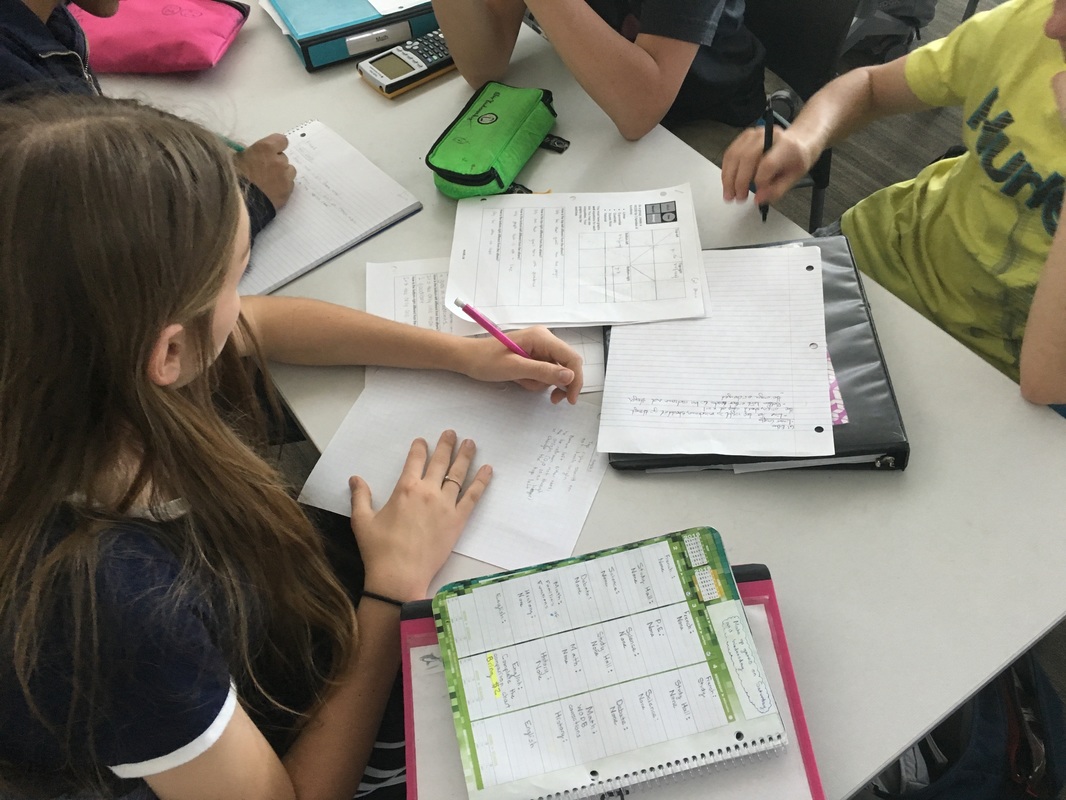
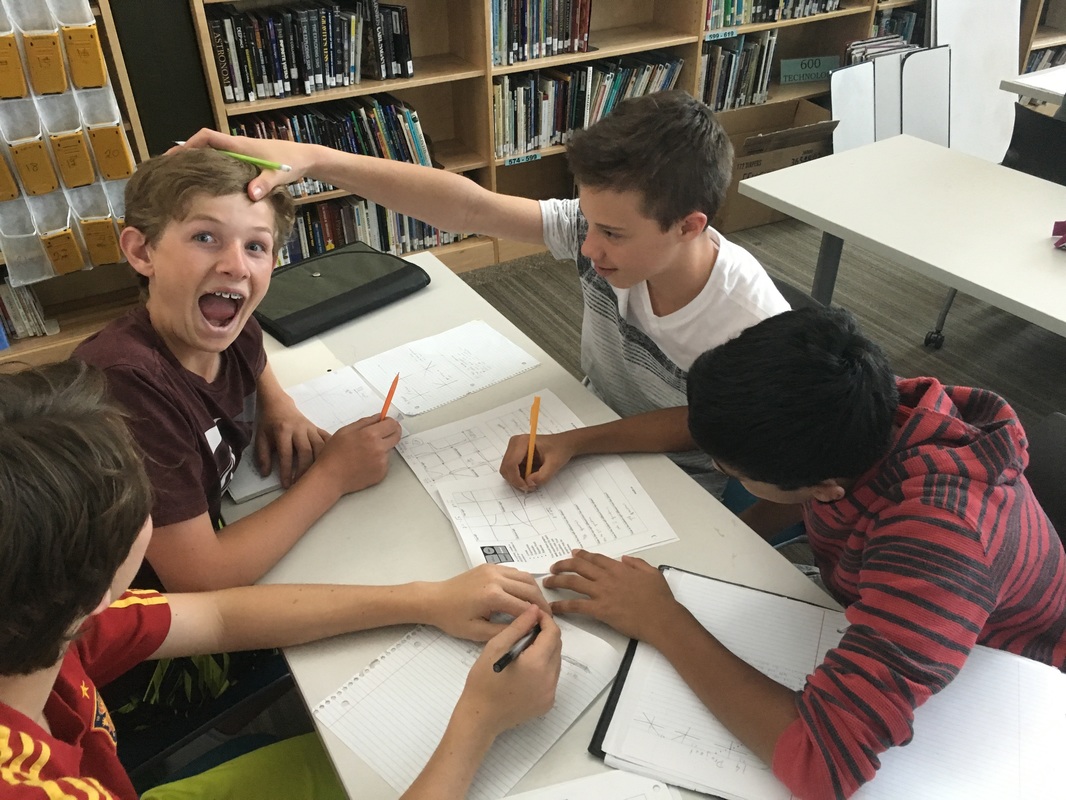
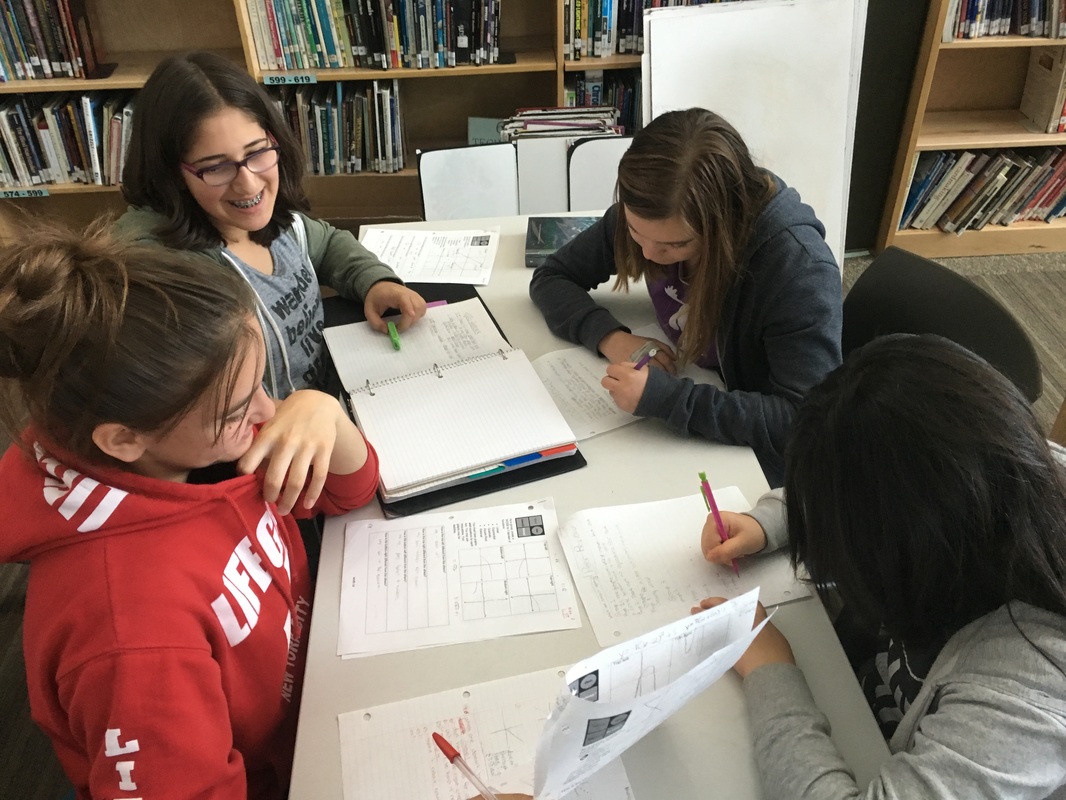
Here's what happened. 1. Groups of 4 worked really well. I had to help a couple of groups with their 'dynamics'. All groups were able to make progress without my help. I did have to give some clarification about what I wanted but I didn't have to help with the math.
2. No groups wanted to use the whiteboards. They wanted to sketch the options on the handouts or in their notes. I didn't expect that. Normally, they jump at the chance to do some white-boarding. I'll have to ask them about that. I also pulled in a chromebook cart into my classroom for the activity so students could choose to use graphing calculators or Desmos. Here the students surprised me again. Most chose calculators instead of chromebooks. 3. Handout needs some slight tweaking. See #5. 4. Rather than doing a w.o.d.b. on shapes, we did one on rational functions. I shot myself in the foot a bit here. I wanted students to compare and contrast within a family of functions not between the families of functions. The example I chose had one function that wasn't a rational function. I should have caught that. Next year. 5. Students did an impressive job making connections between representations. Next year, I plan to change the directions regarding the graphs. This year, I said "sketches of graphs" were okay. Turns out, they were in no way okay. Apparently, my concept of "sketch" is different than almost all of my students' concepts of "sketch". Next time, I plan to require an "accurate" graph and put a grid inside the 4 boxes. Hopefully, that fixes the differences in expectations. While I'm at it, I probably should require that all the graphs have the same window. Here's a quick selection of student work. I'll talk a bit more about how the days went after the picture show. 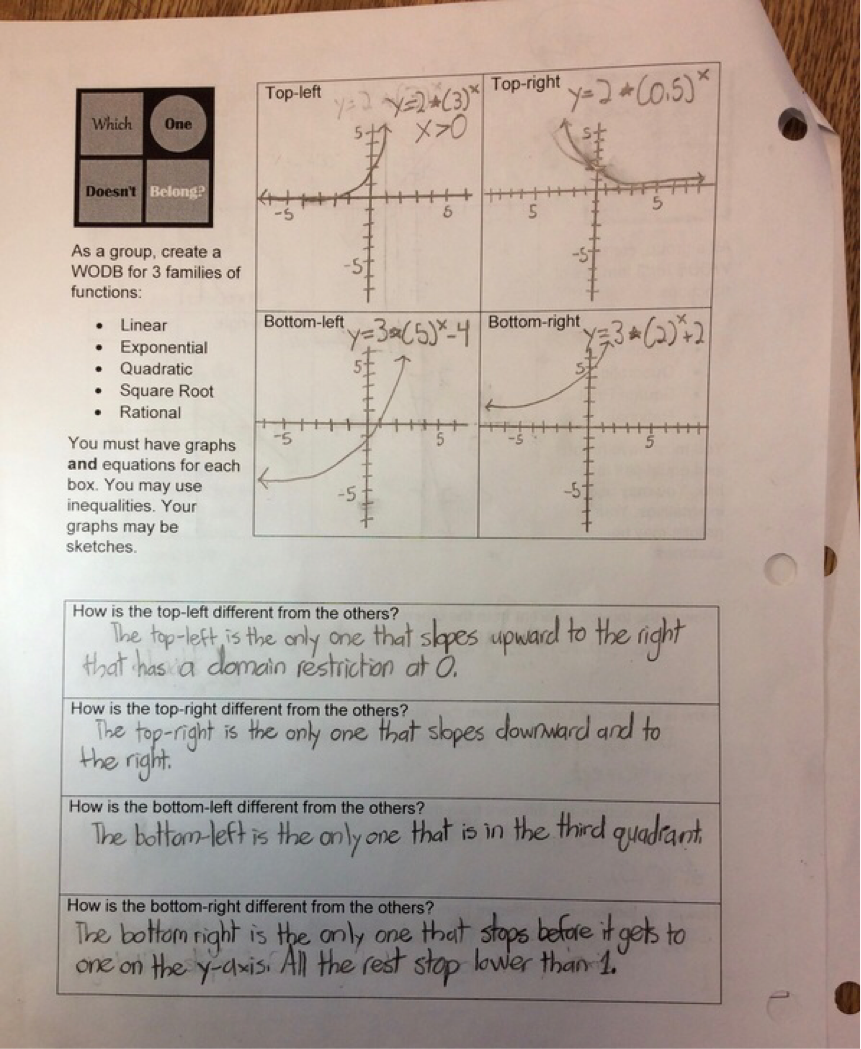 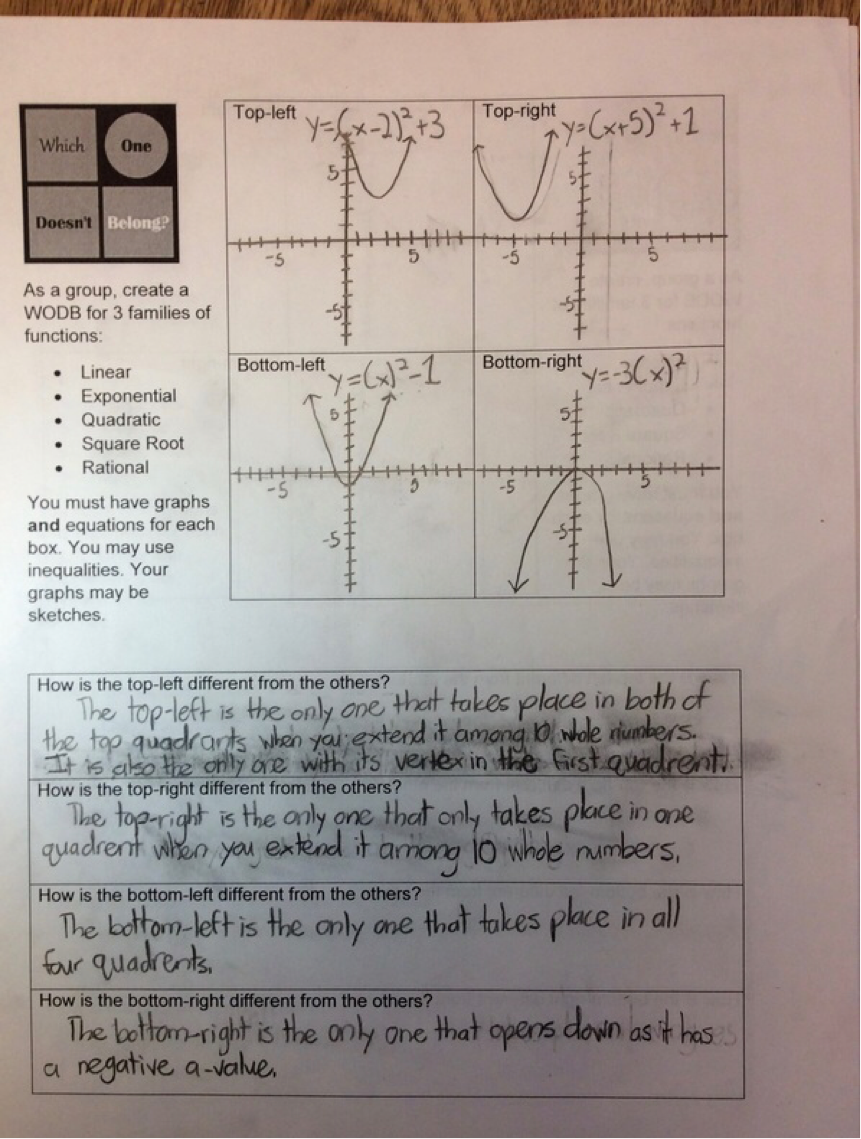 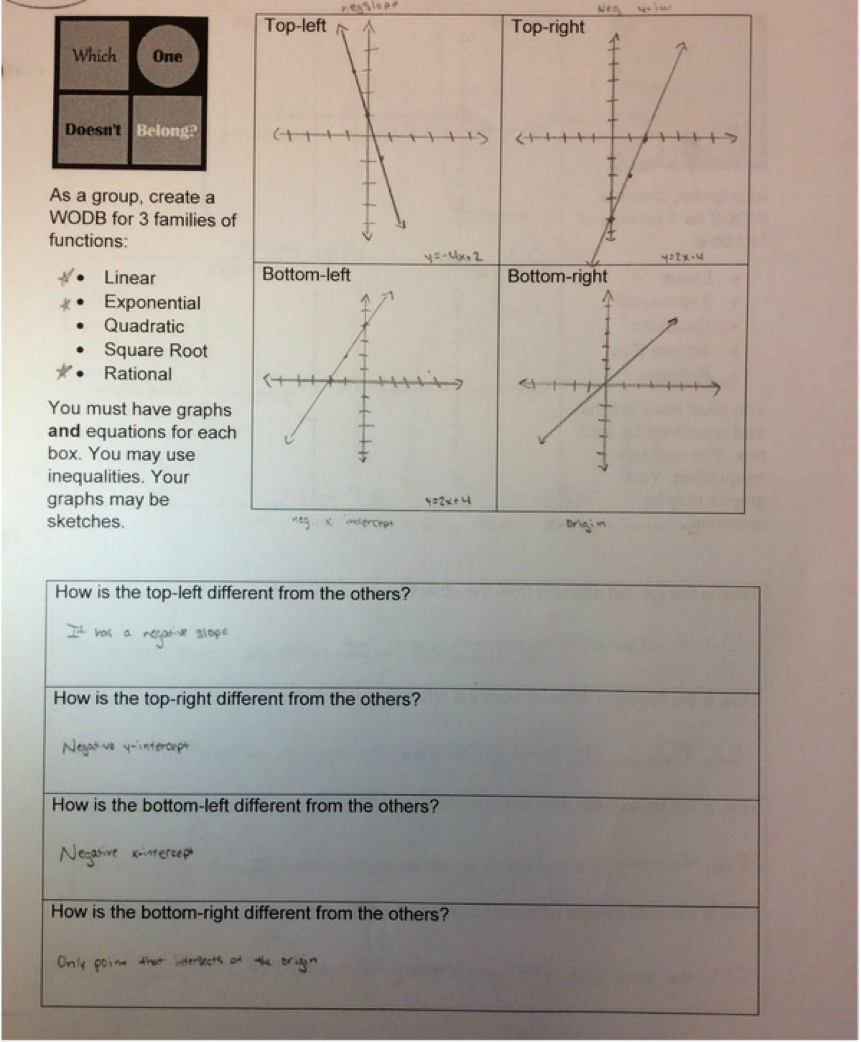 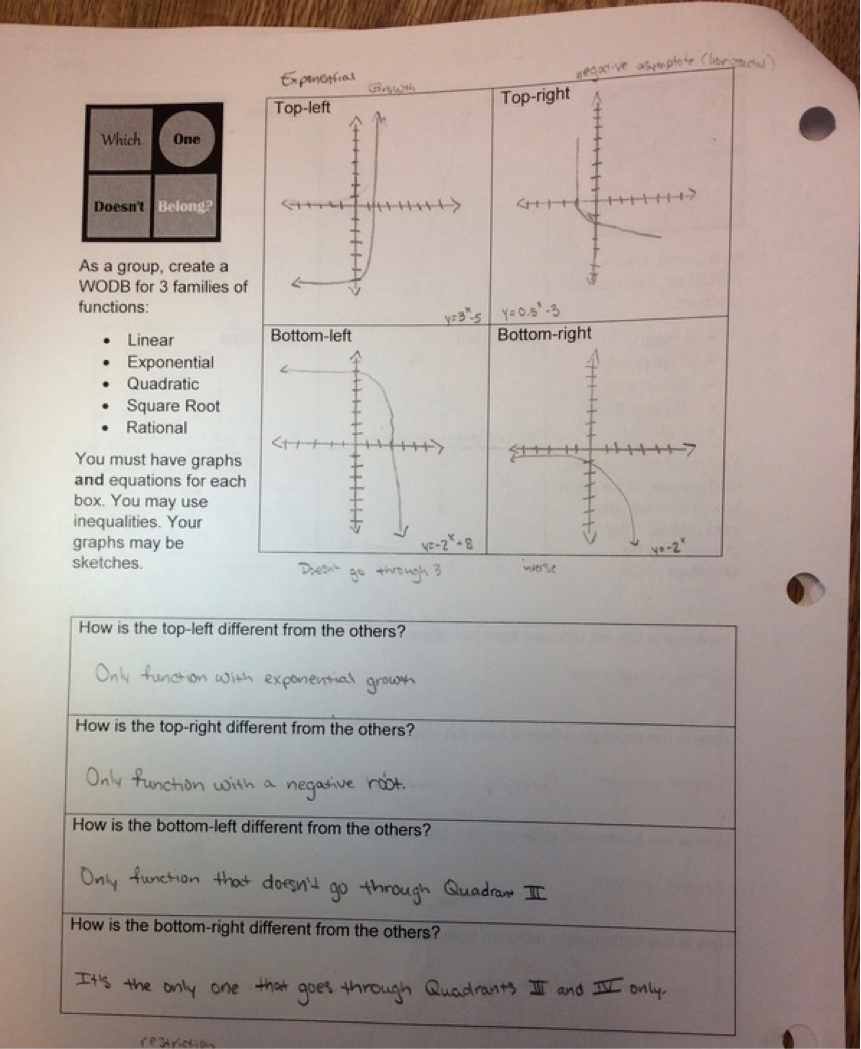 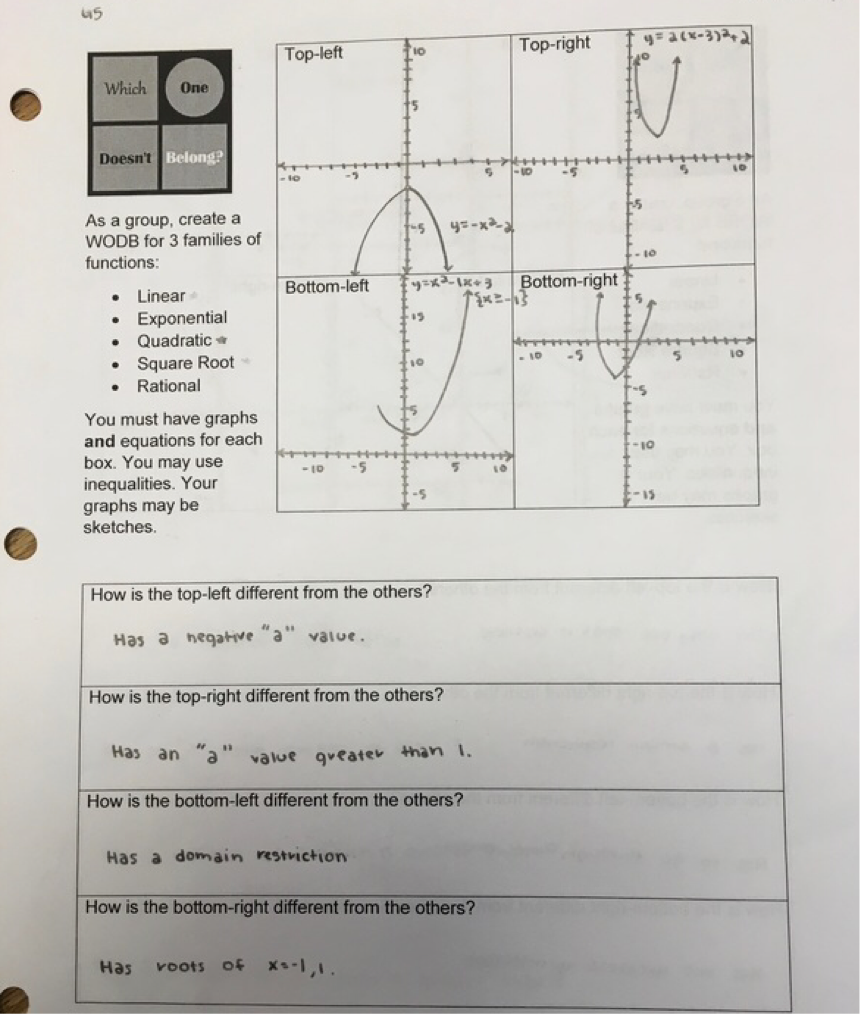 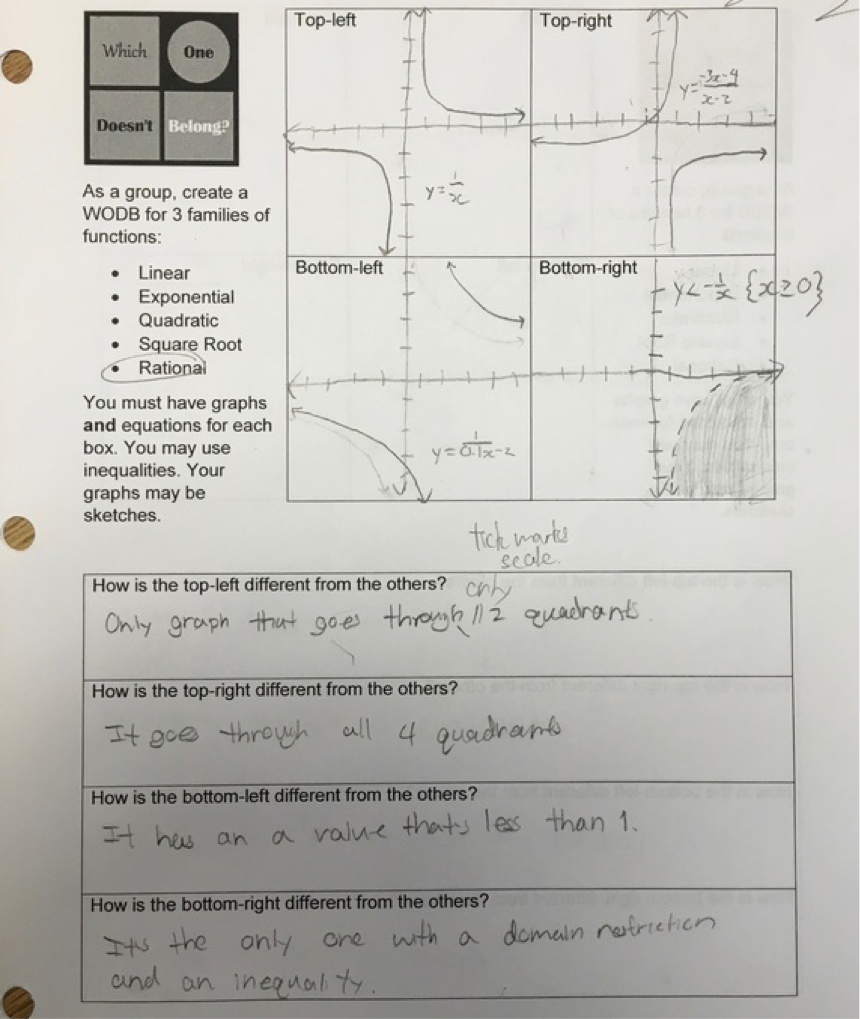 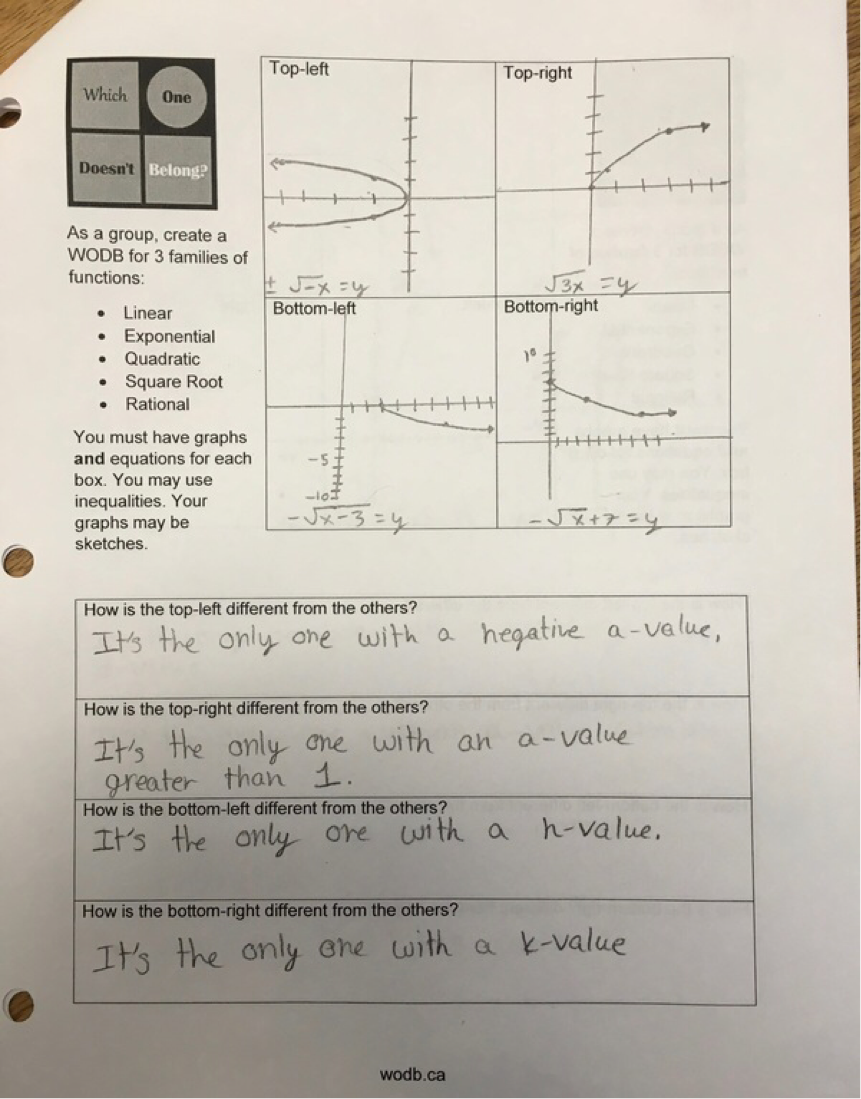 Day 1: I didn't know what to expect. As it turns out, this task was easier for them than I thought it was going to be. After groups rocked out a quick w.o.d.b. on lines without a whole lot of effort, I did ask them to make the distinctions more interesting. For example, when making a w.o.d.b for lines, please don't use 1) positive slope, 2) negative slope, 3) zero slope, and 4) no slope. That works, but it's a little too basic for end of the year Algebra students. Most groups finished one of the families of functions on this day. Day 2: Most groups finished their other two families of functions. Those that didn't finish needed to finish at home. Day 3: Peer revisions! Students worked collaboratively to create the w.o.d.b. for all three families. Mostly this worked well. However, in some groups there was a feedback loop of bad advice and/or misconceptions. The logical voice didn't always win out over the loud voice in the groups. I took a play from our English and History departments and decided to spend a day doing peer revisions. I shifted the groups, so that every member of the group was now with a different group. (Group 1 Student 1, Group 2 Student 1, Group 3 Student 1, and Group 4 Student 1 are now all in a group together.) Students gave each other great feedback. Afterwards, students went back to their original groups and shared the criticisms. Then groups had a chance to revise their work before handing it in to me the next day.
All sorts of wonderful things can be said of Mary Bourassa's Which One Doesn't Belong. This year I've started incorporating it for new families of functions in Algebra 1. We have great 10 minute discussions about how each of the options could be thought of as not belonging to the group. In light of these brilliant compare and contrast sessions we have throughout the year, I plan to attempt a review project having students create their own WODB for different families of functions. Here's the plan:
Here's my handout. The file is linked below. 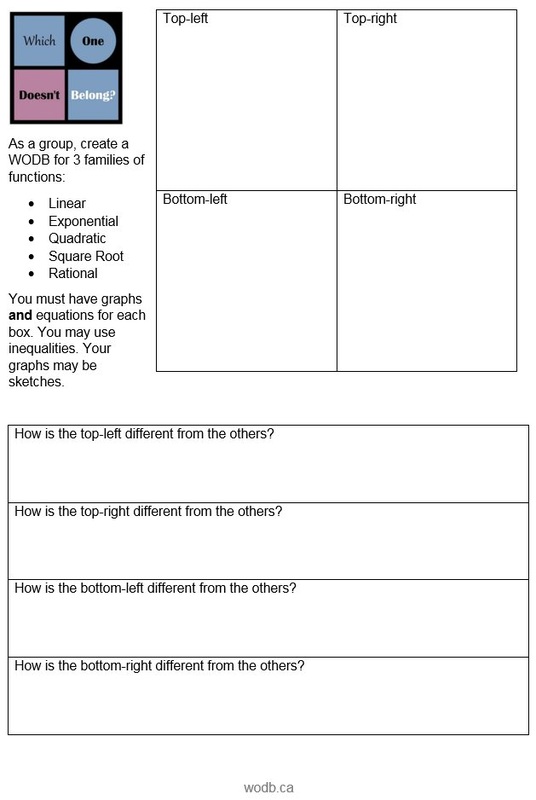
Today we did some applications of exponential functions in Algebra 1. Particularly, I want these kids to find math interesting and enjoyable. I had an old activity involving checkers from a CPMP textbook that was the seed for this idea. We began by discussing the oil spills of the Exxon Valdez (1989) and the BP Deep Water Horizon (2010). I try to be as intense and dramatic as possible. These are environmental catastrophes; I want students to feel the weight of the situation. The BP Deep Water Horizon was the US’s largest oil spill ever. After the Deep Water drilling rig exploded--killing 11 people--the oil well continued to release oil into the ocean for another 87 days. All in all, 206 million gallons of crude oil were put into the ocean in the Summer and Fall of 2010. However, the worst oil US spill in terms of environmental damage happened 25 years ago in 1989 when the oil tanker Exxon Valdez ran aground in waters of the Prince William Sound near the Kenai Peninsula of Alaska. An estimated 11 million gallons of oil spread on the waters and shoreline of the area, endangering wildlife. How do you begin to clean up such a mess? [students respond in all sorts of manners] How long do you thing it takes? [students again respond with very uninformed opinions]. Enter the checkers activity. I start with 80 red checkers in a tote bag and 20 black checkers representing an oil spill. I also have about 5 or 6 small bins with 20 red checkers in each for use in the activity. Experiment (from Core-Plus Mathematics Project)
I ask a student to record the number of black checkers left on the whiteboard. As I go around, students take turns taking out 20 checkers. We then figure out the number of black checkers left. I let the student on the whiteboard make up his/her own organizational structure. It ends up being a decent discussion point for the class about what they like or what they would like to see in order to help understand the data better. Sometimes the data works out really well (like in 1st period today). Sometimes it doesn't (as in 7th period today). Either way, it helps students begin to get their heads around the idea that oil is harder to clean up as the days progress. The easy oil gets cleaned up early on. The harder oil stays around for quite awhile. The graphs below show two possible outcomes of the pollution and cleanup simulation. I ask students about which option they think best represents the situation. 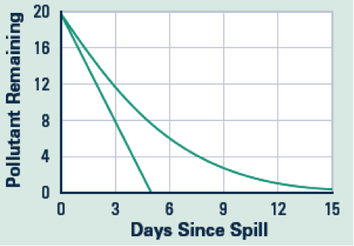 After a brief discussion, in which every class brought up that the probability of getting a black checker goes down every time, we try to create a mathematical model for our little experiment. Here's what 1st period's table looked like: x | 0 | 1 | 2 | 3 | 4 | 5 | 6 | y | 20 | 16 | 13 | 11 | 7 | 6 | 6 | We talk about what kind of patterns we see in the table. Every class I've ever had goes for rate of change. So we look at the differences. I'm not about to intercede at this point. After some more discussion the class comes to a consensus about the starting-value for the exponential function: a = 20. (We use the general form: y=a(b)^x). Then I have students work in pairs to try to find the b-value. Of the 12 different groups in two different classes today, I only had 2 groups not treat the multiplier, b, like the slope. Groups had all sorts of values. They took the average difference and plugged it in for b. They took the average difference, turned it into a percent and subtracted that from 1. I could go on, but you get the idea. Me: "What does the b-value stand for in the equation?" Kids: "The multiplier." Me: "Is that what you found?" Kids: "Yes. No. We found the difference." Me: "Is that the multiplier?" Kids: "No." Me: "How would you find the next y-value in the table from where we are at now?" Kids: "You would divide 16 by 20." Kid2: "Wait! That means we can find all the b-values and then average them." Kids: *murmers of agreement* Me: "You have another 3 minutes to fix your equations with your groups. Go!" The class comes back together and we discuss the results. Then I bring up the next slide in the presentation. This is the 25th anniversary of the ecological disaster caused by the Exxon Valdez. Unfortunately, we don't have data for this situation like we did for our experiment with the checkers. Figuring out how much oil is left involves paying people to take samples and do studies--lots of money. Now, 25 years after the fact, some people have gone back to check on the area (I have the study linked in the ppt). On the surface, things seem to be recovering well. However, when they began to look under the surface, literally, things weren't so pretty. Of the holes they dug, something like 58% of them showed visible signs of oil. It's been 25 years and things still aren't okay. They now estimate that there is still somewhere between 16 and 21 thousand gallons of oil still in the local environment. How might we go about fitting a model to this data? In y=a(b)^x, the 'a' value is given with the 11 million gallons of oil originally spilled. We now have another point (25, ___). Every class picked a different number to use for the associated y-value. Some wanted to take the average of 16,000 and 21,000. Others wanted to use 20,000 because it was an easy number to work with. We plug in our a-value along with our point (25, 20000) and we end up with 20000 = 11000000(b)^25. Now we graph both sides of the equation to find our b-value. The conversation then shifts back to the gulf coast. Just last month, BP was found as grossly negligent prior to the oil spill. The company faces fines up to 18 billion dollars. How do you think the Federal Judge in the case came up with the number 18 billion? How long do you think it will take to clean up? After the lesson, several students went home and did their own voluntary research into the situation. I don't think I've ever had that happen before. We ran out of time to talk about the ongoing disaster at the Fukushima Nuclear Power Plant. My problem ideas for that are in the attached lesson. The ppt presentation goes over the BP Deep Water Horizon and the Exxon Valdez oil spills. My current textbook has zero applications of exponents outside of scientific notation. It doesn't even cover the concept of exponential functions. Since I'm still a strong believer in homework, I had to make my own worksheets. This is one of the skill and application worksheets I used this chapter. It took me less than 10 minutes to make the key. Hopefully, it's about the right length for students (I expect somewhere around 30 minutes per night).
CCSS
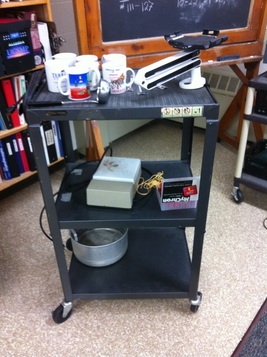
• HSF-LE.A.1 Distinguish between situations that can be modeled with linear functions and with exponential functions. • HSF-LE.A.2 Construct linear and exponential functions, including arithmetic and geometric sequences, given a graph, a description of a relationship, or two input-output pairs • HSF-LE.B.5 Interpret the parameters in a linear or exponential function in terms of a context. • HSA-SSE.A.1 Interpret expressions that represent a quantity in terms of its context.★ • HSF-BF.A.1 Write a function that describes a relationship between two quantities.★ • HSF-BF.A.2 Write arithmetic and geometric sequences both recursively and with an explicit formula, use them to model situations, and translate between the two forms.★ We explored exponential functions in Algebra 2 recently. I had planned on using the NCTM Illuminations lesson: Too Hot to Handle Too Cold to Enjoy since this past summer. However, as I've become more comfortable doing experiments in my classroom and gotten better at creating my own investigations I decided to steal the idea and make it my own.
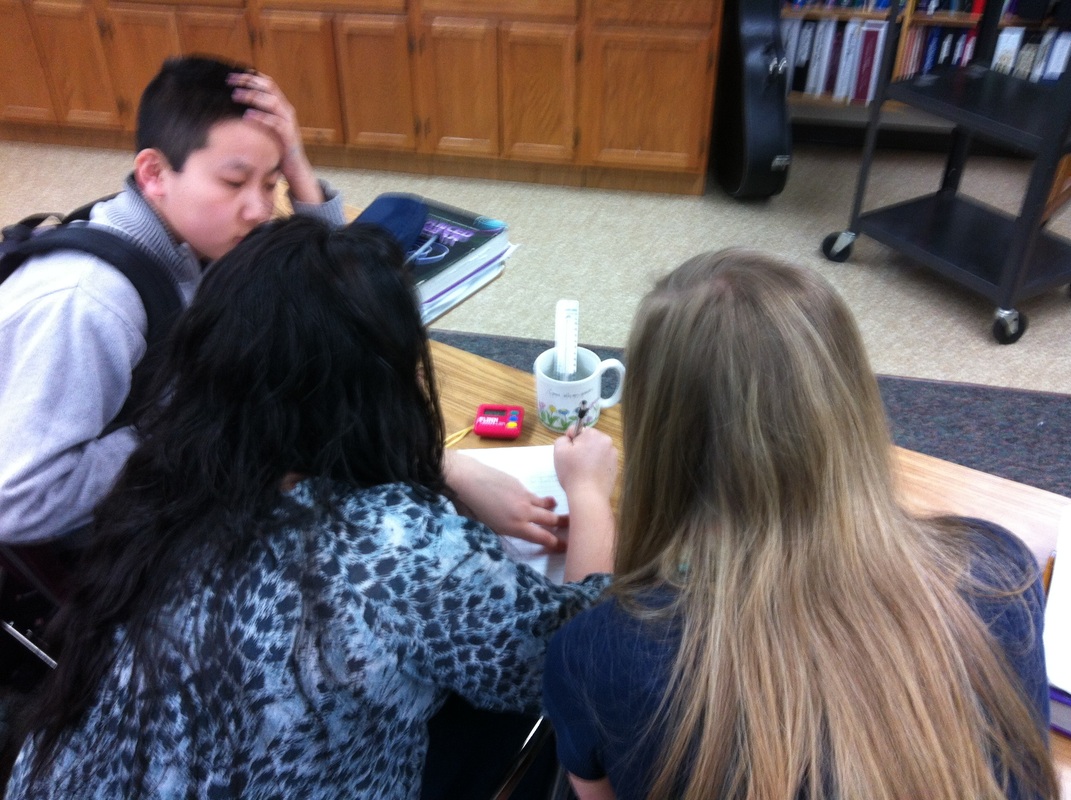
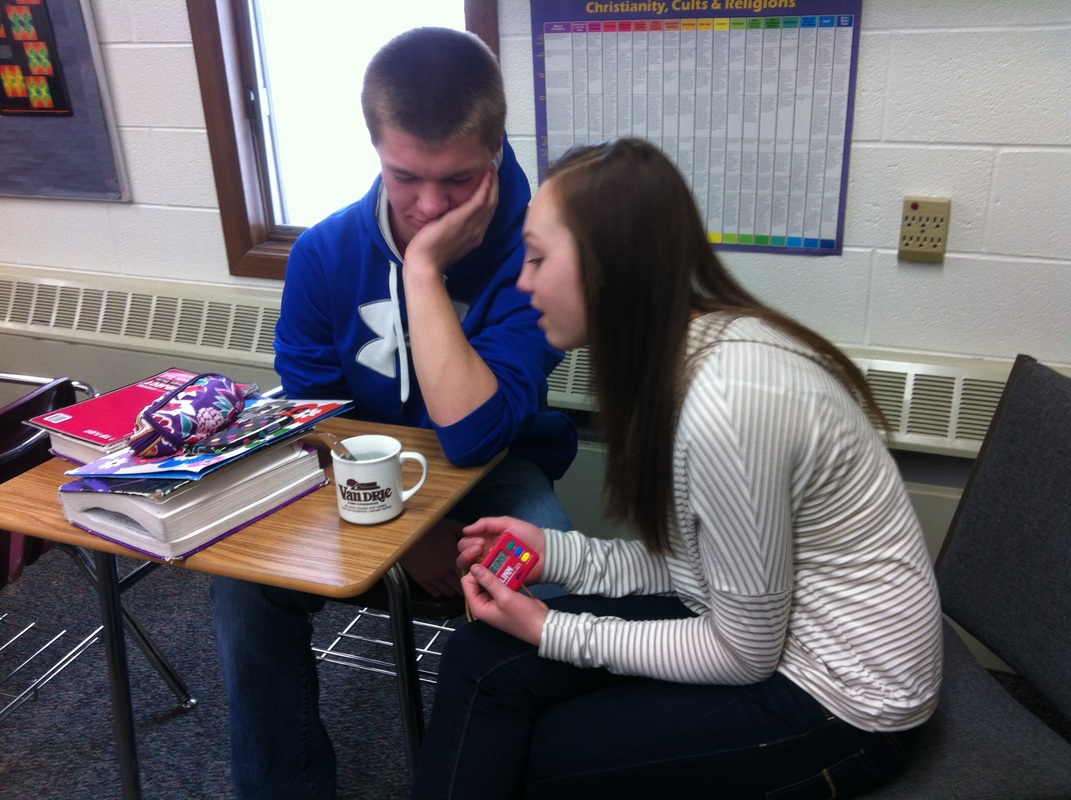
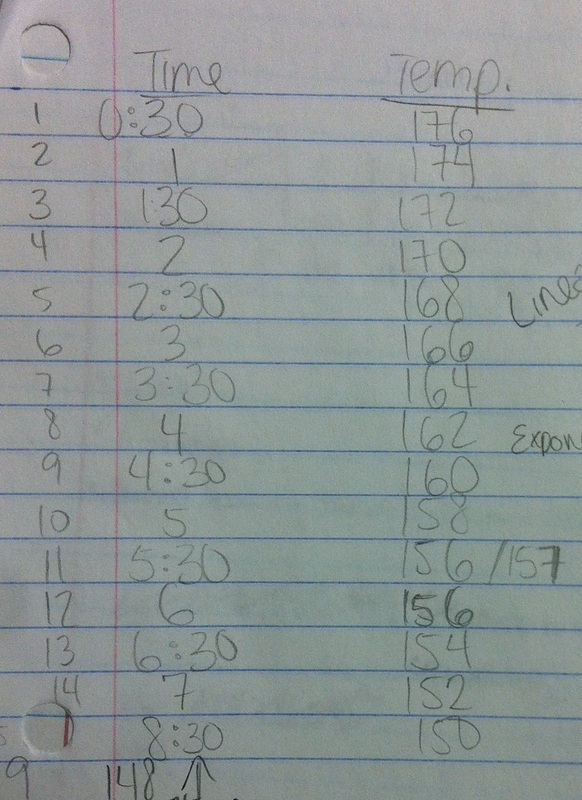
I introduced the experiment talking about the McDonald's lawsuit back in the 1990's over a elderly lady getting burned by a cup of coffee. We told some stories and ended up discussing that once coffee is 120 degrees, it's cold enough to not scald you and hot enough to still enjoy. I ladled out water to the groups and they set to work collecting temperature data based on the amount of time that had passed since they first started measuring.
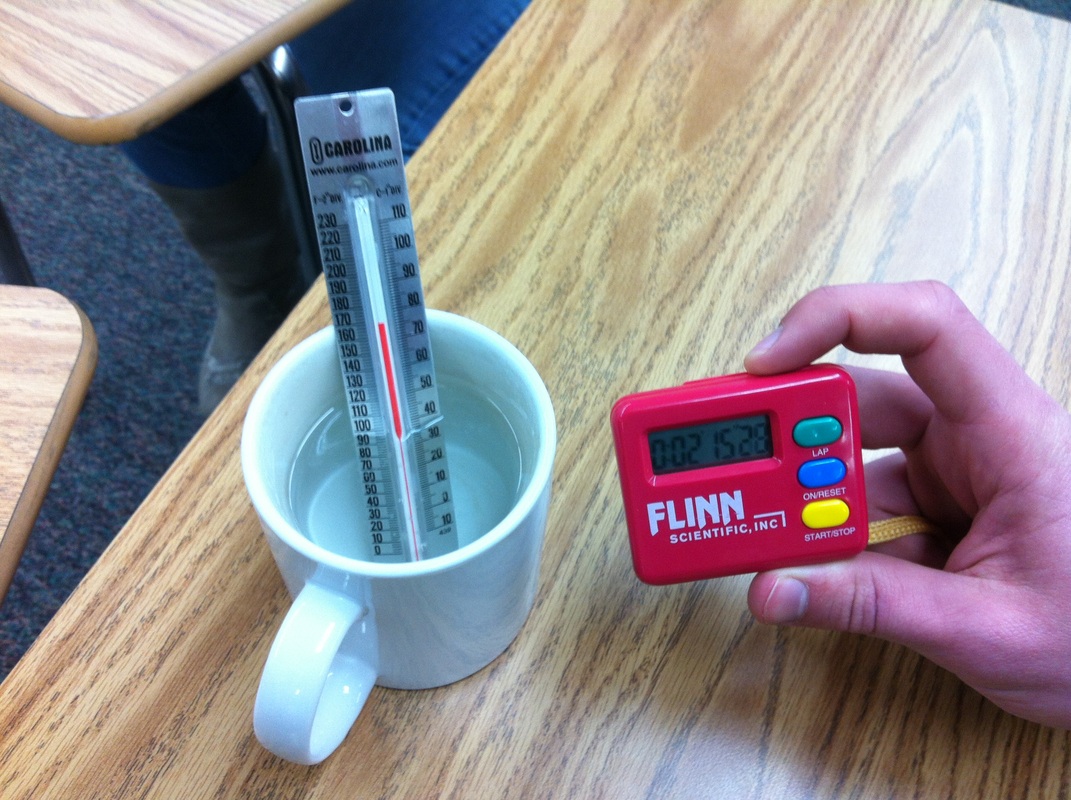
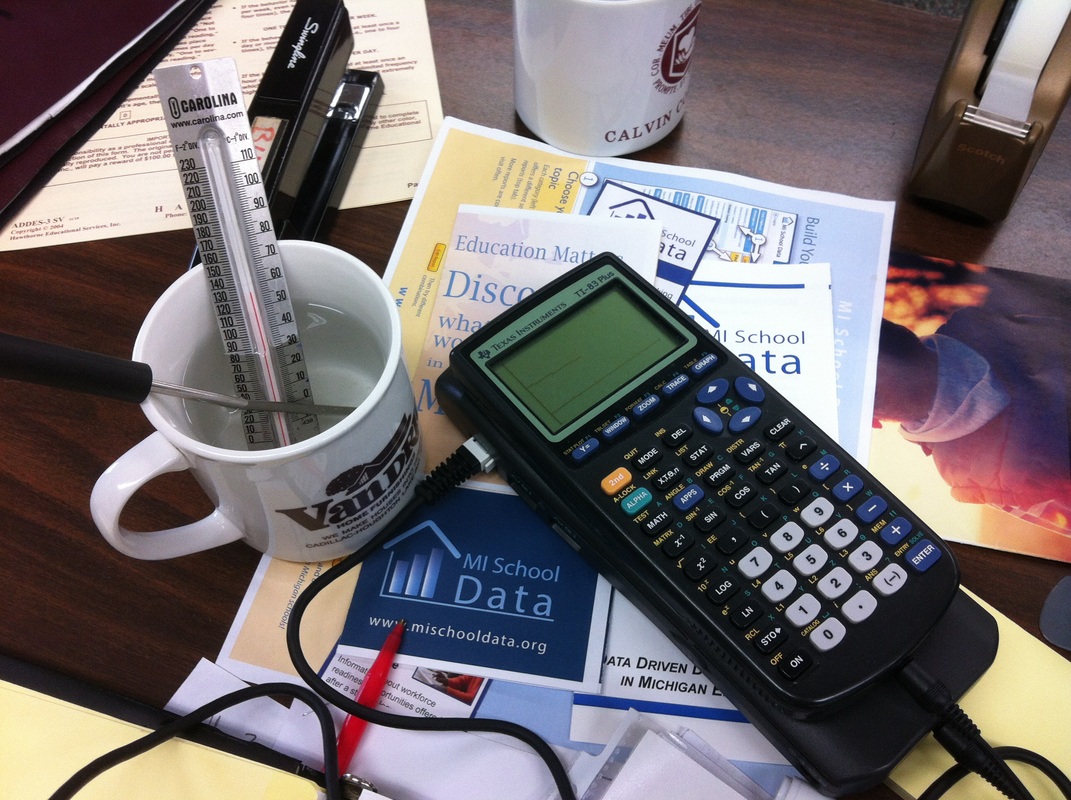
Things didn't go well--or at least as well as I had hoped. In the picture below, you can see the tools the students were working with. The thermometer was hard for them to read accurately. As a result, several groups got data that was pretty much linear.
Once the students started in on the process of modeling the data, I had to make a quick decision. I hadn't planned on the data showing up linear and students were asking me what kind of model I wanted. I chose to have them make the model they though best fit their data. Here's some samples of student work. 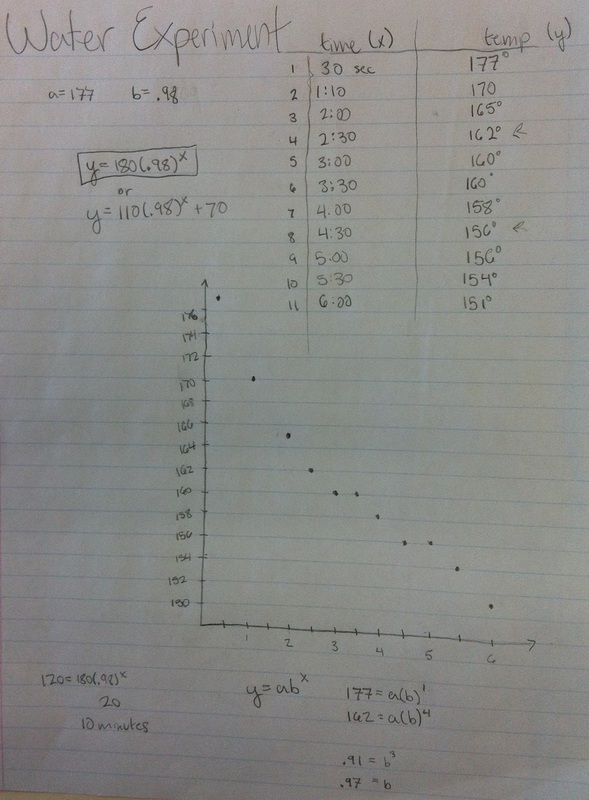
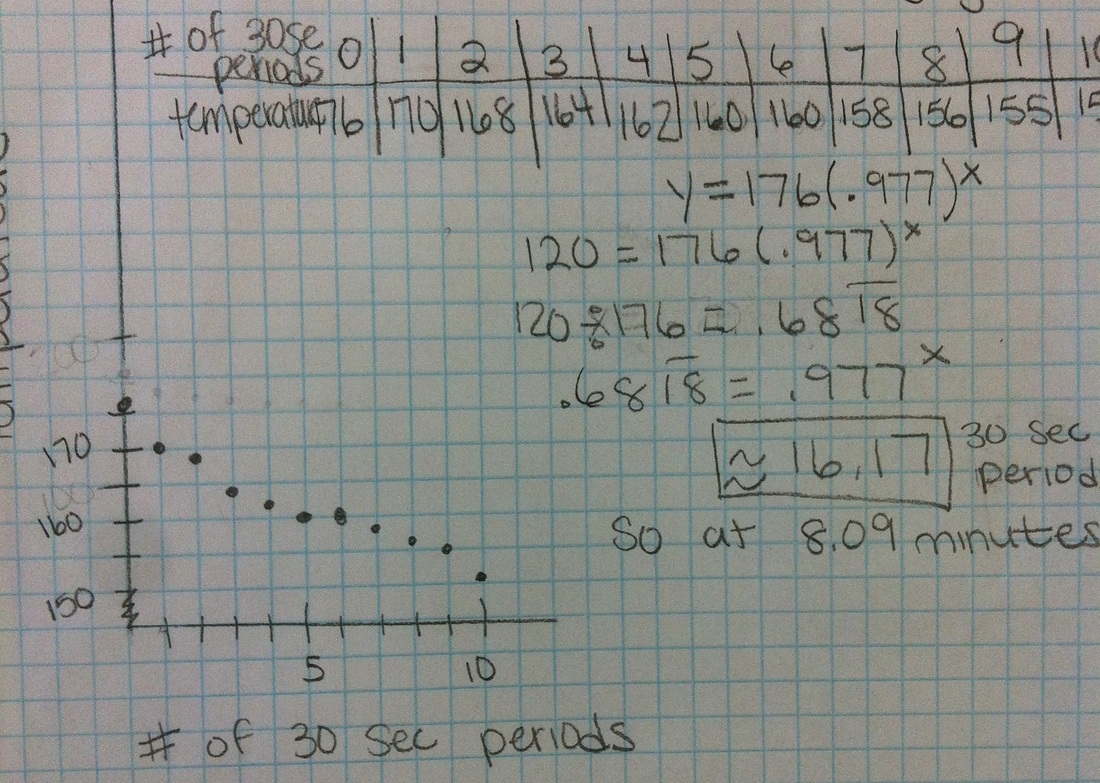
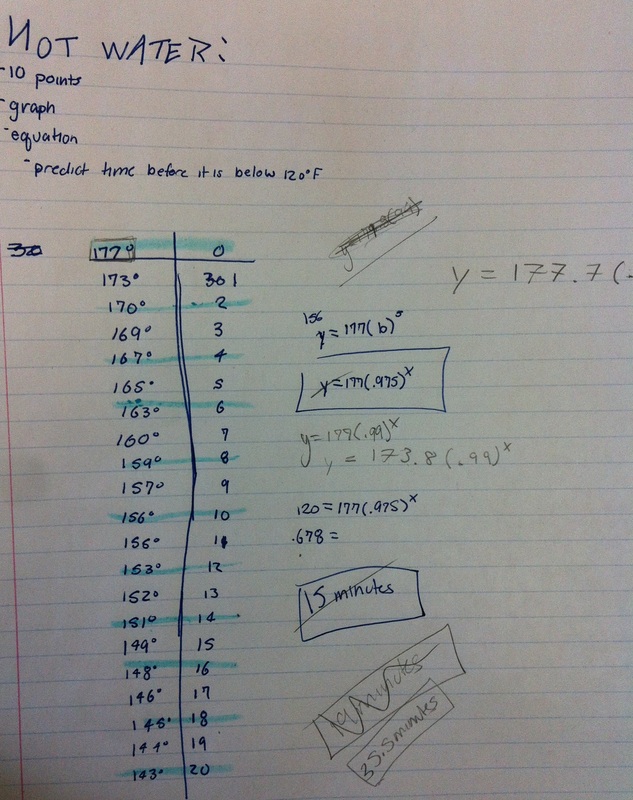
Here we had a great discussion about how well the model fits the data AND the situation. All but one of my groups went for an exponential decay model. However, all but one of those groups got the model wrong. They did well enough finding growth factors and starting values but they didn't take into account the horizontal asymptote for an exponential decay function; it's always at y=0. This means for all of the above functions, when we made a scatterplot on our calculators and graphed our equation at the same time, the equation went down much faster than the data--even when using exponential regression. Then the group below presented. They realized the horizontal asymptote needed to be at room temperature so they looked at the thermostat in my room. Then they proceeded to subtract 70 degrees from each of their data points before creating an equation. After finding an equation, they translated the equation back up by 70 degrees. Brilliant! 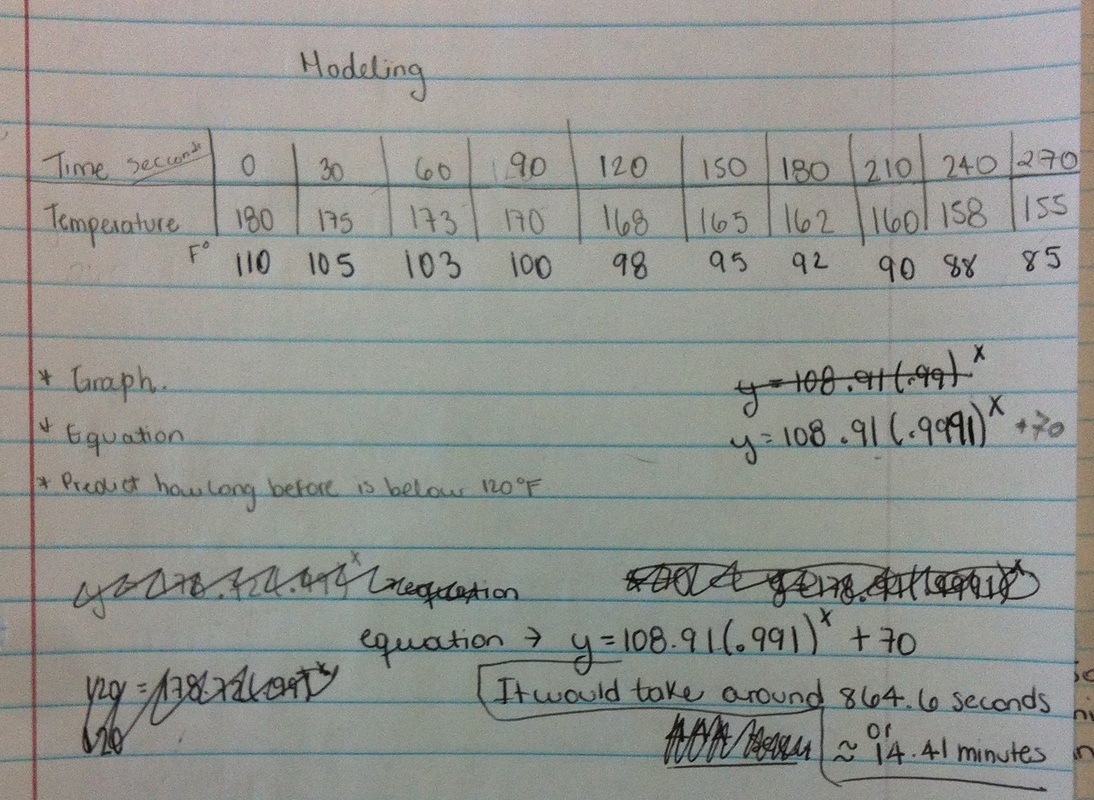
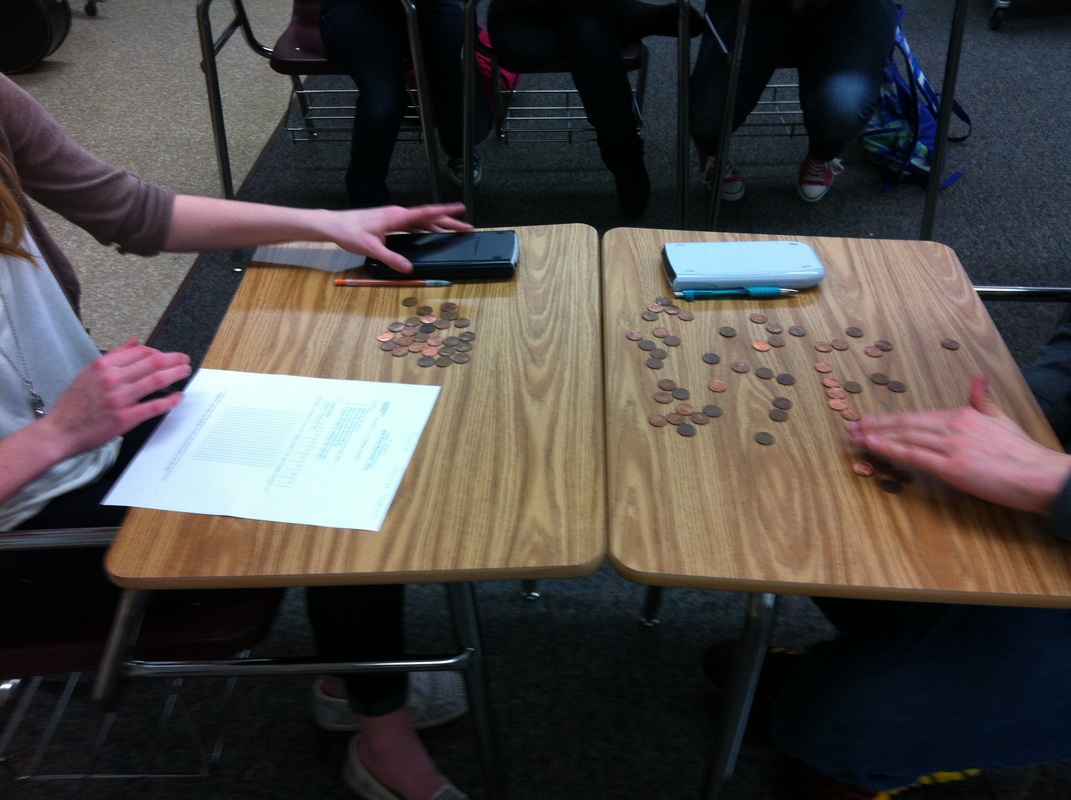
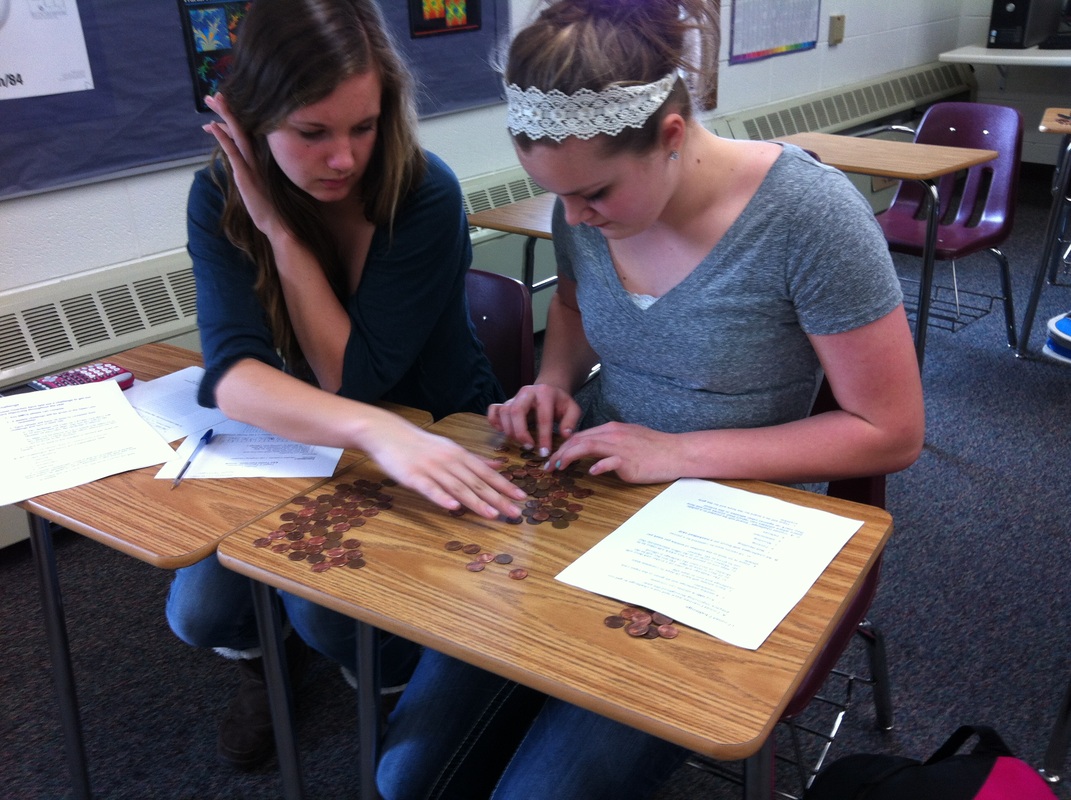
After students get somewhat used to exponential functions and nice neat numbers, I like using this activity. It helps students use what they know about a situation to come up with an ideal equation but then to fiddle with it in order to find a better fit. The process begins by pairing up and playing with pennies (my handouts are at the bottom of this post). I need to be up front with you--you need a lot of pennies. I have a large yogurt container full of pennies and I normally run out. Because I don't have an infinite supply of pennies I have groups alternate whether they start with the growth or decay portion of the activity. To model growth, each group starts with 10 pennies and then drops them on the desk. Students count the number of pennies heads up and then add that many pennies to the next drop. This process happens a total of 7 times and by the end groups have a desk full of pennies. Think of a lot of pennies, then think bigger. My highest group had something like 220 pennies by the end. To model decay, each group starts with 100 pennies and then drops them on the desk. Students count the number of pennies heads up and then takes away that many pennies for the next drop. Again, the process happens 7 times. This one is a whole lot more manageable. By the end it's not unusual for groups to have a 0 as the last value in the table.
After collecting the data, students come up with an ideal equation to model the situation. We have to talk through this one. Students should not use the information in their tables to find this equation. I want them to think of the situation and tell me what the equation should look like: growth, y=10(1.5)^x and decay, y=100(.5)^x. Then I have students use their calculators to create a scatterplot of the data and graph the equation at the same time (step-by-step instructions on the handout). This is where we talk about needing to find a better equation. Some students use their tables to find and average growth factor. Some students just tweak the equation on the graphing calculator. Either way leads to a good discussion of the process of modeling and the messiness of real data. The kids have fun. I have fun. And it all happens in 42 minutes.
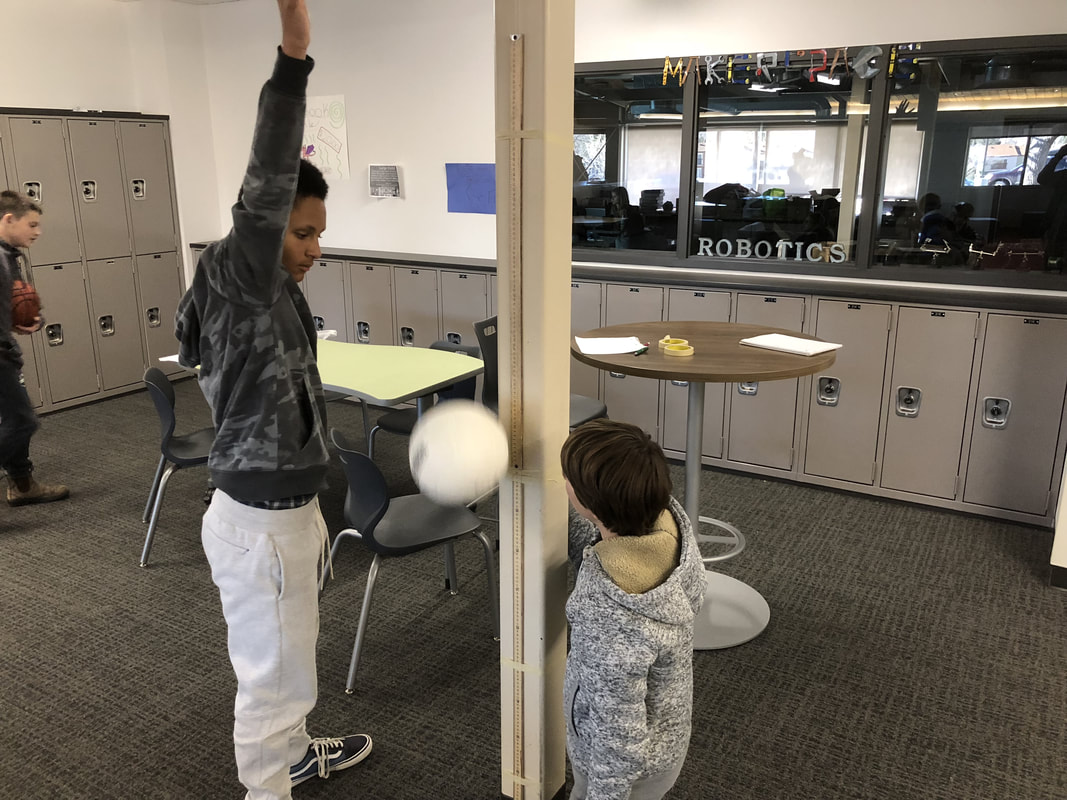
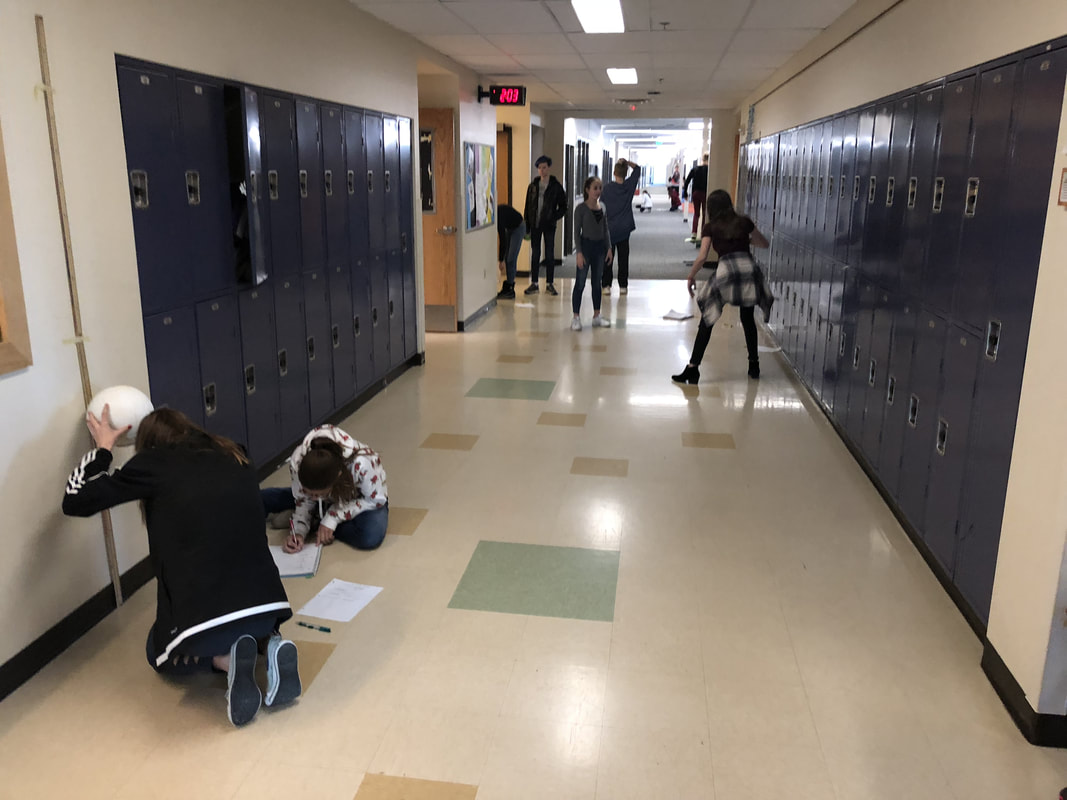
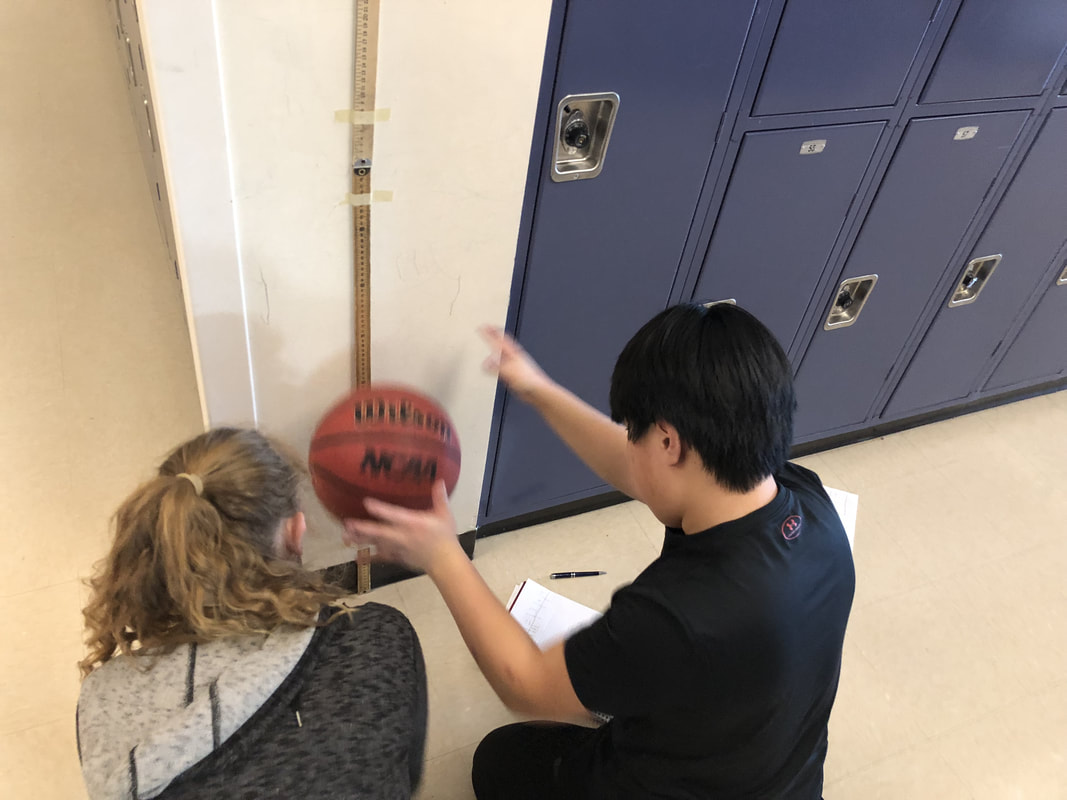
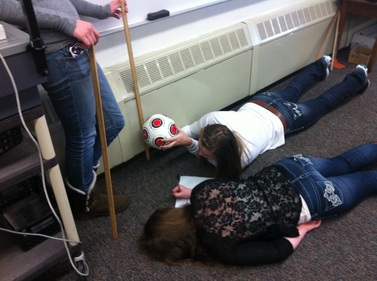 I absolutely love it when kids are out of their seats in my class... and on task. There was a point in class today where almost all my students were laying on the floor trying to figure out the height of the ball bounce. How cool is that? The lesson is pretty basic. I wrote up the lesson requirements on the board (see picture below). I'm not proud of it but it's all I had today. Note: even though we've been doing experiments all year, Algebra 1 still needs the suggestion to make a table; thankfully Algebra 2 does not. 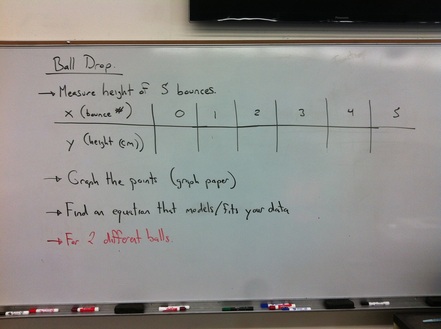 Gathering Data:
For the record, I would like to say that Freshman are awful at measurement. No matter how much we talk about precision, these kids coudn't get a correct height if their grade depended on it (it doesn't by the way). For all of our experiments/activities we measure in centimeters. Some of their measurements were at least 15 cm off. Really?
When analyzing the data, groups were pretty quick to realize that picking two random points to find the multiplier wasn't all that accurate. Several students suggested finding the multiplier between each successive bounce and averaging them; I felt like a proud parent. Then they proceeded to make linear equations using the multiplier like it was the slope; I no longer felt proud. We've still got work to do but at least we're having fun doing it.
Things have been more than a bit busy up in my neck of the woods. I feel like I'm doing good just to keep getting the kids out of their seats. Deep in my heart I know there must be a good question I can ask at the beginning which will elicit curiosity; I just didn't have the time to think of one. I'm all ears to those of you who have done this before. Luckily for me, playing with balls during math class was enough of a motivator for the students.
|

Andrew Busch
I teach Math at Ralston Valley High School in Arvada, CO. Categories
All
Archives
March 2019
|
||||||||||||||||||||||||||||||||||||||||||||||||
 RSS Feed

