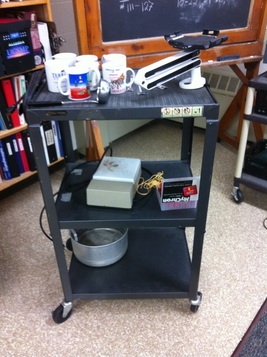
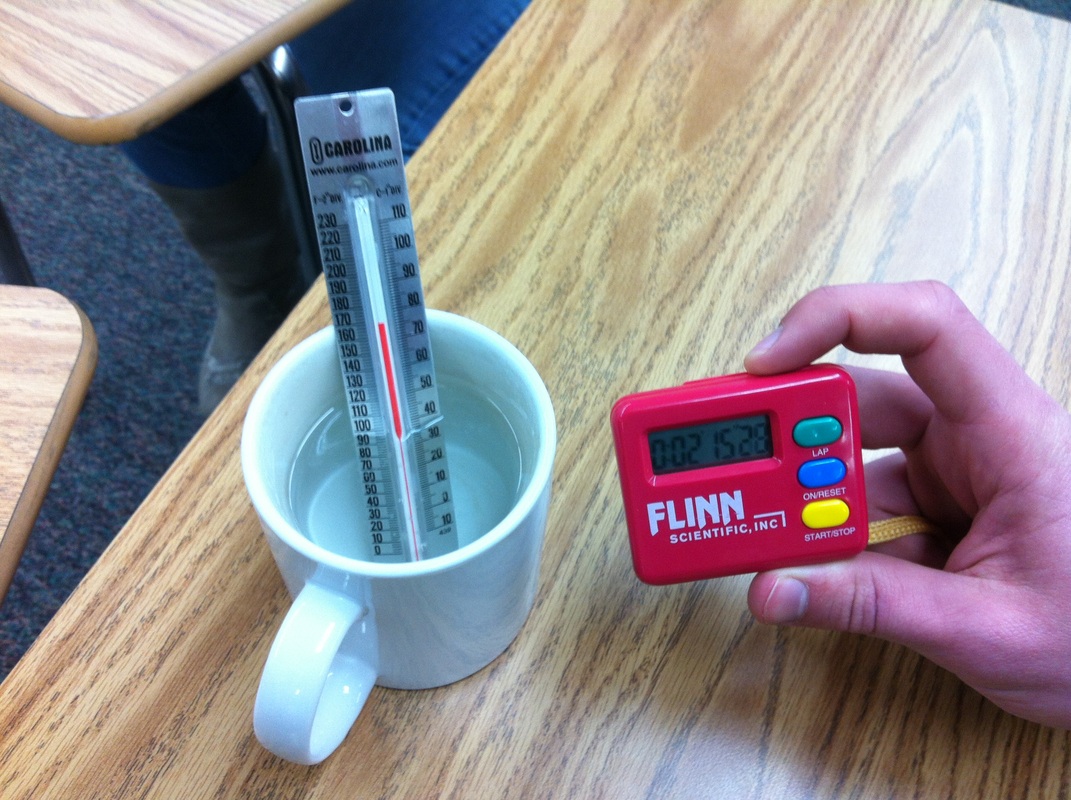
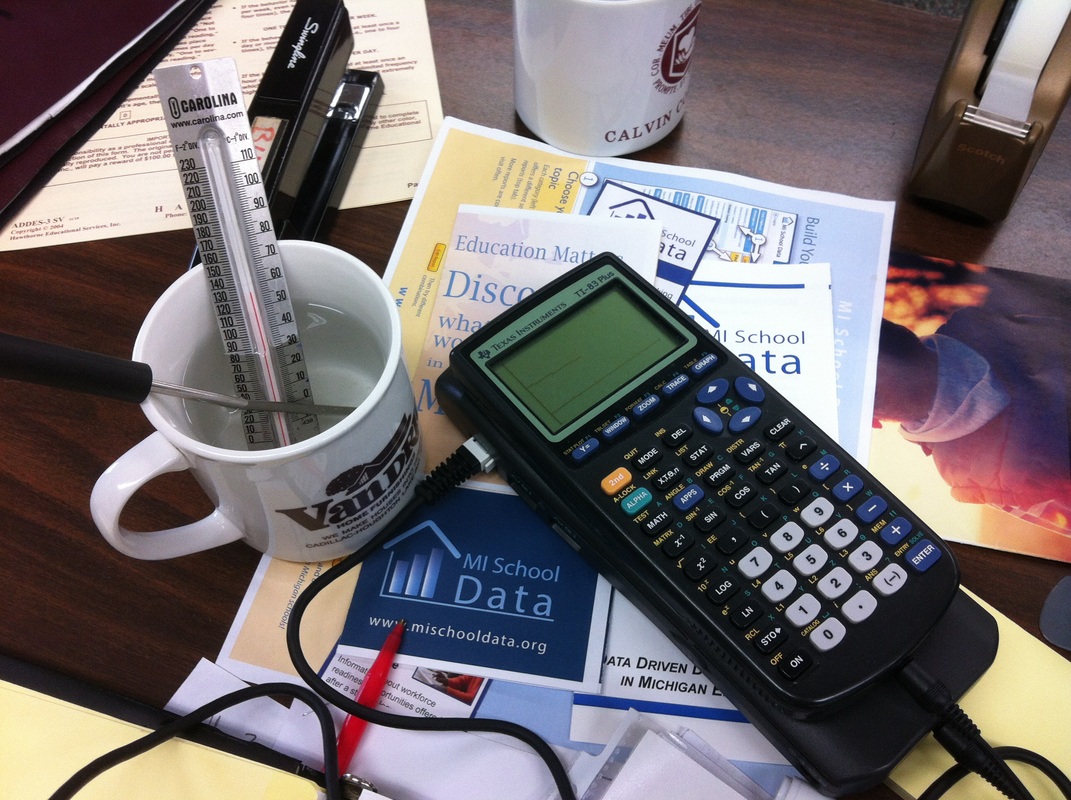
| The setup Gathering supplies wasn't so difficult--I basically raided various parts of the school: -stop watches, thermometers, and hot plates from the chemistry room -coffee mugs and a ladle from the teacher's work room -and a pot to boil water in from the kitchen. I wasn't sure how long it would take to boil water on a hotplate so I started it at the end of 2nd period. As it turns out, a pot of water never boils on a hotplate--ever. Over lunch I grabbed another portable stove from the chemistry room in hopes to get the water boiling by 5th period. We gained all of 10 degrees. By the time class rolled around we had 180 degree water. |
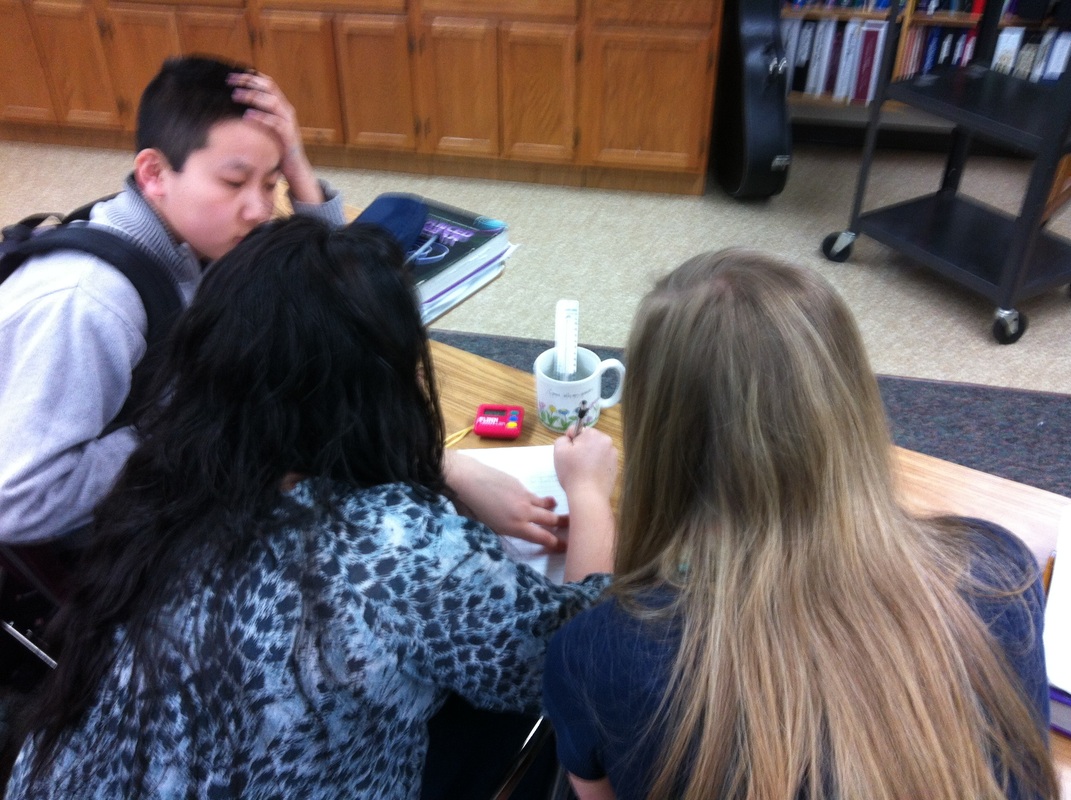
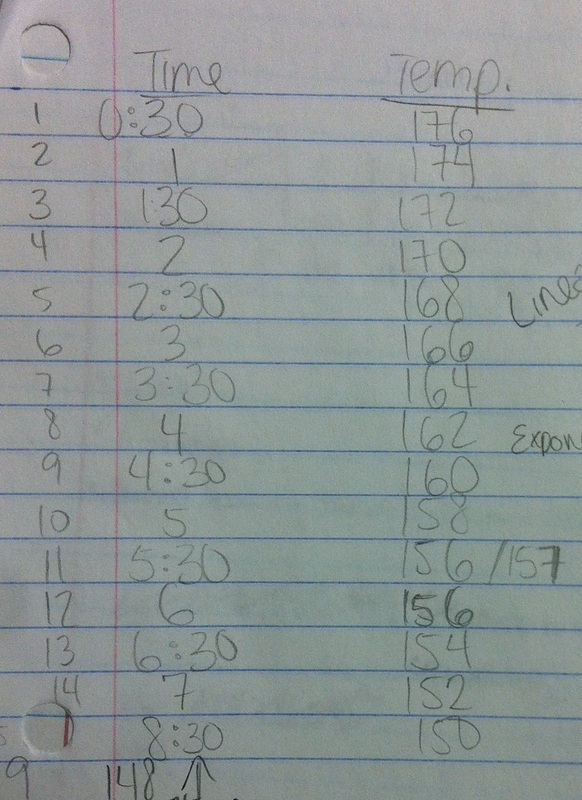
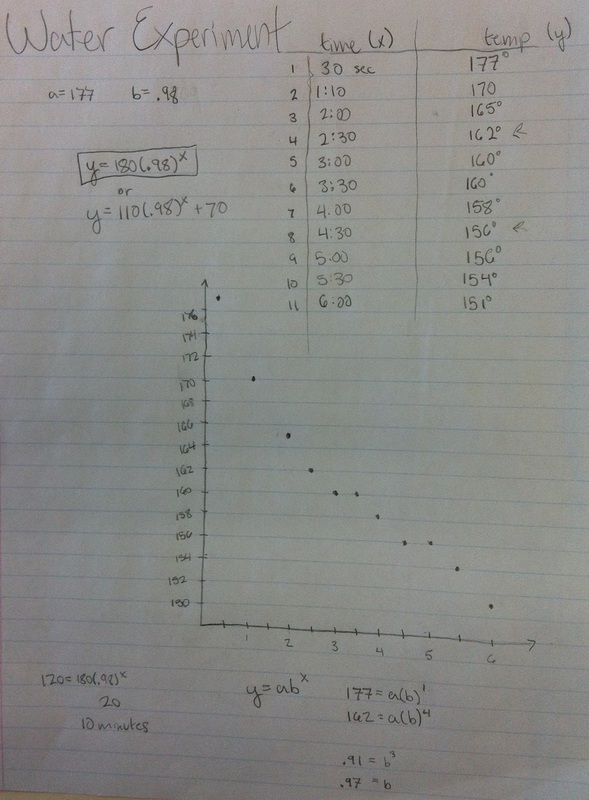
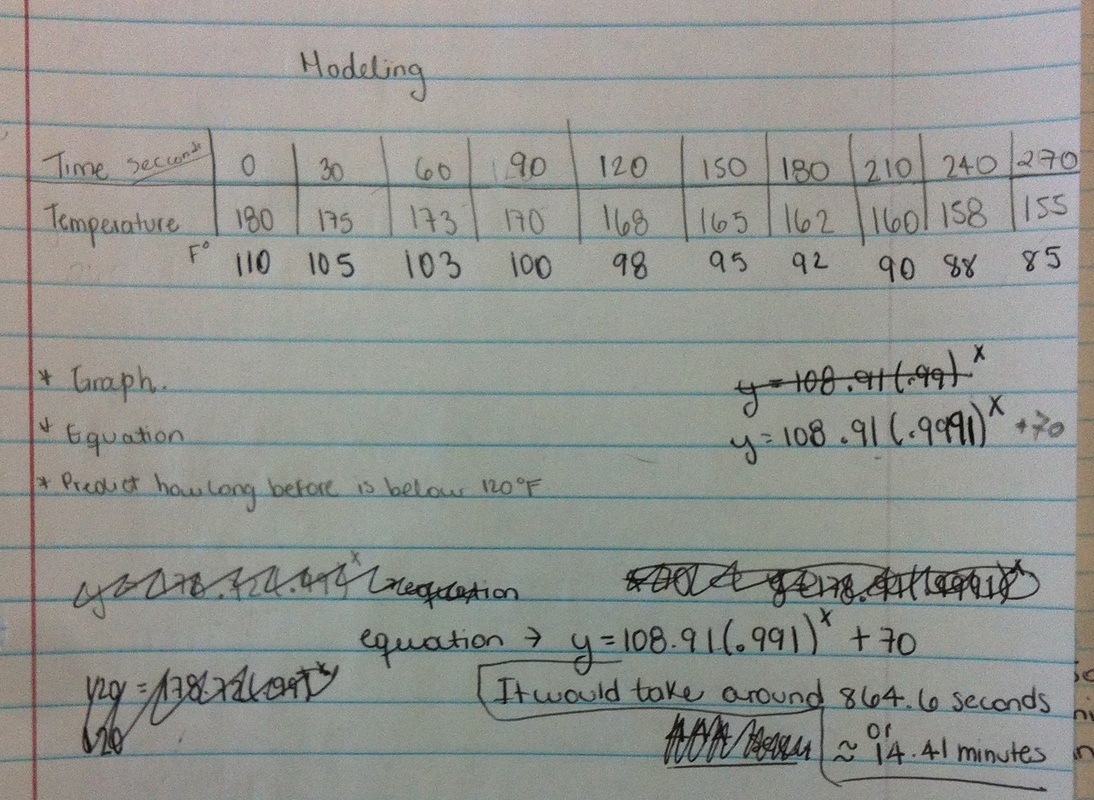
Then the group below presented. They realized the horizontal asymptote needed to be at room temperature so they looked at the thermostat in my room. Then they proceeded to subtract 70 degrees from each of their data points before creating an equation. After finding an equation, they translated the equation back up by 70 degrees. Brilliant!
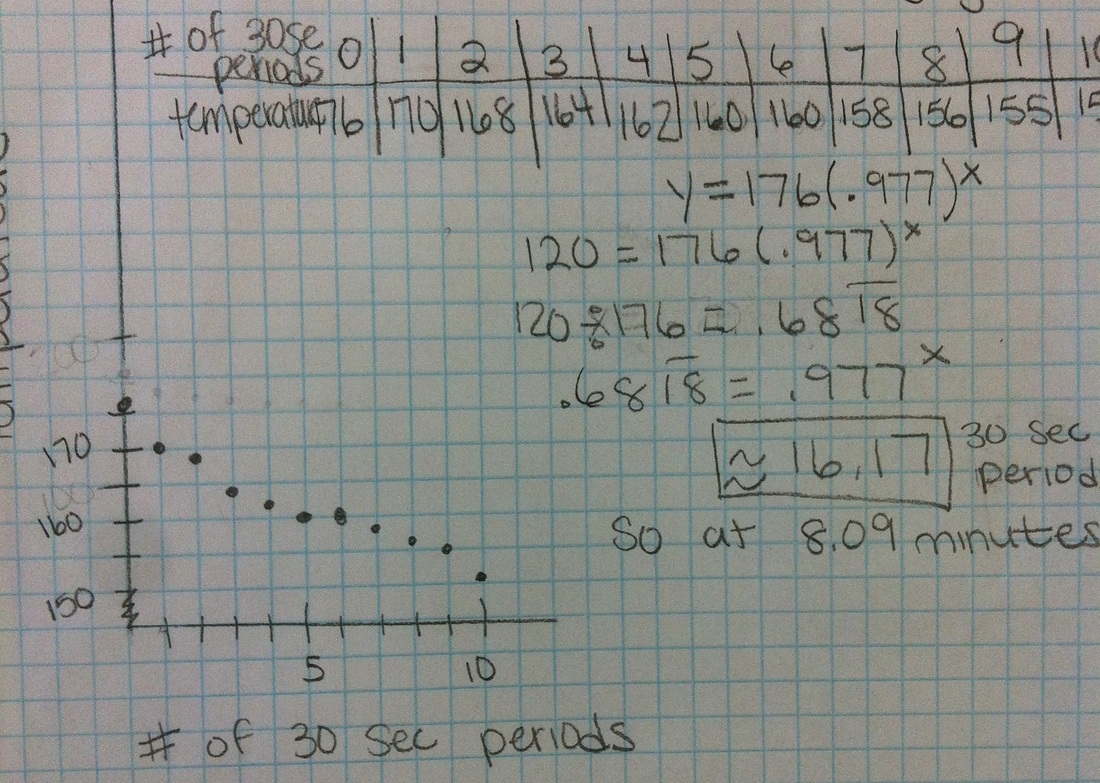
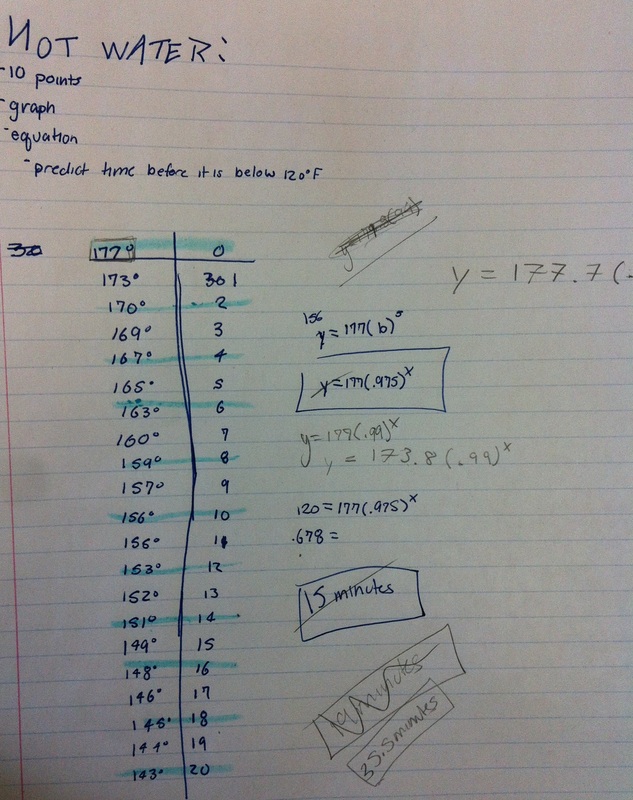
| After one of the groups finished collecting data points, I used their cup of water and my digital thermometer for the graphing calculator to gather some of my own data. Unsurprisingly, it's much easier to tell the difference between temperatures when the water is much hotter. If I was to do this again, I would either want boiling water, better thermometers, a video with a digital thermometer read-out along with the time, or maybe even just the data could work well (but that's on the boring end of things). |

 RSS Feed


