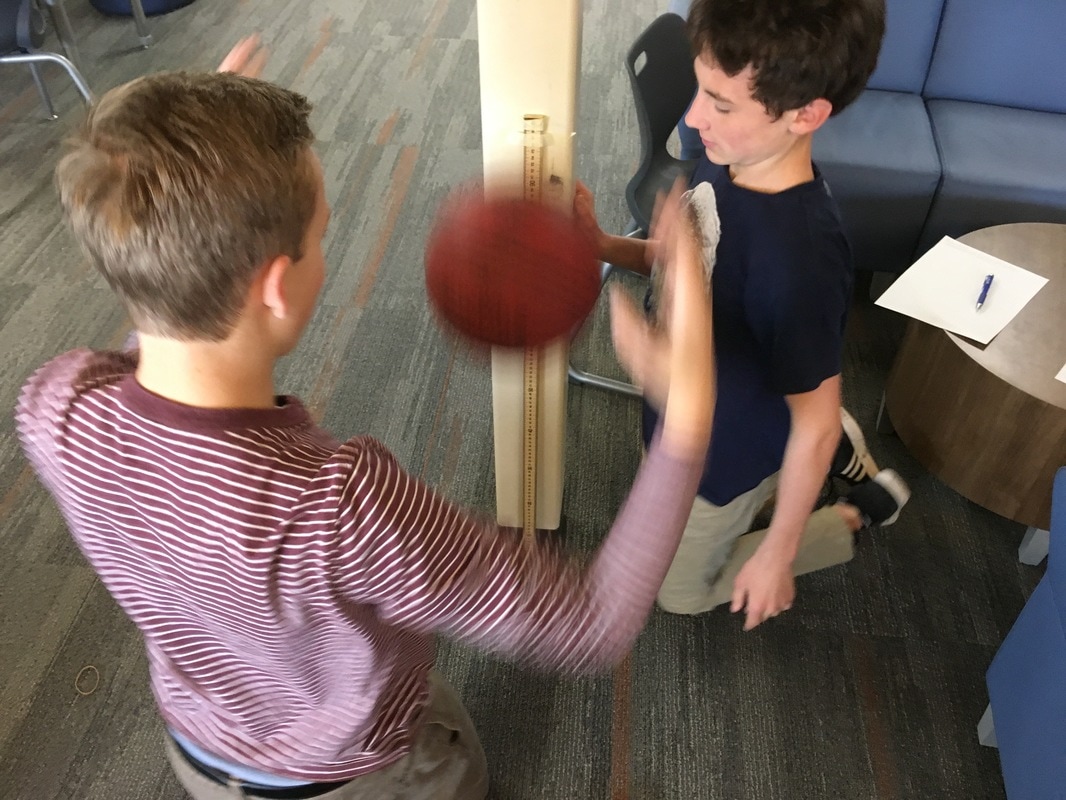
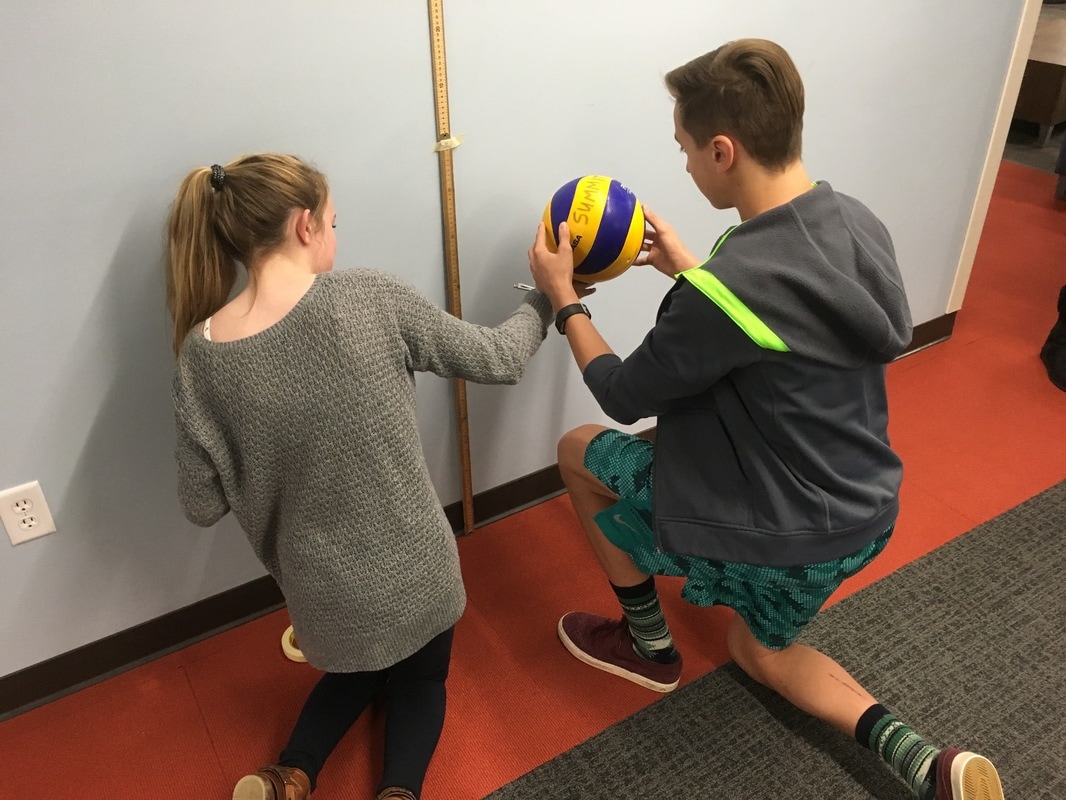
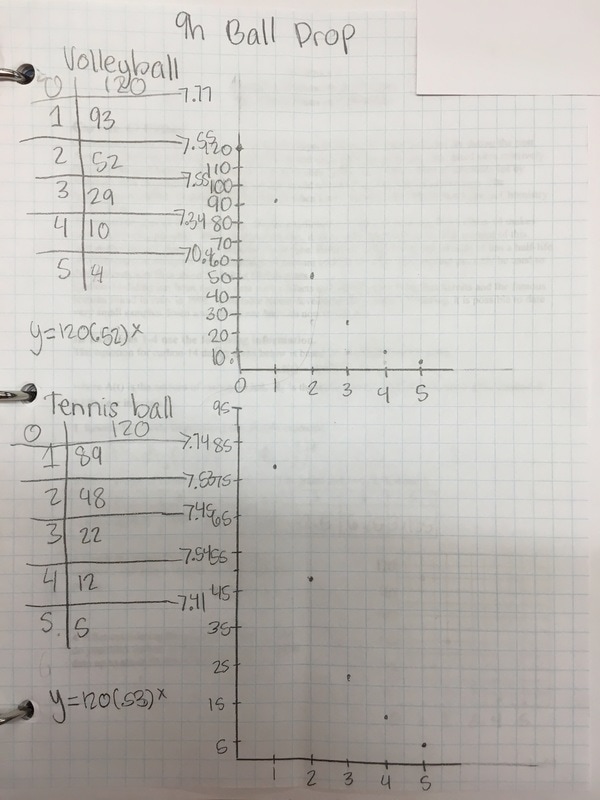
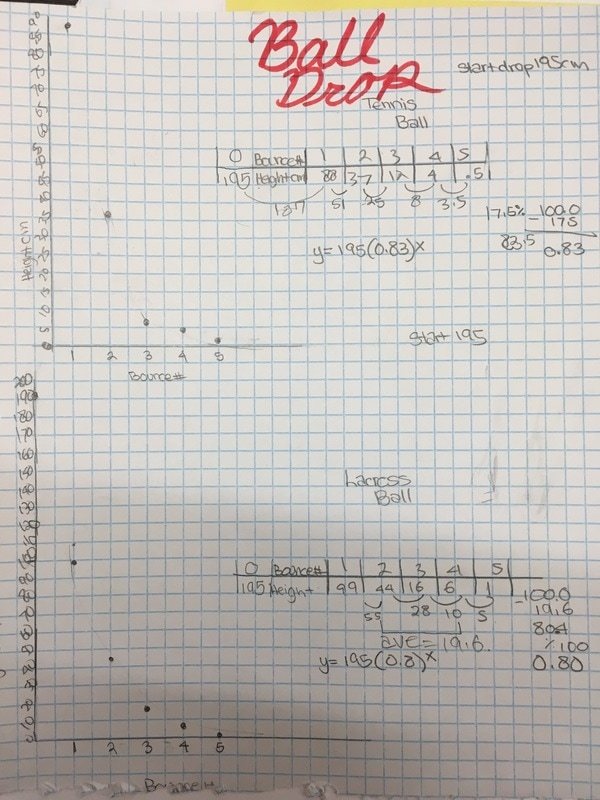
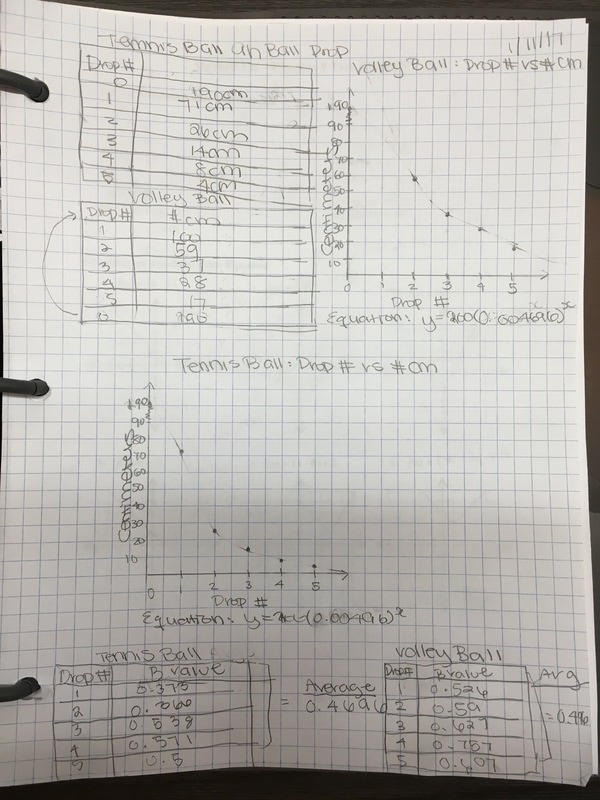
•Drop a ball from any initial height, measure in cm.
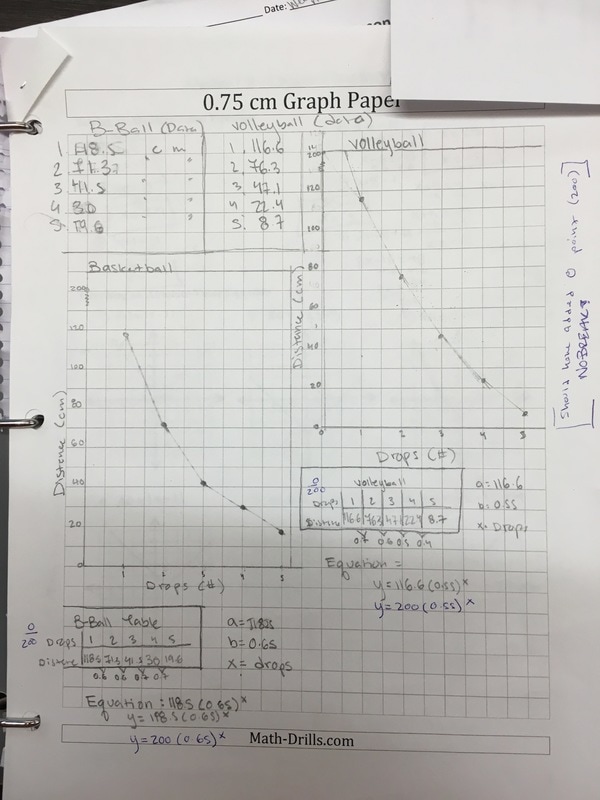
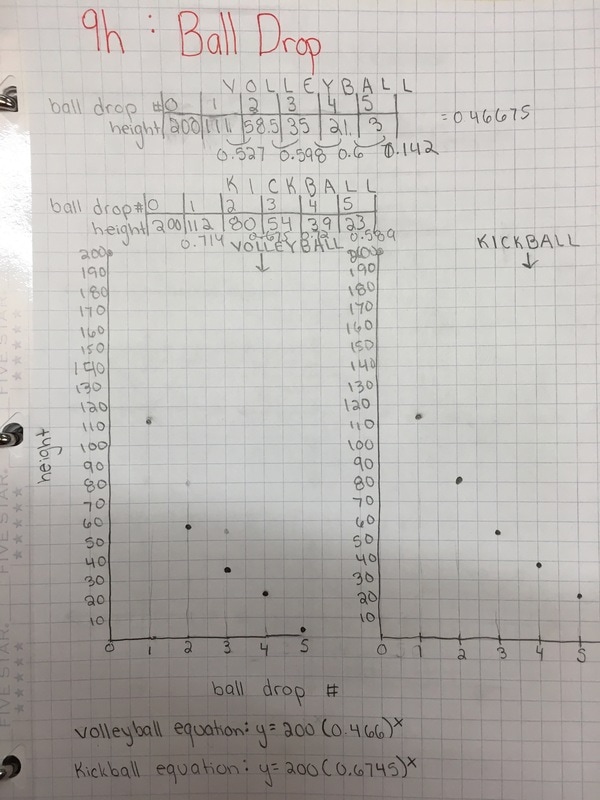
•Measure the height for 5 bounces of a ball (I suggest using a table).
•Graph the points (graph paper)
•Create an equation that models/fits your data.
•Do this for two different balls (don’t put both balls on the same graph)
Students had great conversations surrounding how to find the constant multiplier if it never ended up being the same between bounces. We also had heated arguments about whether connecting the data points with a curve made sense in the situation. (The students came to the consensus that they did not think the graph would be continuous.)

 RSS Feed


