| Pennies Growth
| Decaying Dice
| Practice Work
| ||||||
|
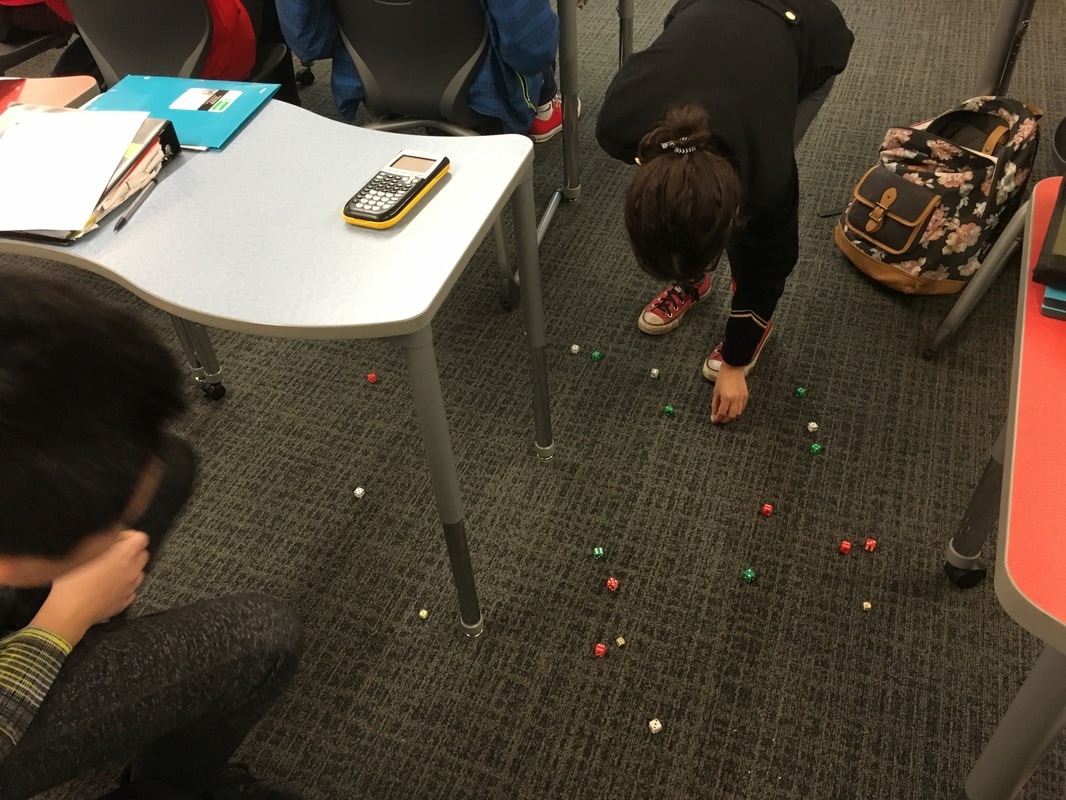
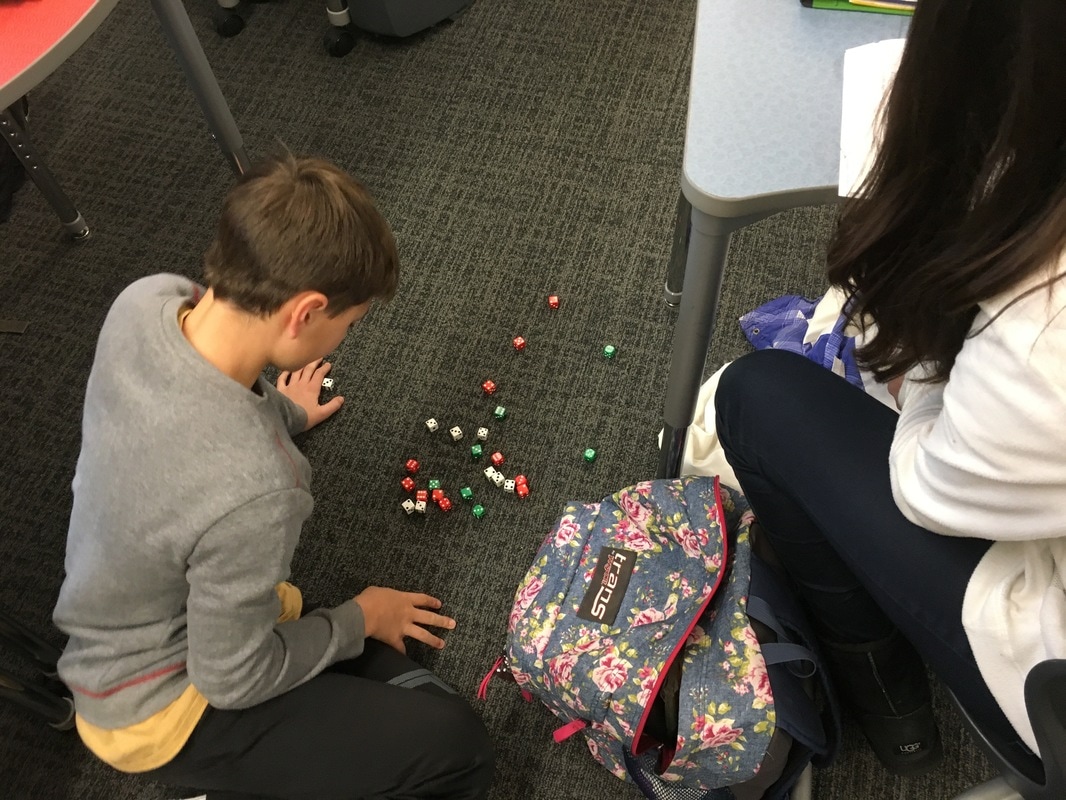
Experiments with pennies and dice exploring exponential growth and decay. 2 days. 500 dice. More pennies than you care to think about. High engagement. Excellent modeling.
0 Comments
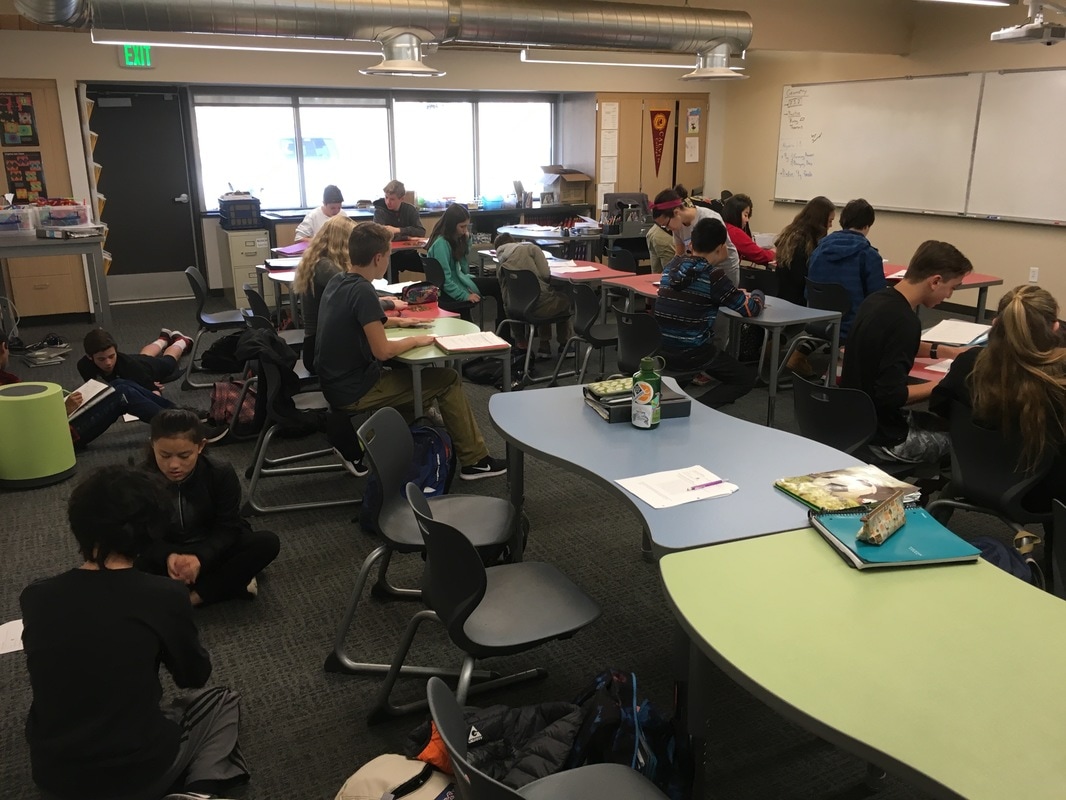
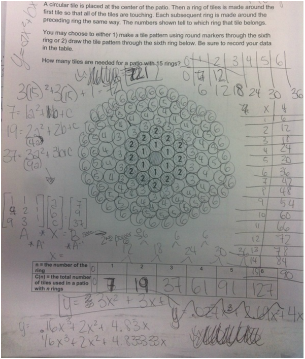
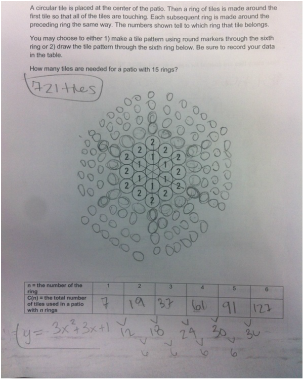
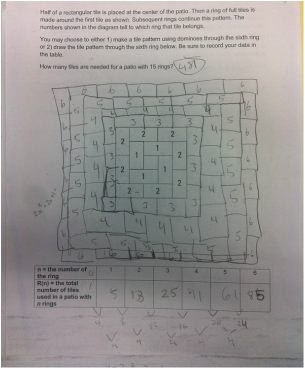
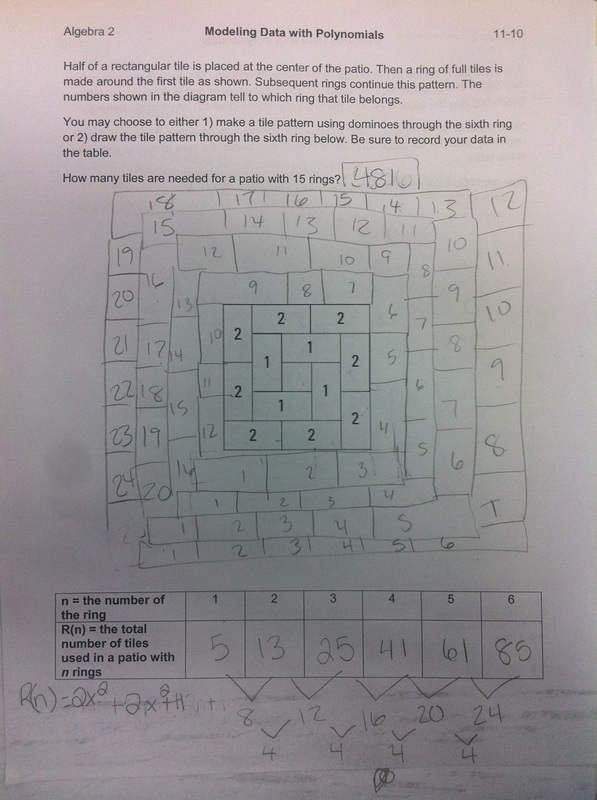
As an intro to polynomial equations in Algebra 2, I decided to skip the "real world" problems--which always seems to be terrible for this topic; either too simplified to be of any value or too complex to understand in Algebra 2--and just go modeling. Granted, it's using quadratics, but at least it's a start. The goal was for students to make a table of data and look at differences to tell the degree of the polynomial function. From there, students had to create a system of equations and solve--preferably using matrices. Here's some student work. The file is at the end of the post. I got this from modifying a UCSMP activity in an attempt to remove some supports. Trying to be less helpful and all that. The original activity told students directly how to solve the problem. I want to give less away when I ask students to model situations. What's the point in having them compare and contrast families of functions if I never have them make decisions on the tasks I assign? If you have any nice modeling tasks that go beyond 2nd degree, I'd love for you to share them with me in the comments.
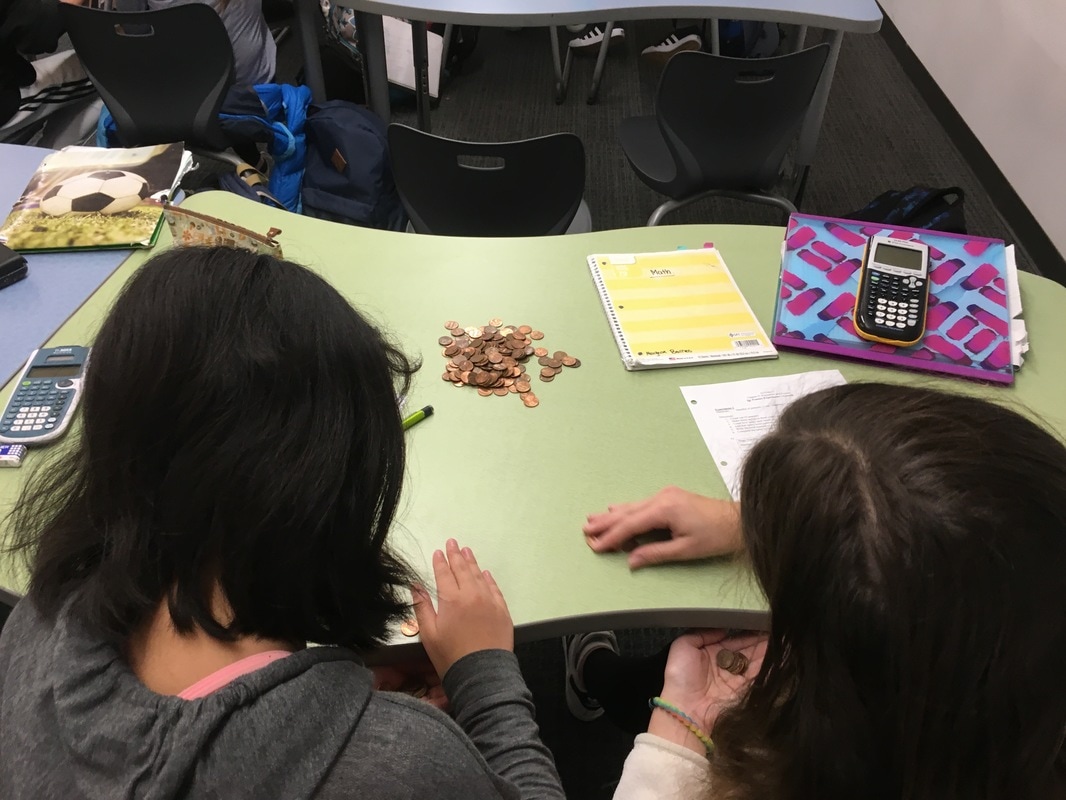
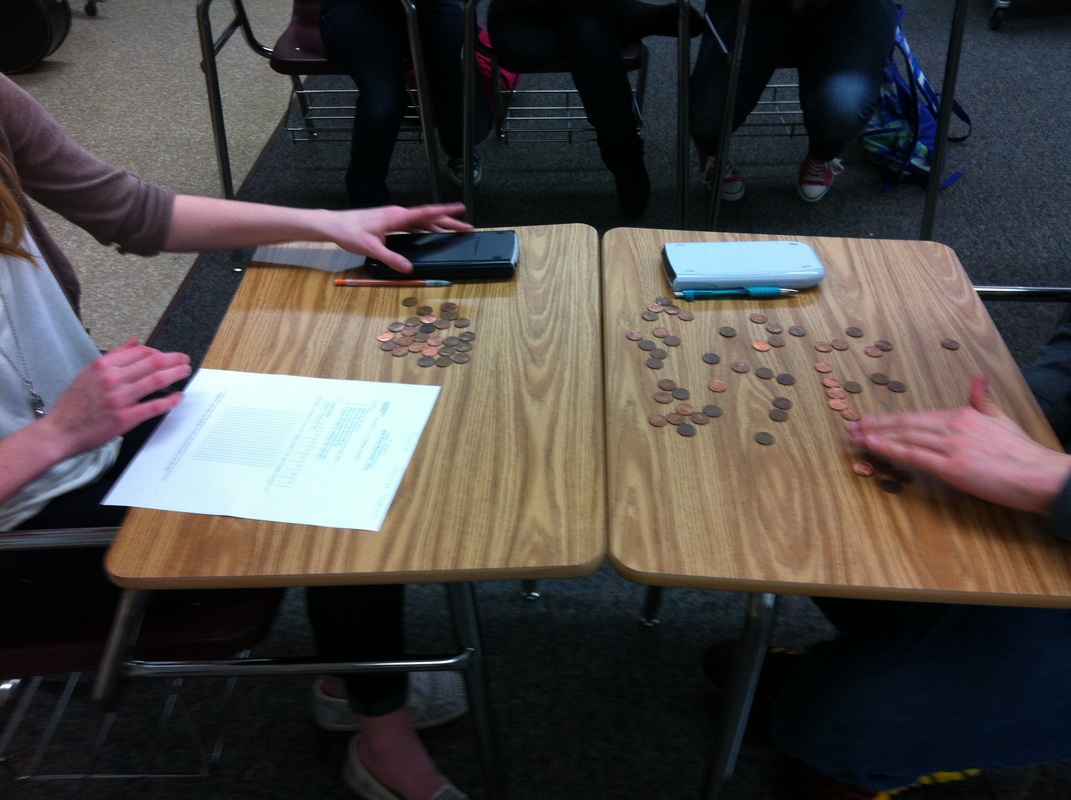
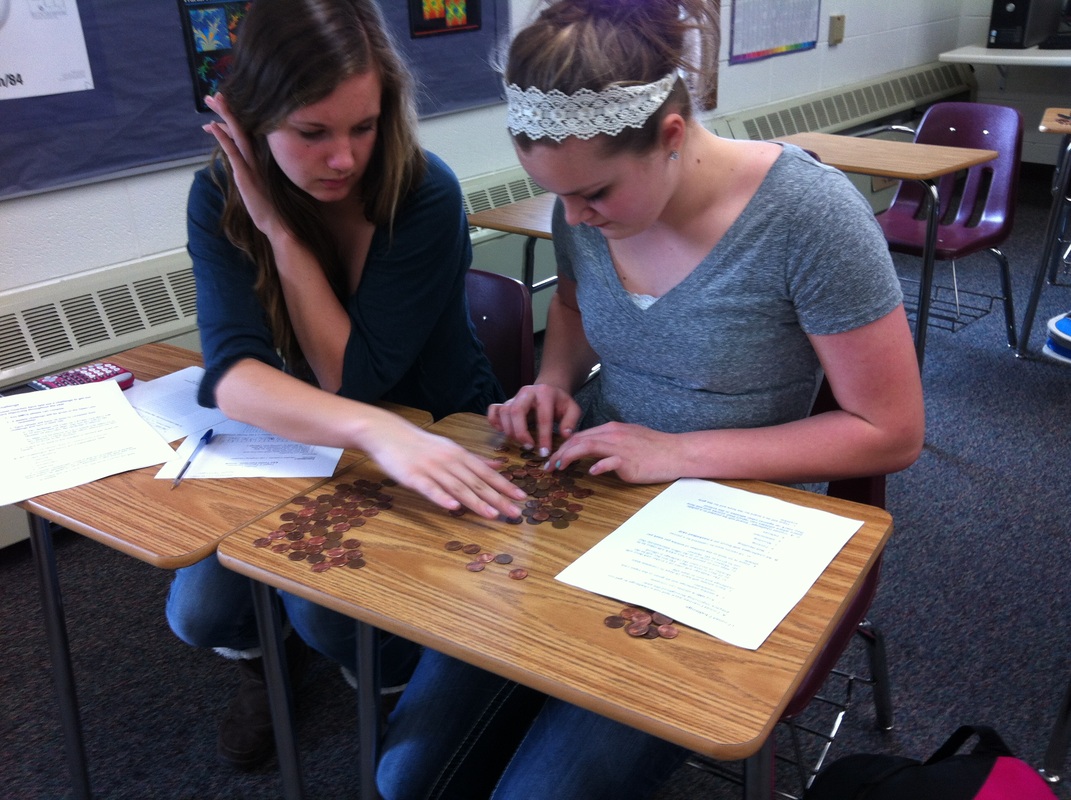
After students get somewhat used to exponential functions and nice neat numbers, I like using this activity. It helps students use what they know about a situation to come up with an ideal equation but then to fiddle with it in order to find a better fit. The process begins by pairing up and playing with pennies (my handouts are at the bottom of this post). I need to be up front with you--you need a lot of pennies. I have a large yogurt container full of pennies and I normally run out. Because I don't have an infinite supply of pennies I have groups alternate whether they start with the growth or decay portion of the activity. To model growth, each group starts with 10 pennies and then drops them on the desk. Students count the number of pennies heads up and then add that many pennies to the next drop. This process happens a total of 7 times and by the end groups have a desk full of pennies. Think of a lot of pennies, then think bigger. My highest group had something like 220 pennies by the end. To model decay, each group starts with 100 pennies and then drops them on the desk. Students count the number of pennies heads up and then takes away that many pennies for the next drop. Again, the process happens 7 times. This one is a whole lot more manageable. By the end it's not unusual for groups to have a 0 as the last value in the table. After collecting the data, students come up with an ideal equation to model the situation. We have to talk through this one. Students should not use the information in their tables to find this equation. I want them to think of the situation and tell me what the equation should look like: growth, y=10(1.5)^x and decay, y=100(.5)^x. Then I have students use their calculators to create a scatterplot of the data and graph the equation at the same time (step-by-step instructions on the handout). This is where we talk about needing to find a better equation. Some students use their tables to find and average growth factor. Some students just tweak the equation on the graphing calculator. Either way leads to a good discussion of the process of modeling and the messiness of real data. The kids have fun. I have fun. And it all happens in 42 minutes.
|
Andrew Busch
I teach Math at Ralston Valley High School in Arvada, CO. Categories
All
Archives
March 2019
|
||||||||||||||||||||
 RSS Feed


