|
This year I find myself teaching a class called Algebra 1B. It's basically the second half of Algebra 1--except that I have almost the whole year to teach it. So pretty much, almost every activity I've ever collected I get to do with these kiddos. Here's our last two weeks together. Next week: Barbie Bungee Jump
1 Comment
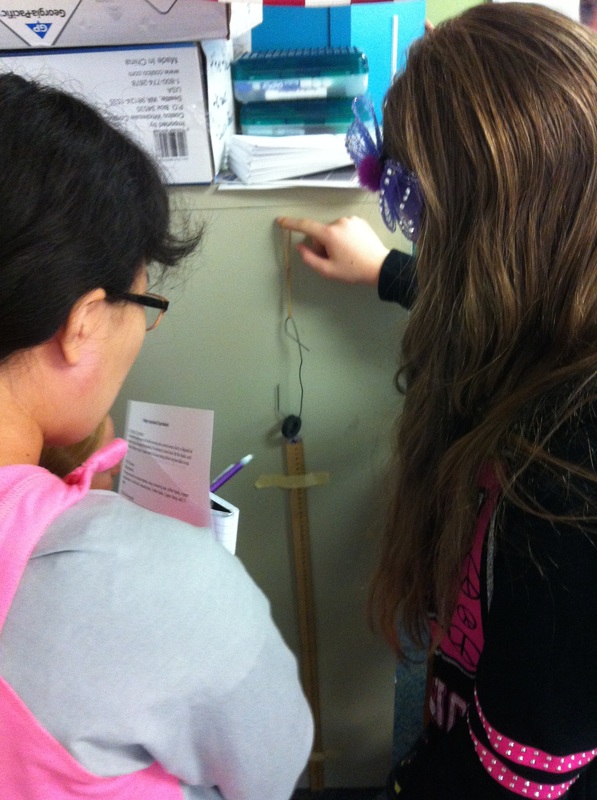
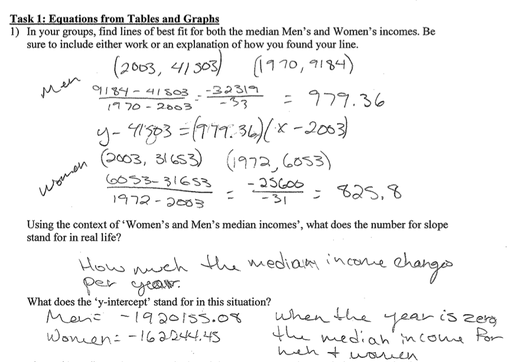
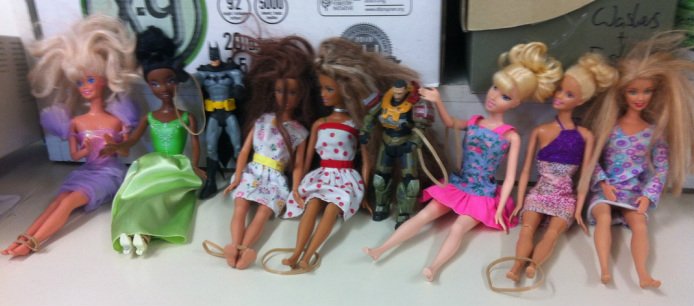
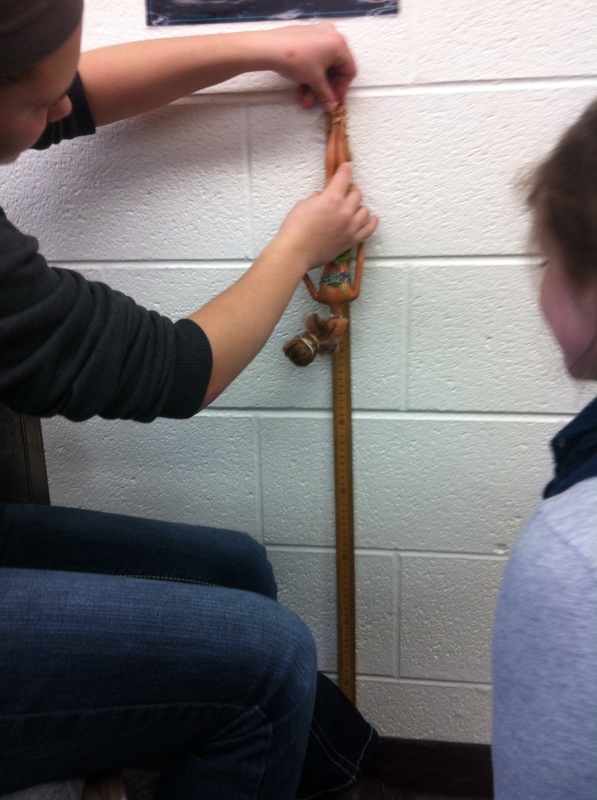
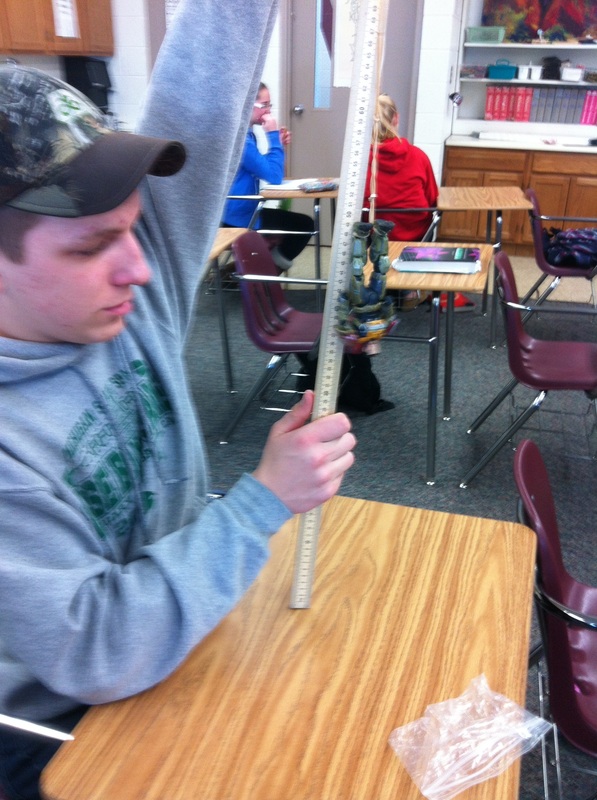
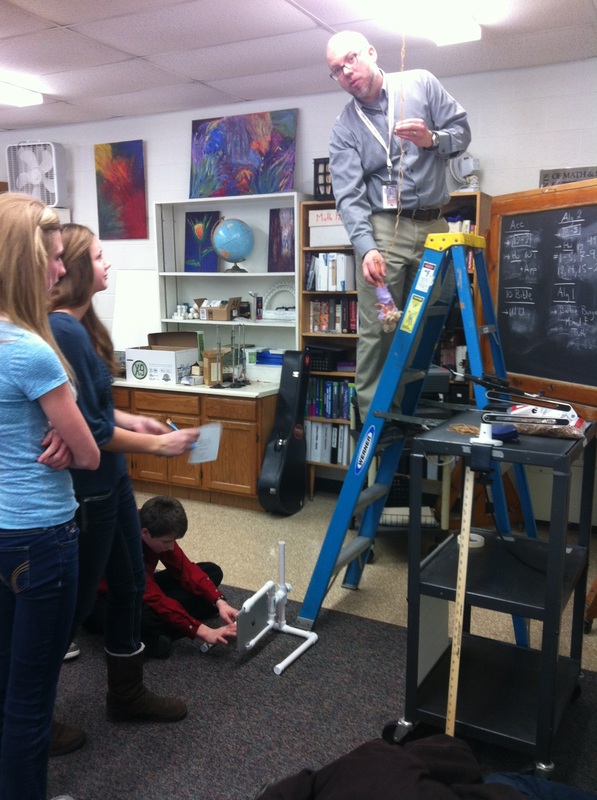
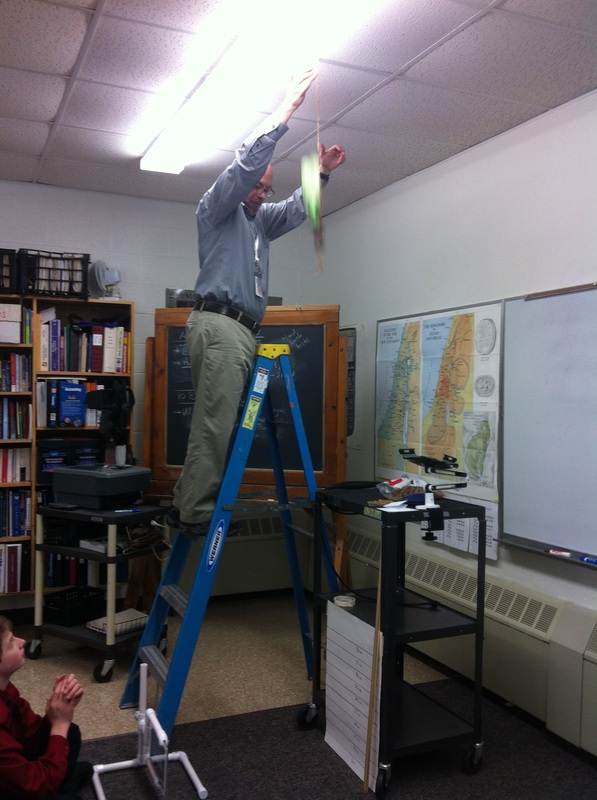
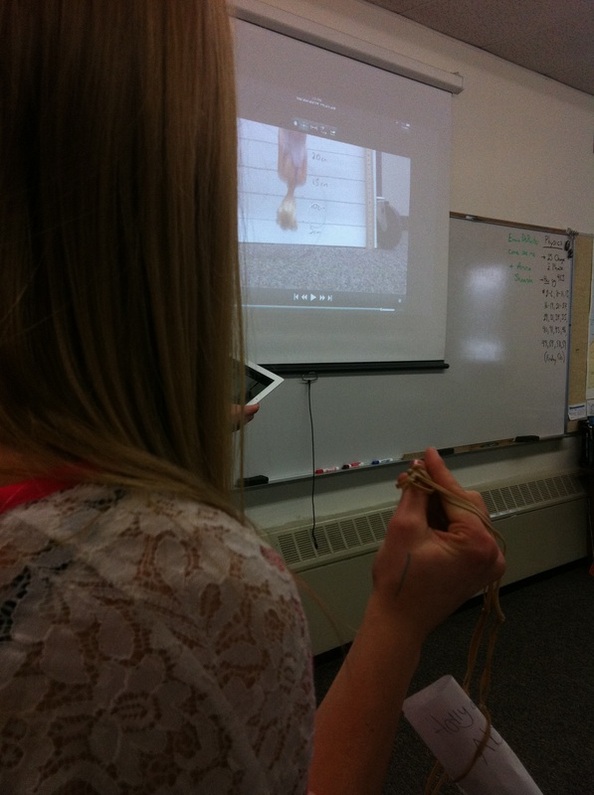
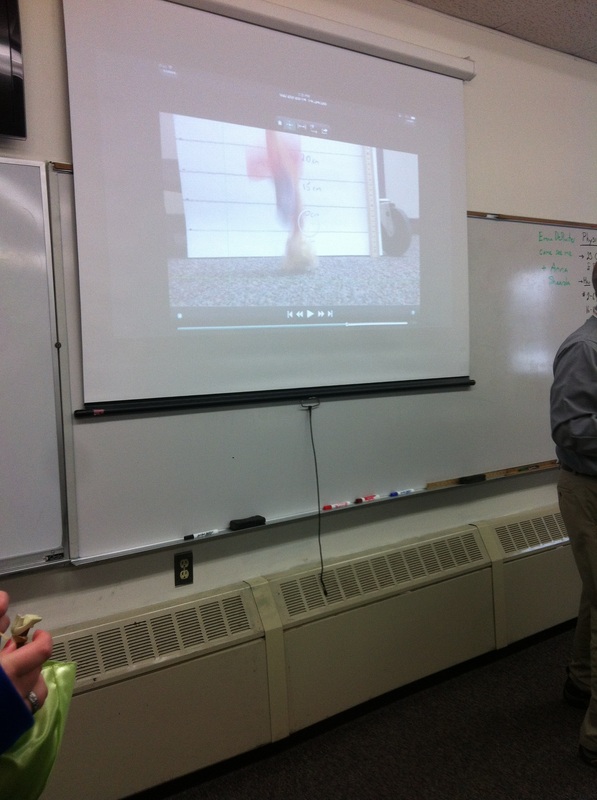
I had enough requests for pictures that I made our 1st Barbie Bungee extravaganza into a video. This last week we ended our focus on linearity in Algebra 1 (finally!). The Barbie Bungee has been around for as long as I've been a teacher (I had conversations with other teachers about it back in 2001). I've never done it before because generally because of my deficit in Barbie dolls. Well, this year I decided I wasn't going to let a little thing like having no Barbies stop me from doing a fun math lesson. I put out an all-call for Barbie dolls, preferably with their clothes (I teach in a Christian school after all). The response? Nothing. Not one doll. It took some doing but I finally convinced my Algebra kids to bring in some kind of figurine to drop. Here's what they came up with. I had a couple of guys not wanting anything to do with Barbie--hello batman and dude from Halo. Day 1: Data collection Gathering data and making inferences is slowly getting better as the year goes on. I guess it really comes as no surprise that the more they do it the better they get. When I do this again next year, I need to make sure they have more time to gather data and make connections. The 20 minutes we had in class after questions on homework, the intro, and gathering supplies wasn't quite enough. I had to break my vow of silence and give suggestions on data collection to a group. Maybe it would be a good idea if your collected more information than simply one drop with all of the rubber bands. No, really. I felt bad, but I did it anyway. I'm on a timeline people: can you say 7 snow days?. Many of the groups looked at the table and found the average rate of change and the y-intercept (both the winners and the runners up did this). One group graphed the points and used the line of best-fit (I love it when they see those connections!). One group doubled their data from 7 rubber bands and saw that it wasn't enough and then tripled it. They saw that it was too much so they found the average stretch per rubber band and then took away as many rubber bands as it took to get under the height from the floor to the hook in the ceiling (282.5 cm). Novel but unfruitful. They didn't take into consideration Barbie's initial height so they ended up being pretty high off the ground when all was said and done. Day 2: The moment of truth. I used a hook attached to the ceiling as the starting point for out plastic daredevils. Then we used the iPad and the Apple TV to video and show the happenings up on the screen. The video came in handy several times for the "instant replay" feature (see below). We had a hair's difference between first and second place. Our winning group had the photo finish above right. Their Barbie's hair just touched the ground but not her little noggin. We all agreed if you got twigs in your hair on a bungee jump and didn't die, that might just be the best bungee jump ever.
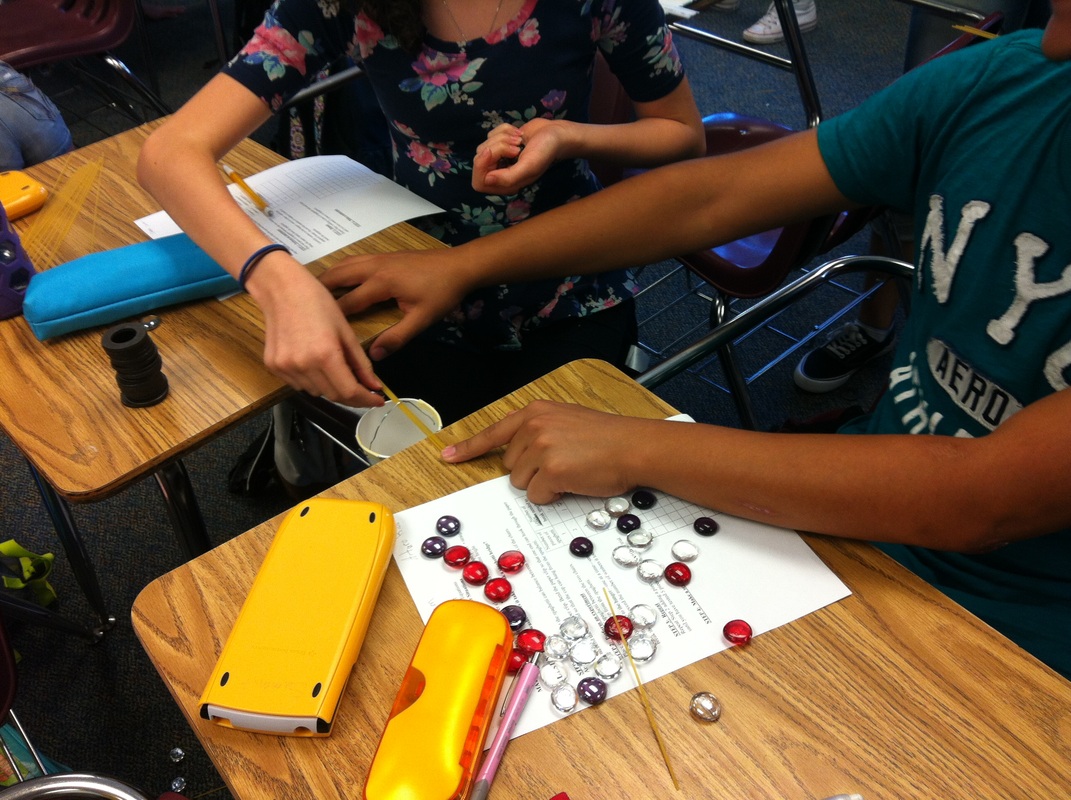
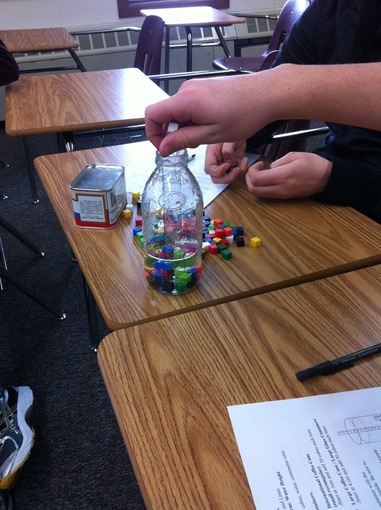
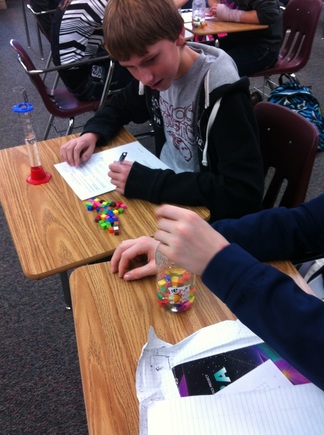
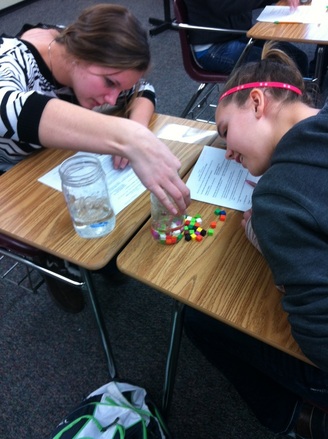
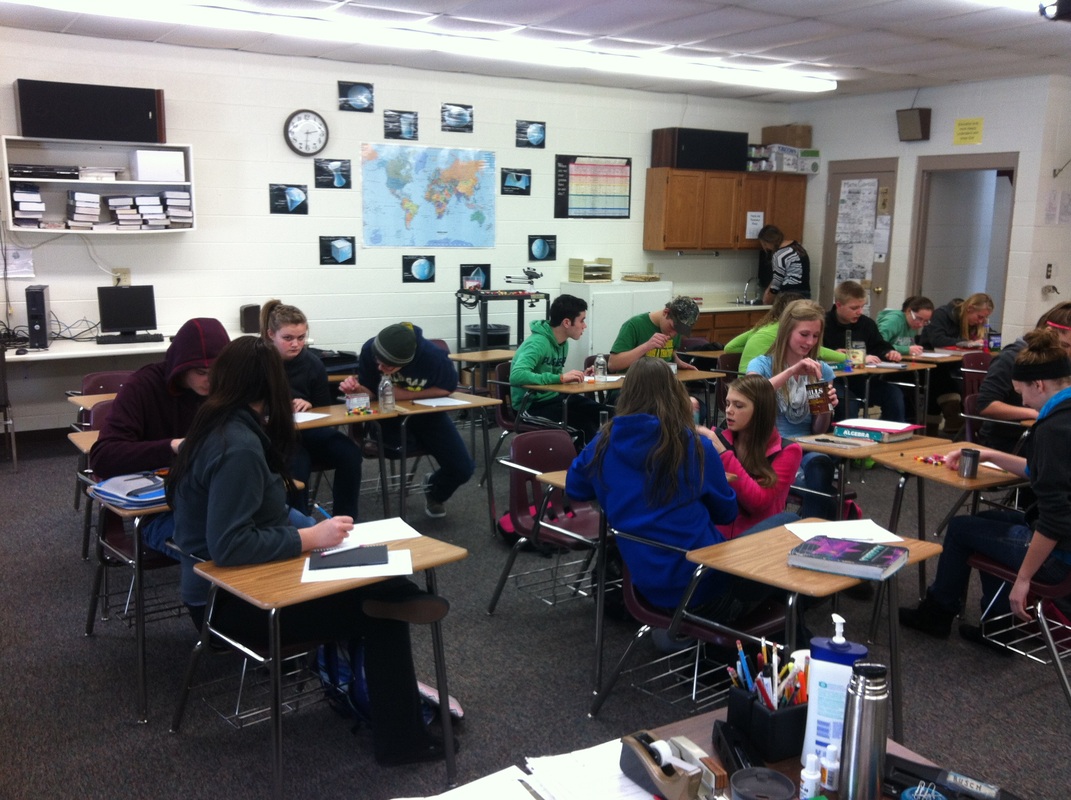
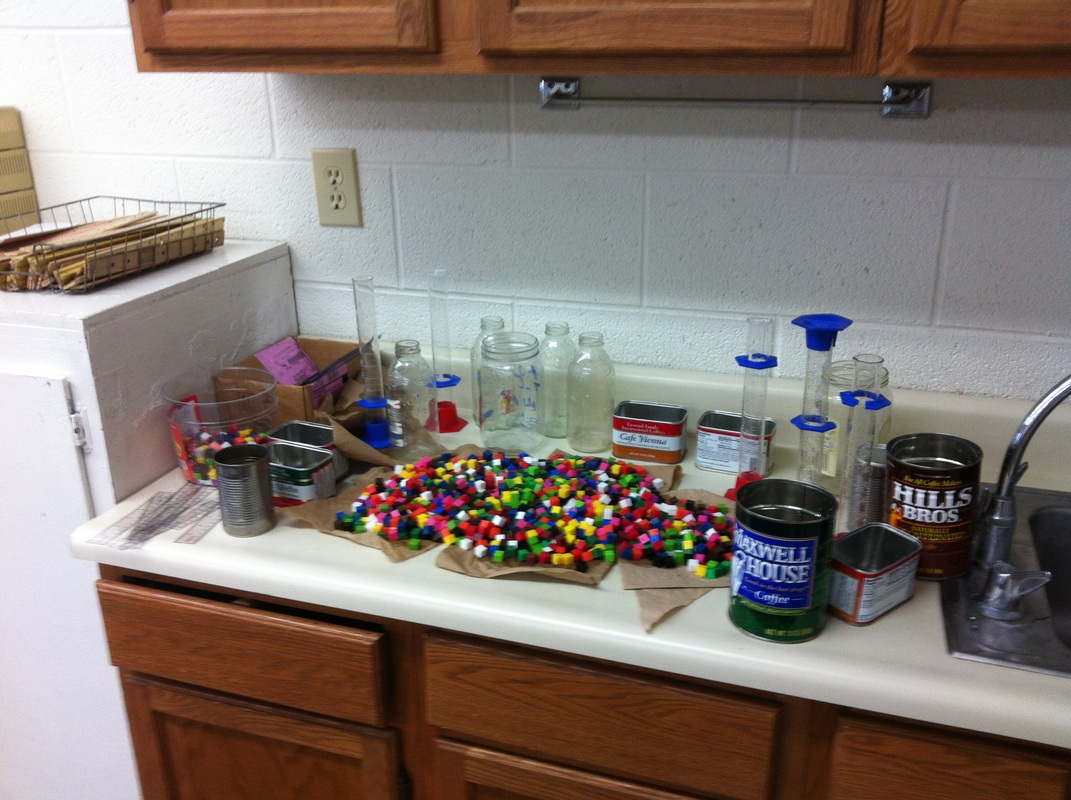
All in all, this was a great project to end our study of linearity in Algebra 1. This activity went way better than I thought it would. This summer I paged through my textbooks accompanying resources and found an activity suggesting using soup cans, centimeter cubes, water, and rulers to introduce slope-intercept form. My initial reaction was "you're kidding right?". It seemed like a good activity but giving groups of freshman open containers of water sounded like an invitation to several very wet students and multiple detentions. I filed it away, just in case, with no real intention of coming back to it. After a little over a semester of intentionally including multiple experiments every chapter, I wasn't nearly as intimidated when this file stared back at me from my chapter outline last week. I printed out the book's worksheet, gathered some resources for the next day and went home. The morning of, I decided to rework the task a bit (a have both the original and my file at the end of this post). The students did swimmingly. Every student was on task for most of the period. The class did well seeing the relationships between the initial height of the water and the y-intercept as well as between the number of cubes added and the rate of change. When I do this again next year, I'm going to gather some different containers beforehand. Glass worked better than metal containers because the water level was much easier to read. So, I think I'll use some salsa jars, big fat canning jars, and some of the baby food jars from my house (maybe even the plastic Gerber ones will work). Goodness knows I've got enough of those laying around. This is my counter after class. The science teacher was so proud of me.
|
Andrew Busch
I teach Math at Ralston Valley High School in Arvada, CO. Categories
All
Archives
March 2019
|
||||||||||||||
 RSS Feed


