When the books talk about applications of quadratics, they always give the student the equation applying to the situation. If not, they tell you all the pertinent information. How do you know the cliff diver has an initial upward velocity of 5 meters per second? It's much more likely you simply have a video of the diver going of a cliff and start to wonder about it. But that means being able to create functions from data points.
Last year was my first year pushing my Algebra 2 kids towards modeling from data in every family of functions. This year, I don't teach Algebra 2. But I liked it. I liked the messiness. I like the engagement. That means my Algebra 1 kids are going to have to step up to the plate.
I tried my hand at an introductory lesson in quadratic transformations. It doesn't 'suck' but I'm not all that impressed with myself either.
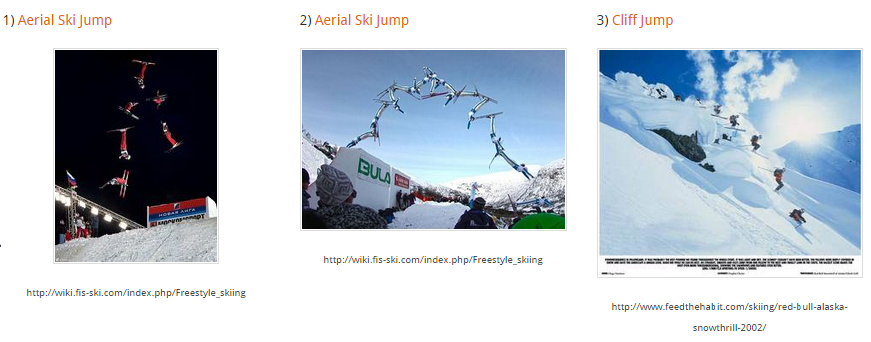
I start by asking students to click on different pictures of skiers and snowboarders. The pictures link to a Desmos file with the picture and some sliders.
| 1) Click on either the heading or the picture to go to the attached Desmos file. 2) Using the sliders, find 'a', 'h', and 'k' values to fit a quadratic equation onto the skier/snowboarder's path while they are in the air. (y=a(x-h)^2+k) 3) Do this for your top 5 of pictures. Q1: What does the a-value do in the equation? Q2: What does the h-value do in the equation? Q3: What does the k-value do in the equation? Q4: How would you find 'h' and 'k' without sliders? What relationship do they have with the graph? |
I split the task up into 3 sections:
Section 1
1) Choose 2 of the pictures of skiers in Section 1.
2) Click on either the heading or the picture to go to the attached Desmos file.
3) Using the sliders, find 'a', 'h', and 'k' values to fit a quadratic equation onto the skier/snowboarder's path while they are in the air.
4) Describe how you got your function to match the path of the athlete.
5) What relationships can you find between the graph and your 'a', 'h', and 'k' values?
Section 2
1) Choose 2 pictures of skiers/snowboarders from section 2.
2) Click on either the heading or the picture to go to the attached Desmos file.
3) Describe what happens to the graph as the a-value gets larger? What about when 'a' is negative?
4) How does the graph change when you change the h-value? Be specific.
5) How does the graph change when you change the k-value? Be specific.
6) Given a graph, how would you find the values for 'h' and 'k' without sliders?
Section 3
1) Now, only choose 1 of pictures of snowboarders from section 3.
2) Click on either the heading or the picture to go to the attached Desmos file.
3) This time there will be one difference between these pictures and the previous section--I will have the vertex point plotted on the graph.
4) Revisit your explanation to #6 in section 2:
"Given a graph, how would you find the values for 'h' and 'k' without sliders?"
How would you change your explanation (if at all)?
5) After you find the 'h' and 'k' values for a graph, how can you find the 'a'-value?

 RSS Feed


