|
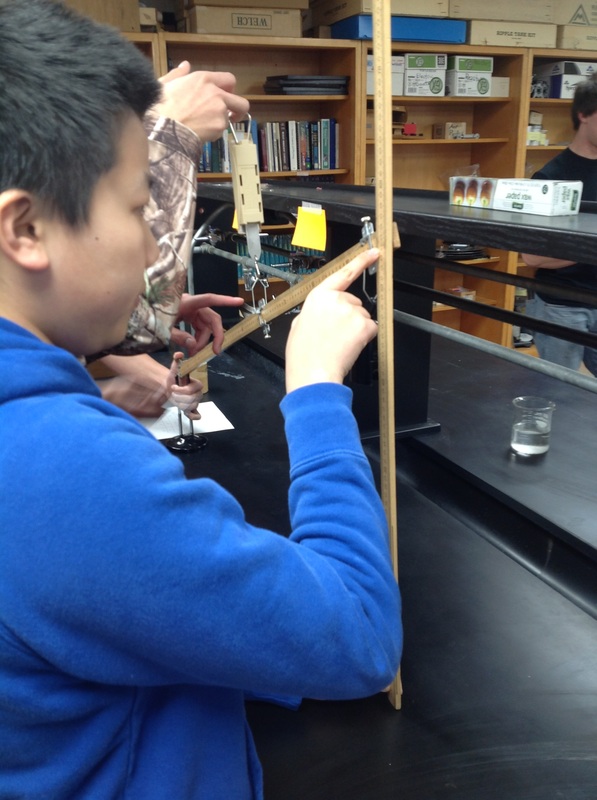
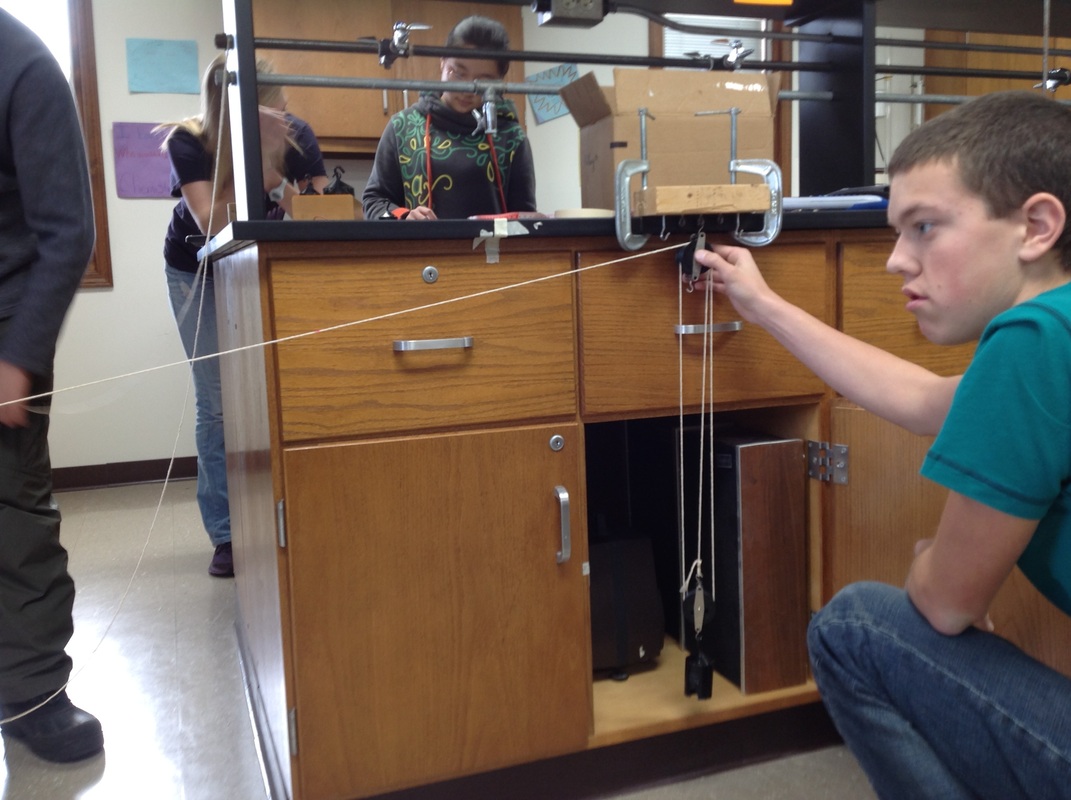
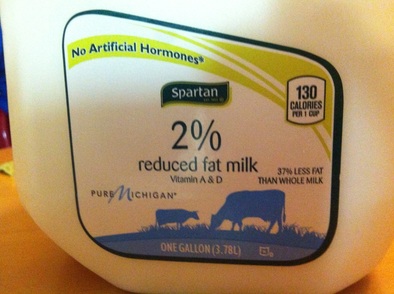
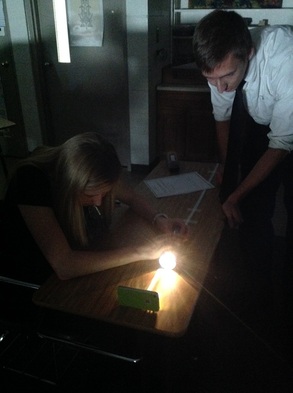
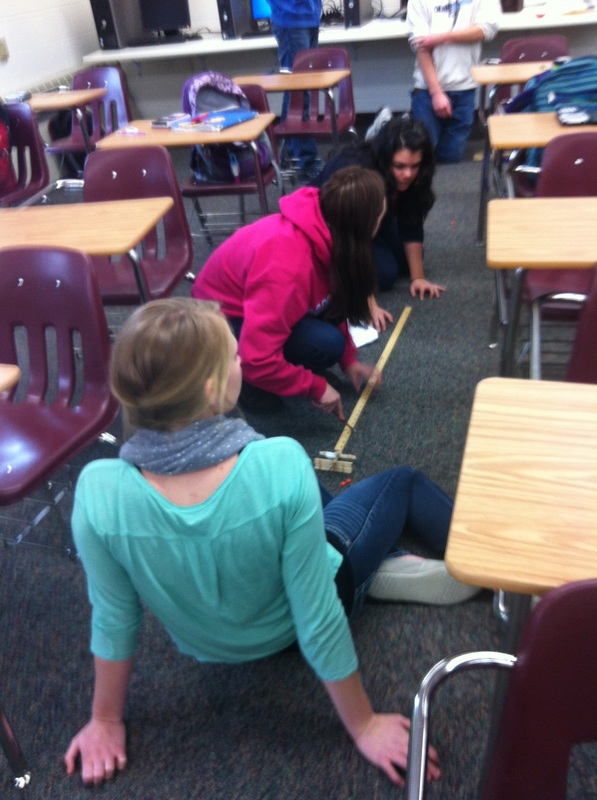
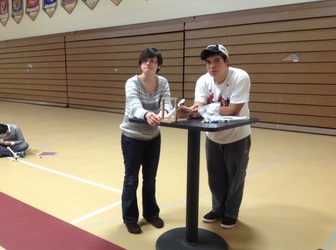
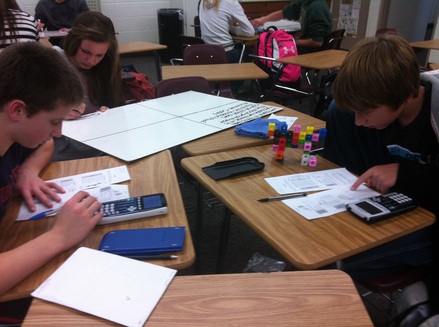
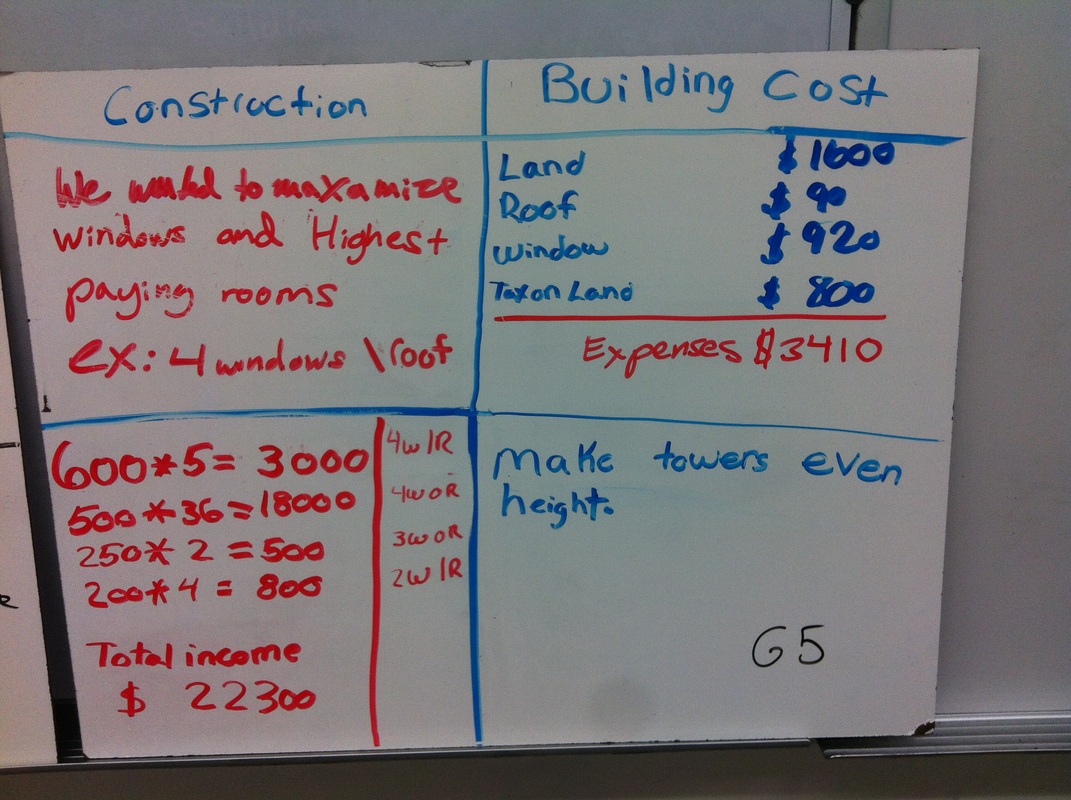
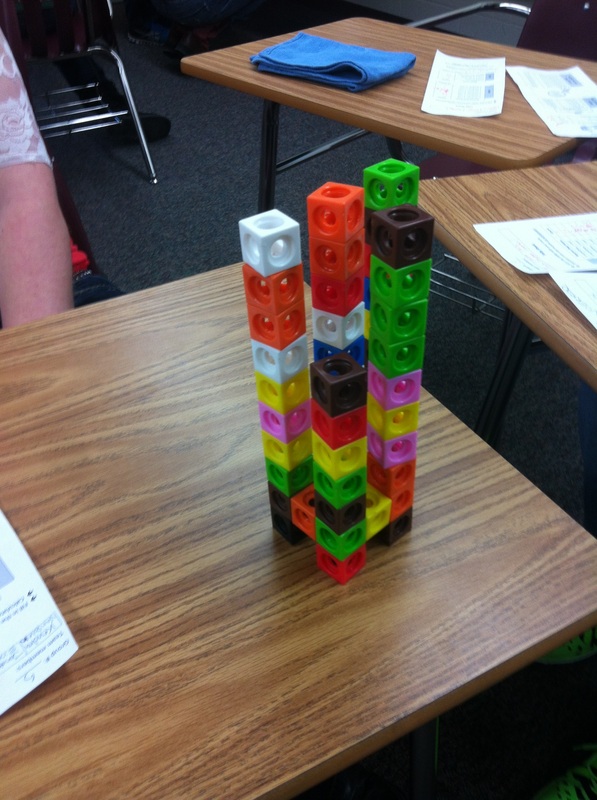
A quick peek at December in math and physics. Mechanical advantage and efficiency - Physics Everyday percent problems from my breakfast table - Algebra 1 Inverse square variation relationships - Physics M&M Catapults - Algebra 2 Building Hotels - Algebra 1 We also did some stuff with social justice and quadratic transformations. Since I've already written up posts on them, I'll just link to them if you're interested. I'm missing a couple of the projects for the month because I don't always think to have a camera handy until after all the action is finished. Think of this as the sampler plate at Ruby Tuesdays.
1 Comment
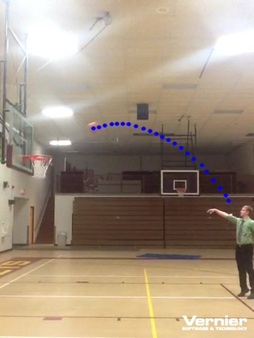
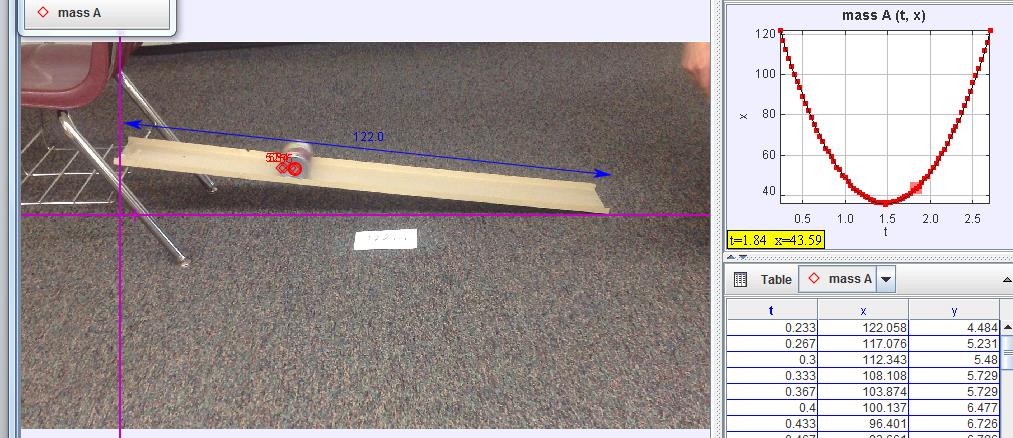
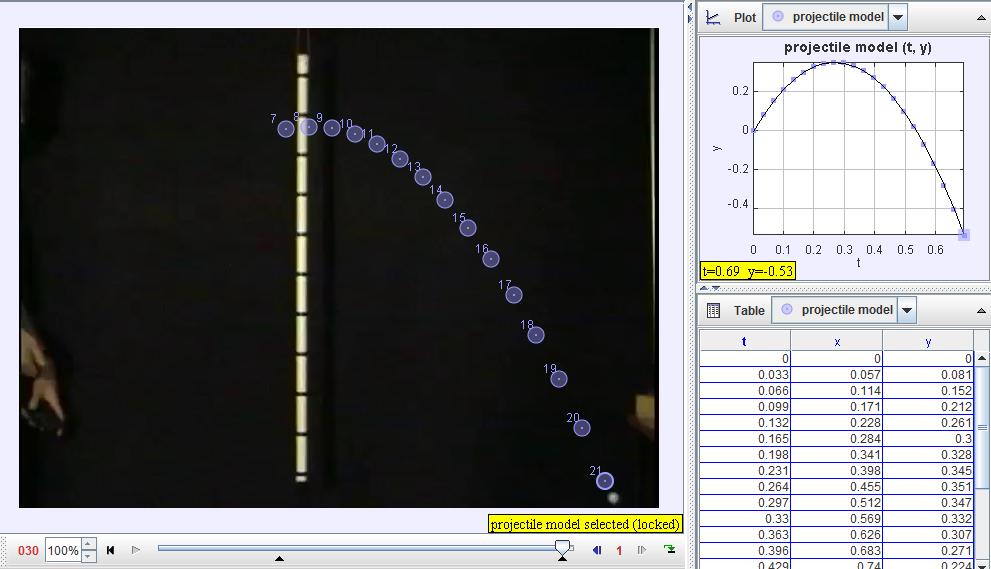
I love using real data in my classes but it's usually easier said than done. I don't have any fancy pants TI-NSpire calculators with little WiFi receivers that transmit data instantaneously to all my students (if anyone wants to buy me a classroom set I would send you a thank you card and a drawing from each of my toddlers). I've tried with regular graphing calculators but it takes almost an entire class period to get the data to everyone. This means I generally don't use student created data as much as I'd like. This year I'm doing something different. I bit the bullet and signed up for the computer cart for a couple days. On day 1, we introduced transformations using Desmos. After playing around with it for 5 mintues we explored different parent functions and their generalized forms: y=x and y=a(x-h)+k, y=x^2 and y=a(x-h)^2+k, and y=2^x and y=2^(x-h)+k. On day 2 we looked at data using Geogebra files I created beforehand (see below). Each of the files is based off the video of a basic event. At this point you need to know I am a complete Geogebra newbie. I had to look up how to get the spreadsheet numbers to show up as points. If I can do it, you can do it. Based on the student questions over these last several days, this is probably the best students have understood the concept of function translations and transformations after the initial introduction.
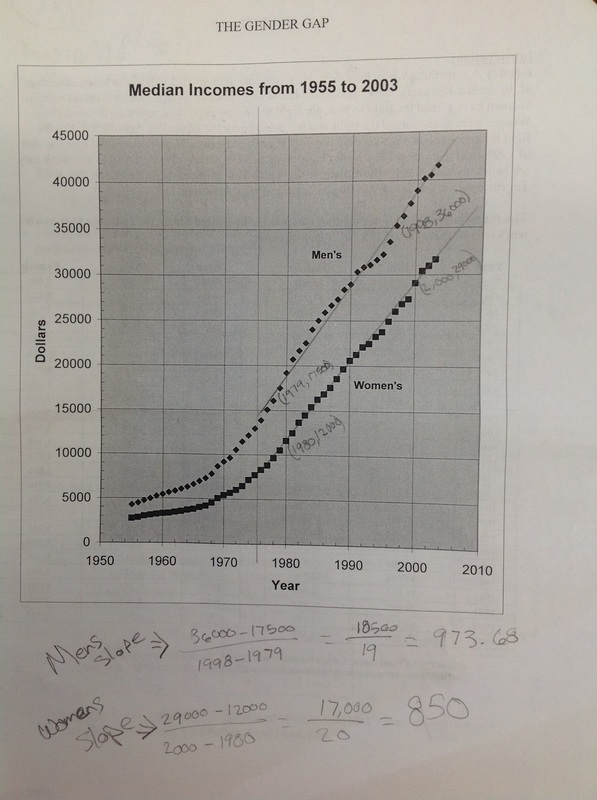
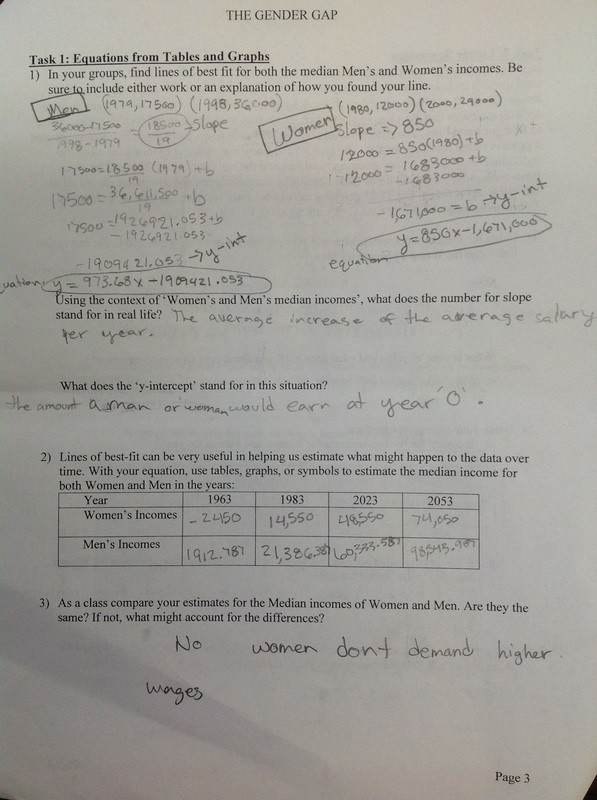
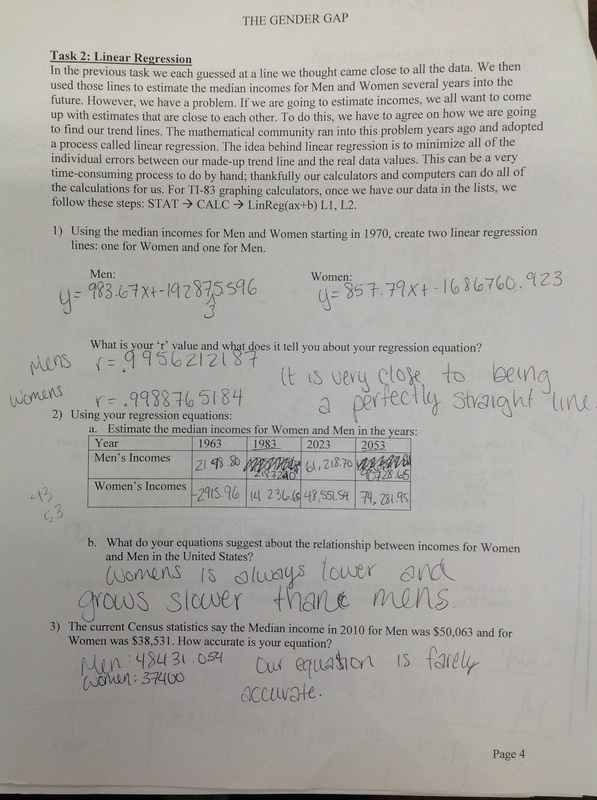
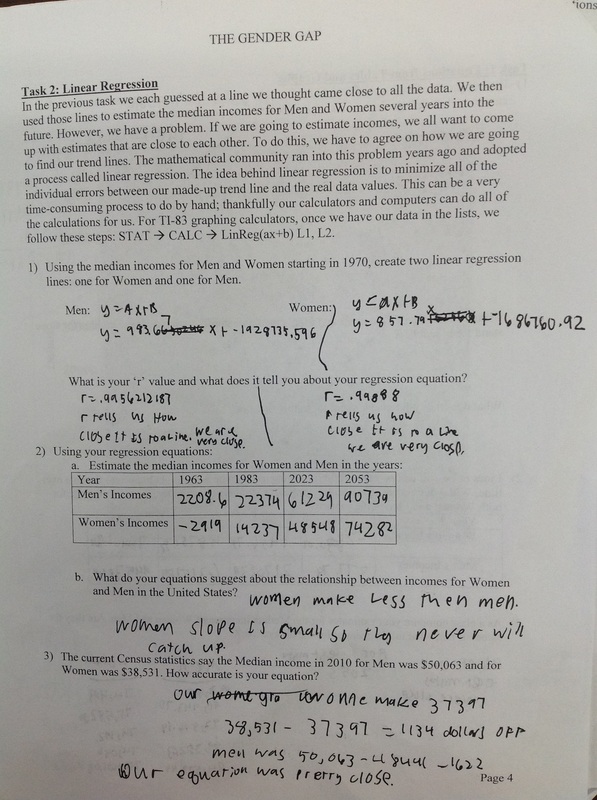
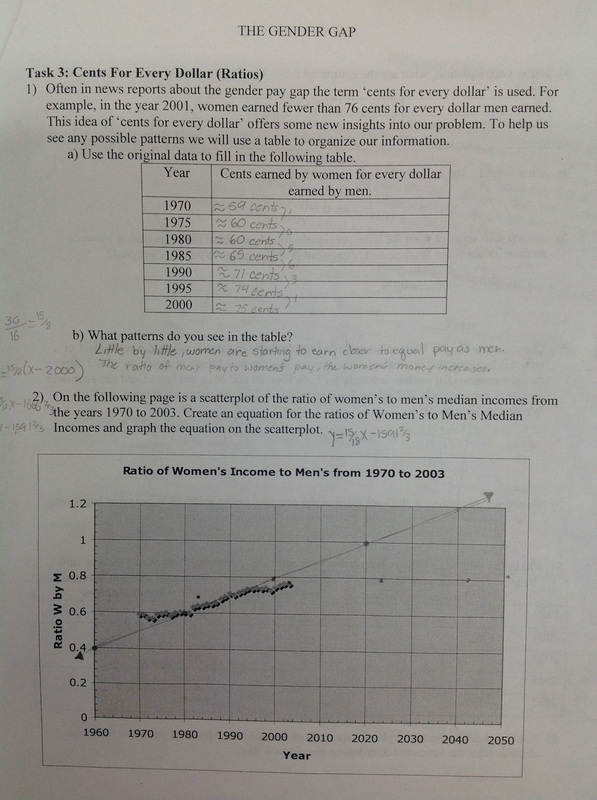
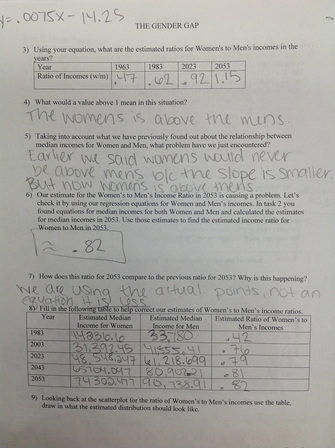
 I wrote this lesson several years ago for the Kuyers Institute. The question we were trying answer was whether teaching a math lesson could be about more than just the math? Can we talk about social inequality using numbers? What role does math play in convincing people of the rightness or wrongness of an opinion in our society? One of the few times I've been successful with such a lesson is in studying pay inequality between men and women in the U.S.A. I've done this lesson in both Algebra 1 and Algebra 2. I think the older students are better able to delve into the underlying factors (not surprising). 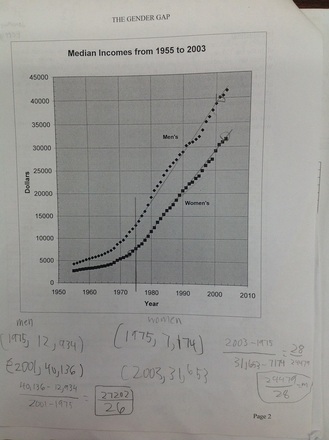 We start by looking at the data from the census bureau: 1955 to 2003. Before beginning group work, we have a discussion about why we use data for median incomes of full-time year round workers. (Women are more likely than men to work part-time in the US and that would skew the data, hence 'full-time year round'. Also, men are more likely to be top earners in the US (think Bill Gates and the like), which would also skew the data, hence 'median'. Then we look for trends in the tables. Almost always students say that men earn more than women and that as the years increase people make more. Then we see if the graphs can help us be more specific (page 2 of the doc). What do you see? Can you use math to describe that? Students suggest exponential curves. We try them and they don't work. Then we talk about cutting off parts of the data. If you cut the data at 1975-ish, it becomes approximately linear. After laying the foundation for the lesson, it's group time. In groups of 3 or 4, students start to work through the questions in the lesson The lesson is divided up into 3 tasks to make for natural discussion breaks as a class for formalization of content. Here's a quick overview: In Task 1 students find equations for both men and women incomes using lines of best fit and two points. Students must also explain what each aspect of the function stands for and whether it is appropriate to predict backwards using the functions. Task 2 tackles linear regression, correlation coefficients and whether our equations have any merit when comparing with current data (I have 2010 incomes in the lesson). Task 3 takes a brief foray into rational functions (cents on the dollar). I couldn't help bring up a conceptual problem by asking students to create a line of best fit for this function as well (it looks linear). However, this yields drastically different results than the findings from the previous tasks. Lovely discussion about why this doesn't work. All in all, it's an interesting lesson that leads to great conversations about the structure of our society, concepts like 'justice' and how we use math to 'prove' our points.
|
Andrew Busch
I teach Math at Ralston Valley High School in Arvada, CO. Categories
All
Archives
March 2019
|
||||||||||||||||||||||||||||||||||||||||||||||||||||||||
 RSS Feed


