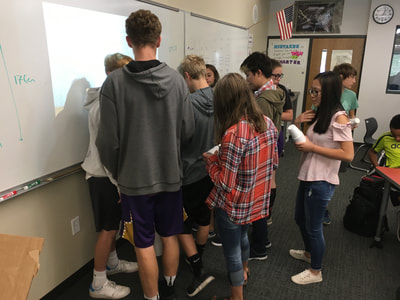
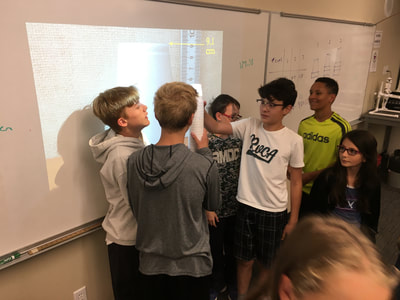
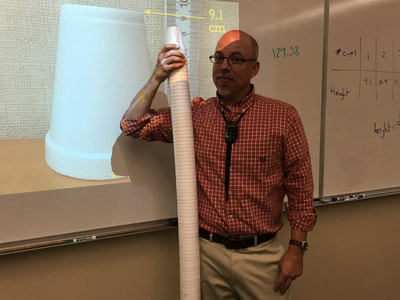
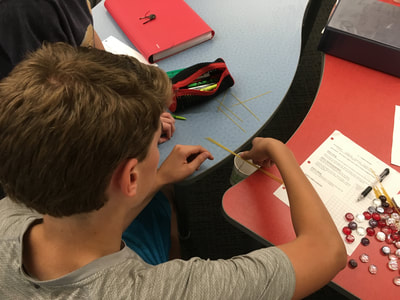
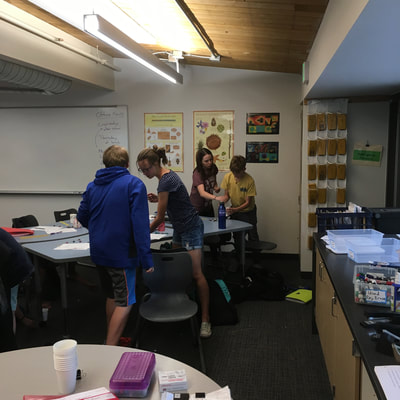
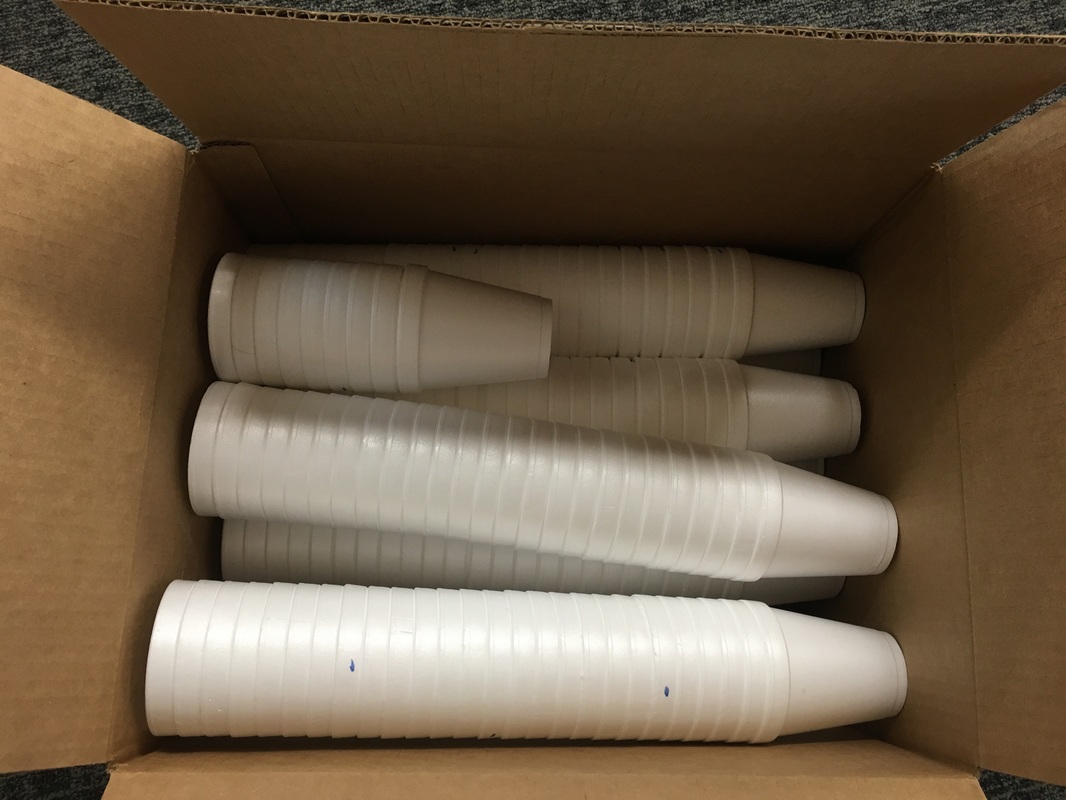
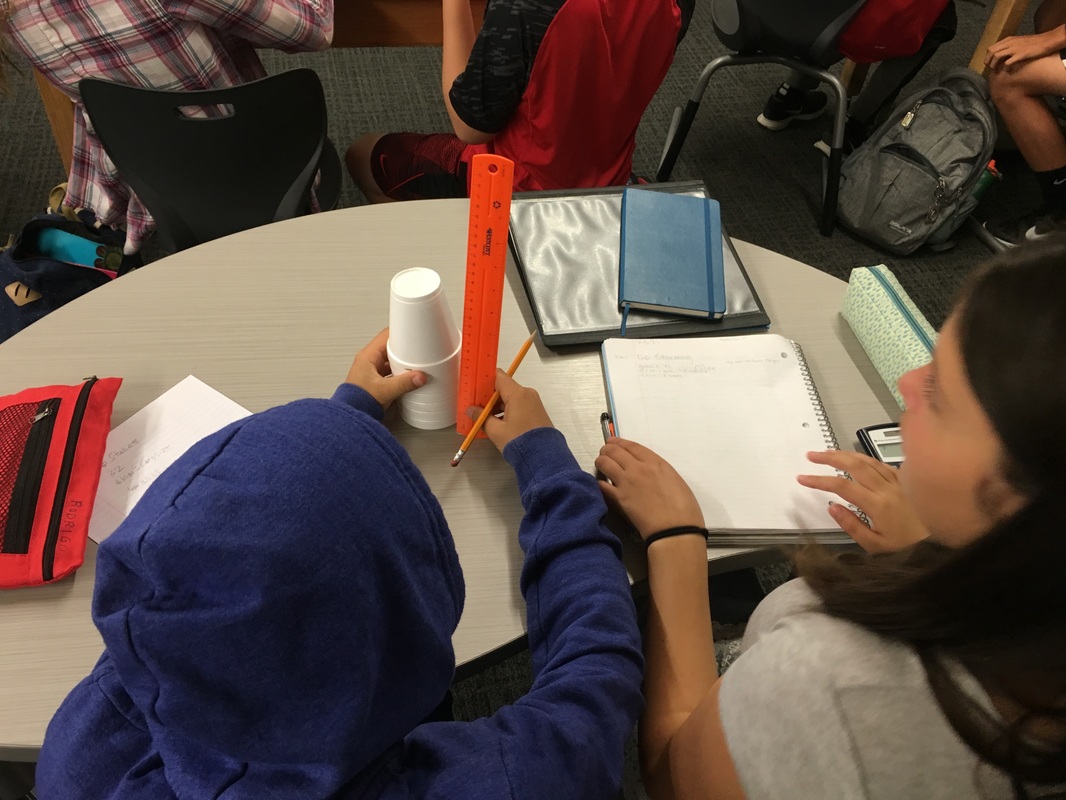
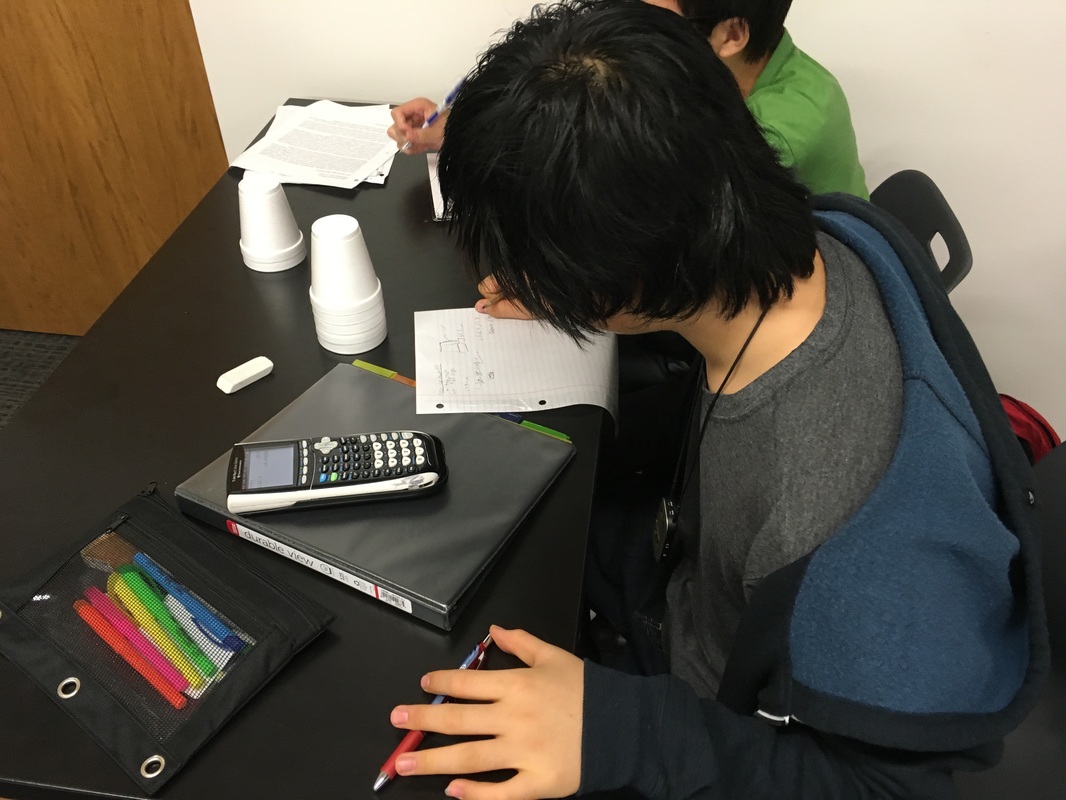
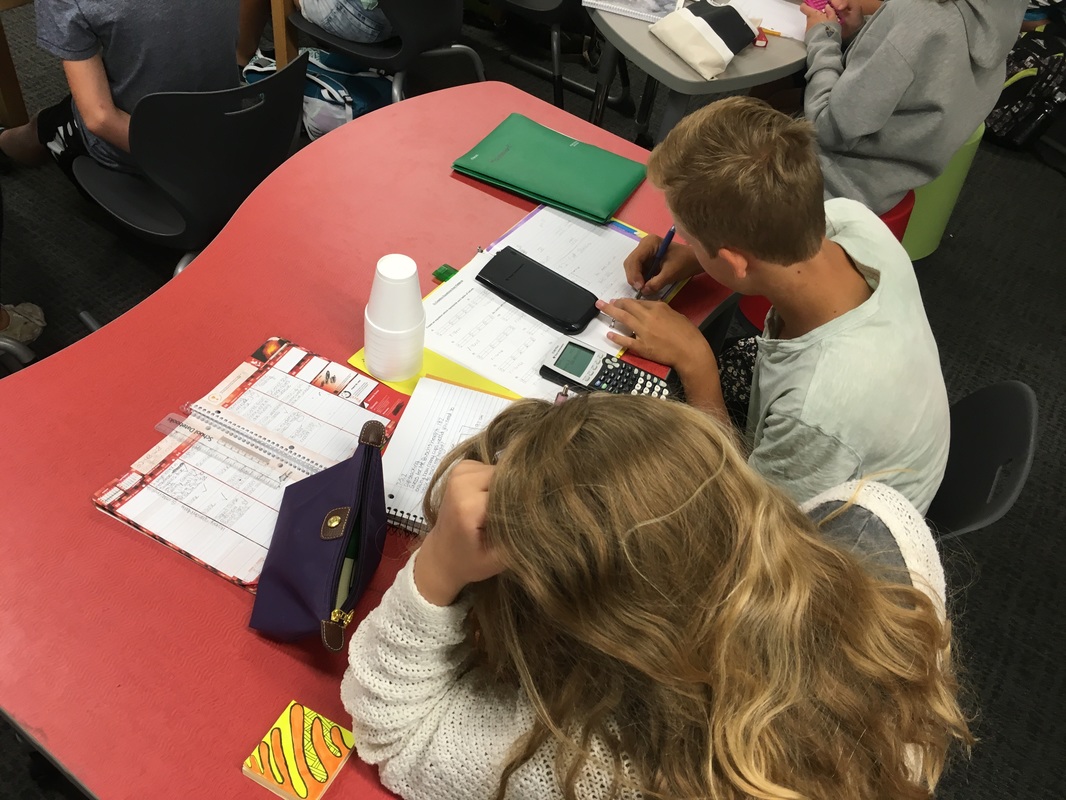
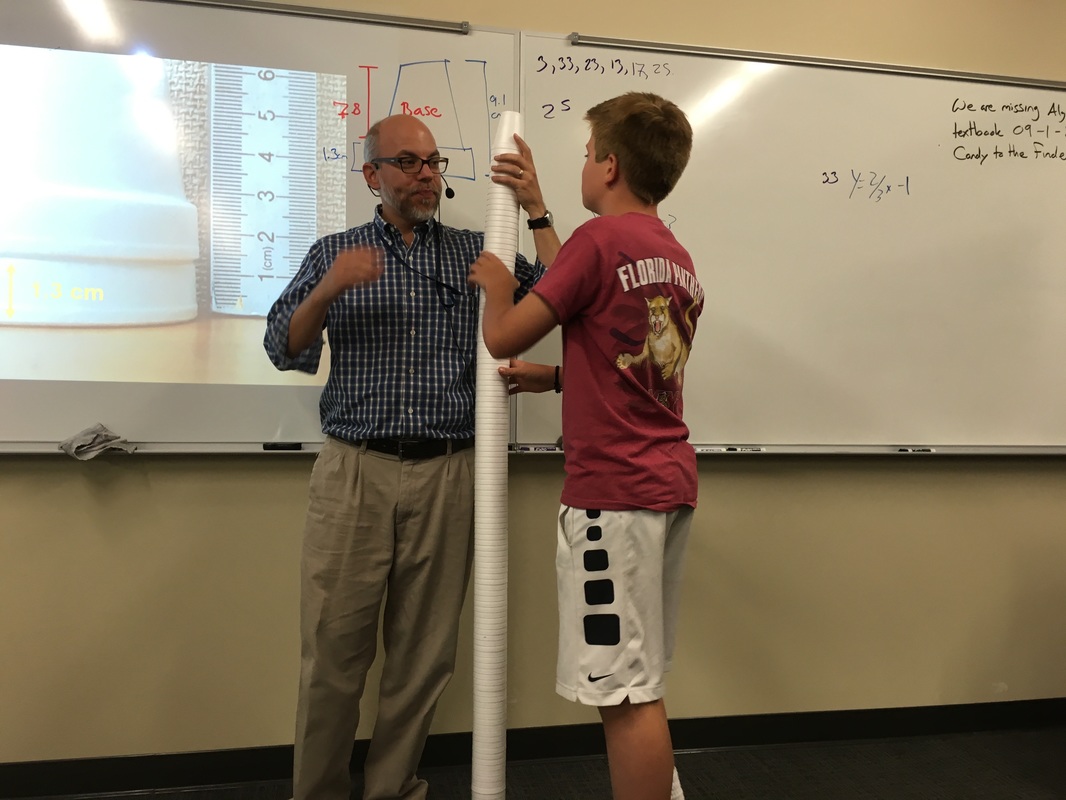
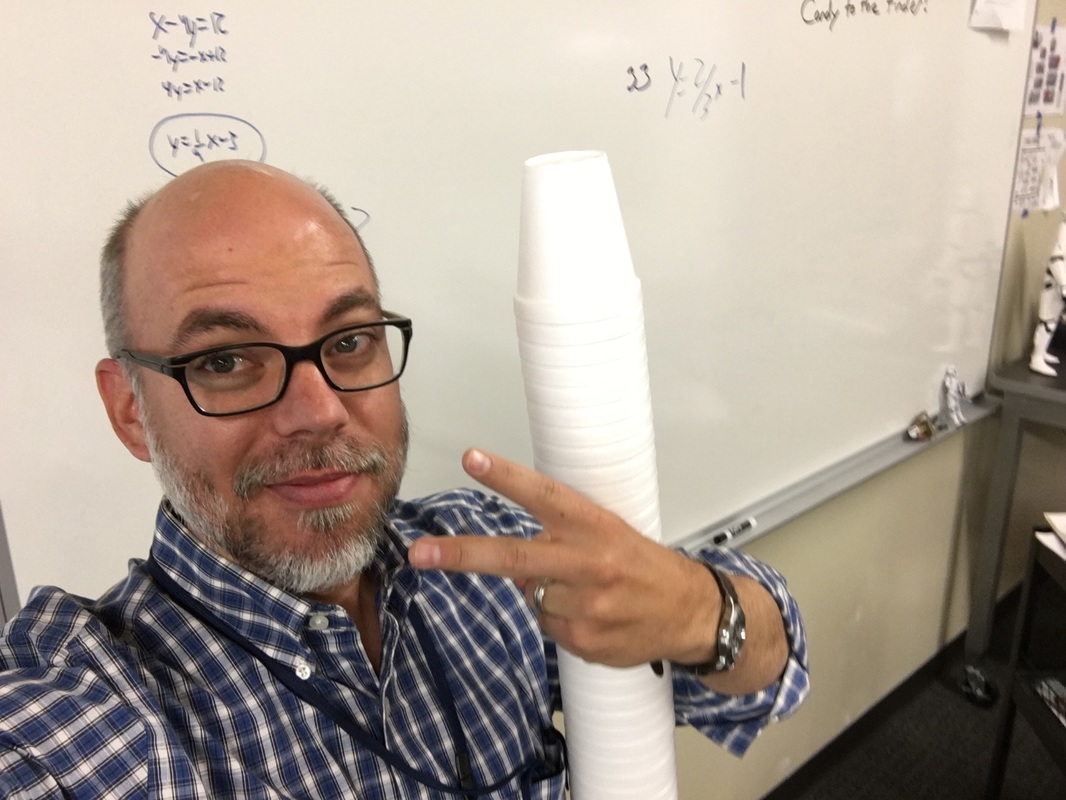
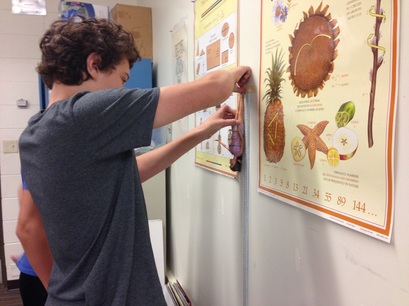
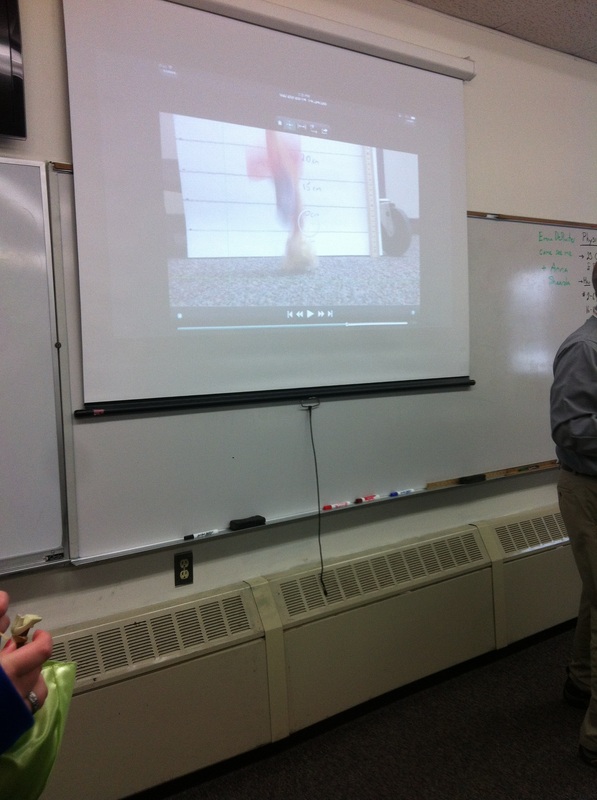
We begin by giving 5 styrofoam cups to every pair of students. Then I show a picture of me getting my height measured at my doctor's office (in cm). They have to figure out how many cups tall I am. We also almost always need to come to an agreement about how to measure the cups. Quick setup and clean up and almost complete engagement. You can't ask for much more than that.
|
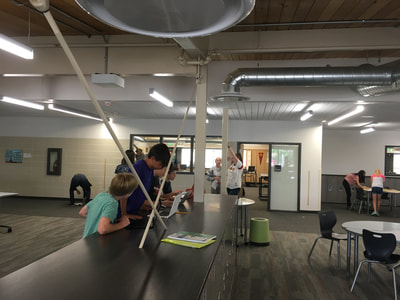
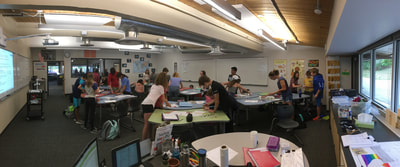
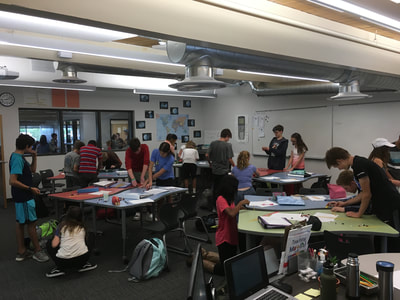
I didn't do a very good job posting about activities as I did them this year. I'm working through a new Algebra 1 curriculum (I'm not impressed with it) and I'm trying to rethink how I do formative assessment. My activities aren't changing much this year, the amount of time we spend doing activities and experiments feels about right. I guess that's a good thing. Here's an activity we do at the beginning of our unit on linearity: cup stacking. I took this idea hook line and sinker from Dan Meyer and Andrew Stadel. Rather than do this as a 3 ACT lesson, I use it as a chance to get students out of their seats and talking to one another.
We begin by giving 5 styrofoam cups to every pair of students. Then I show a picture of me getting my height measured at my doctor's office (in cm). They have to figure out how many cups tall I am. We also almost always need to come to an agreement about how to measure the cups. Quick setup and clean up and almost complete engagement. You can't ask for much more than that.
4 Comments
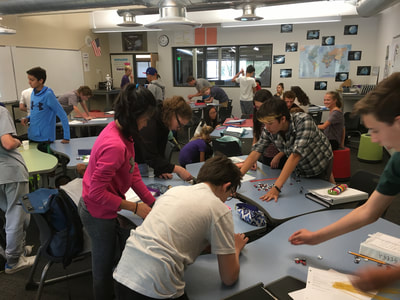
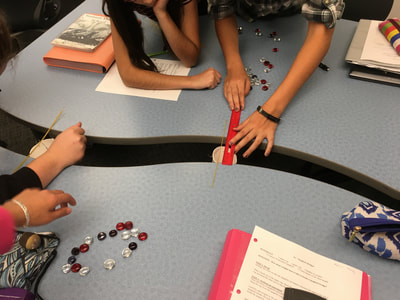
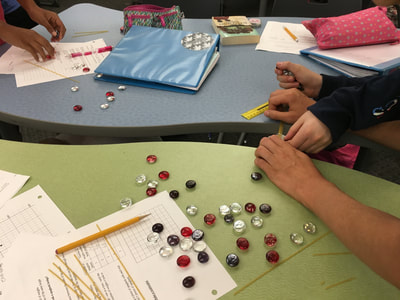
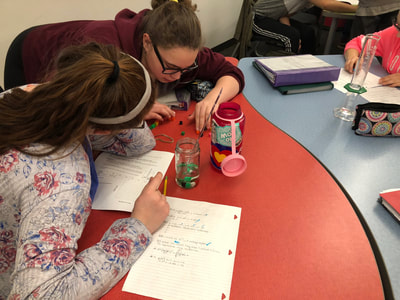
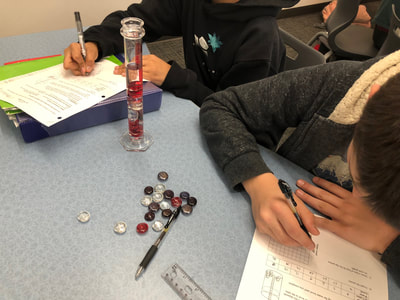
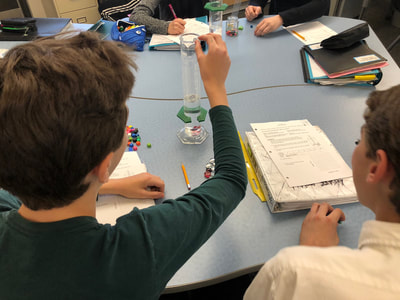
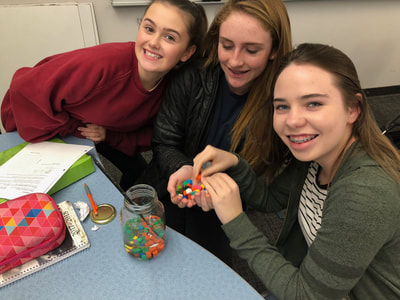
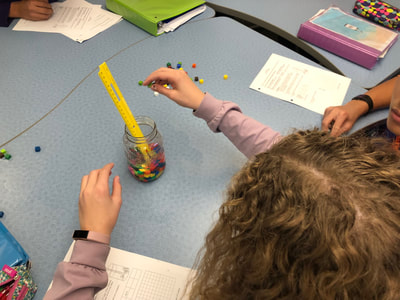
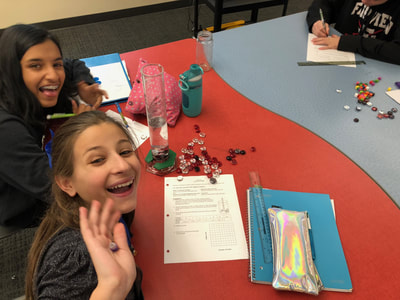
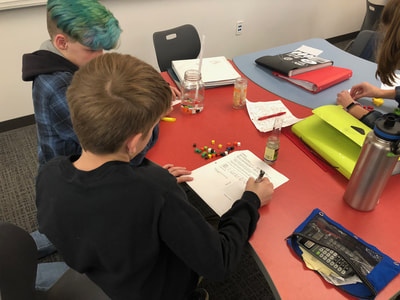
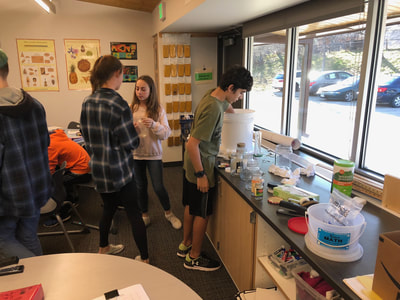
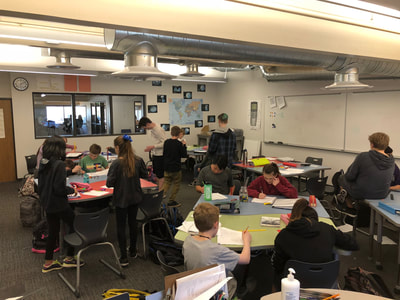
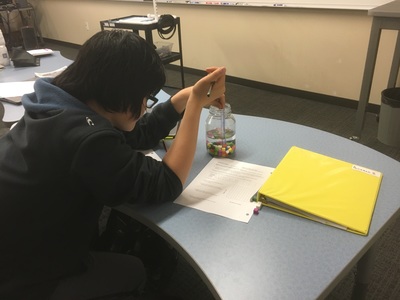
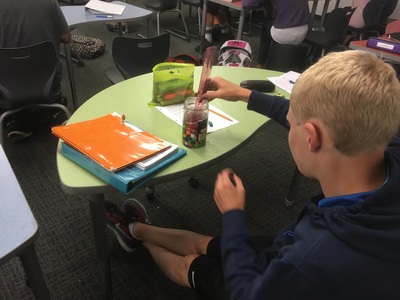
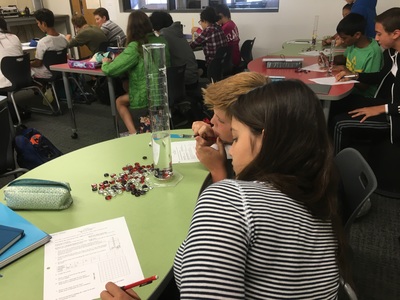
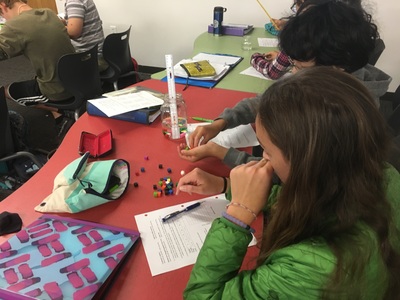
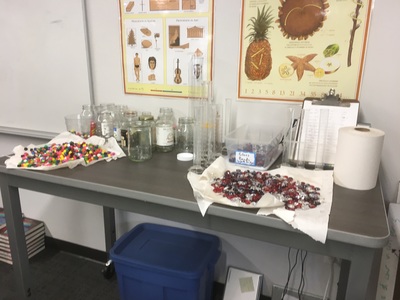
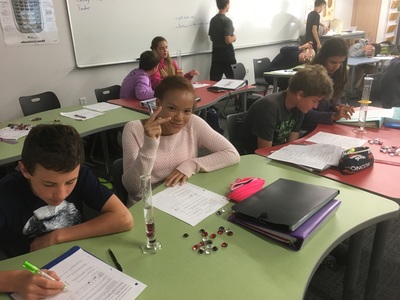
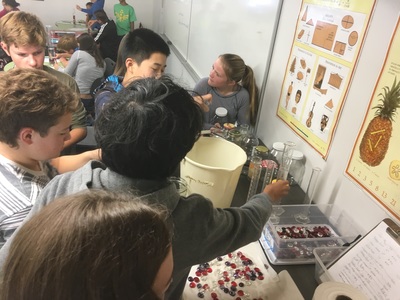
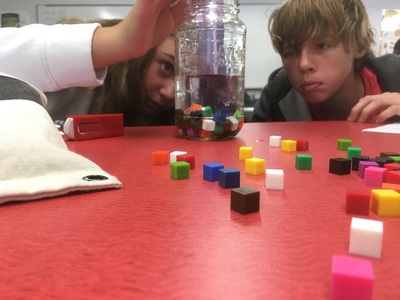
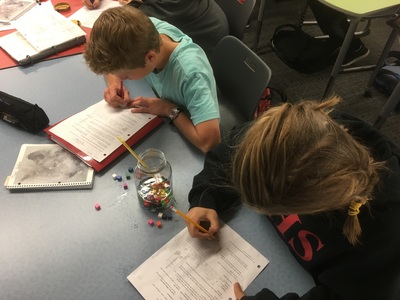
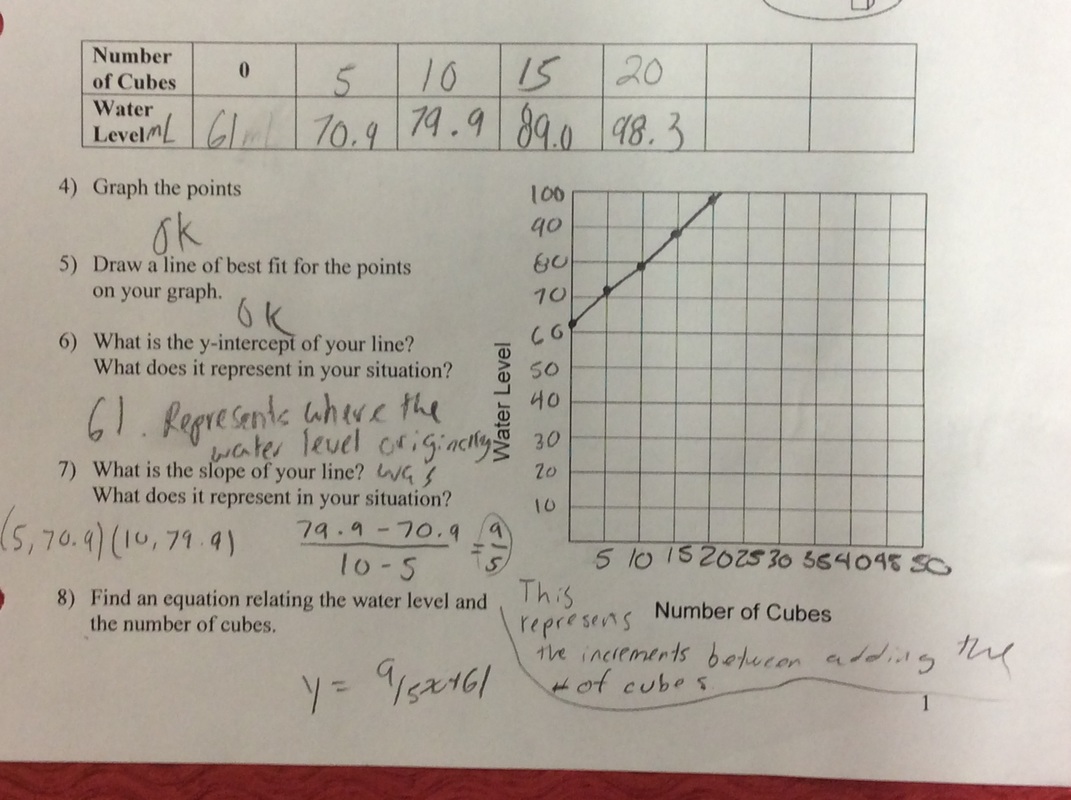
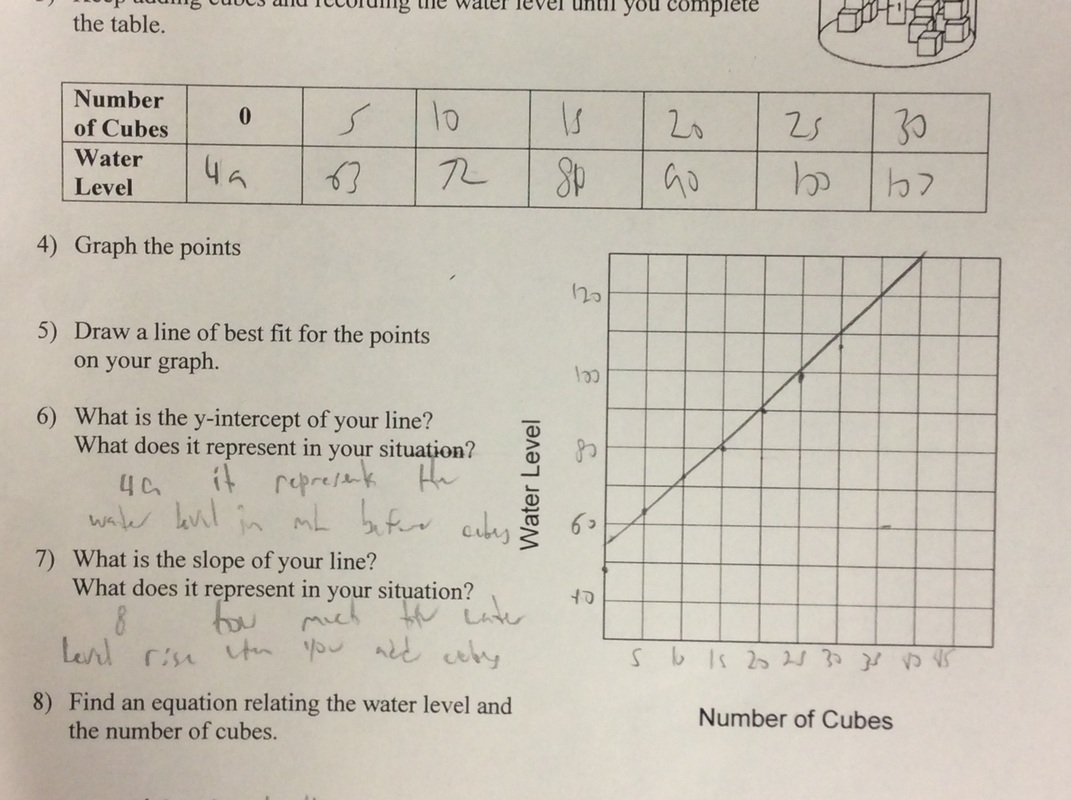
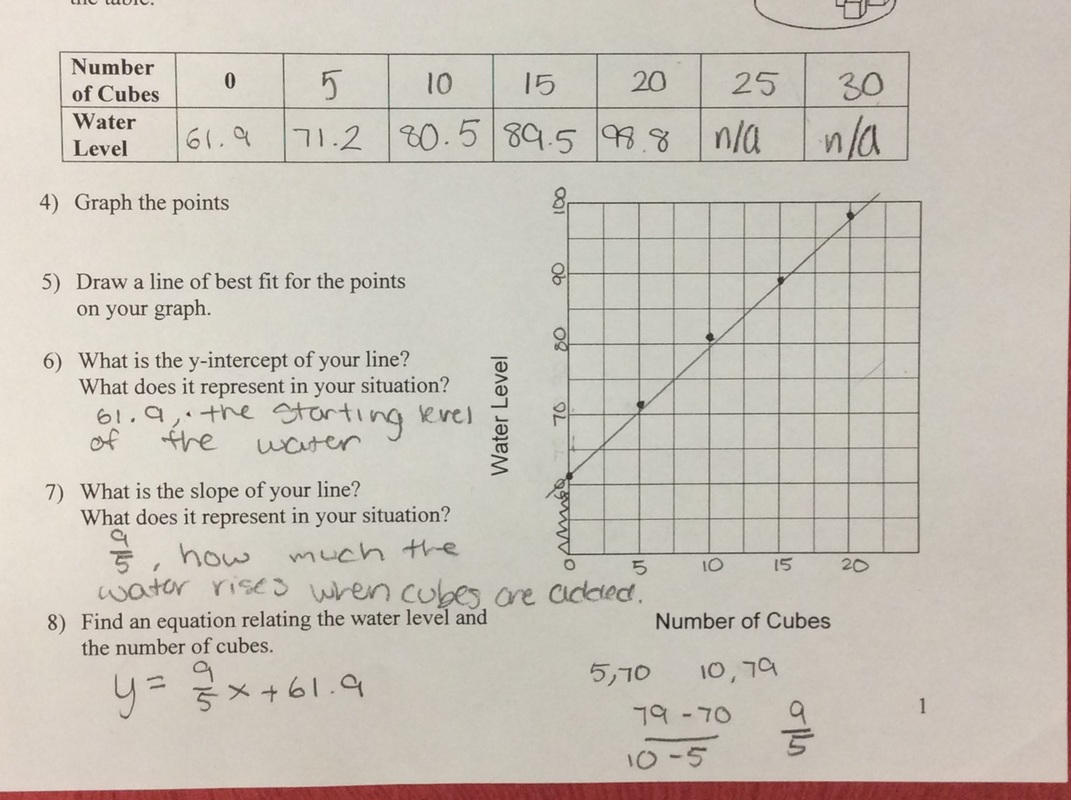
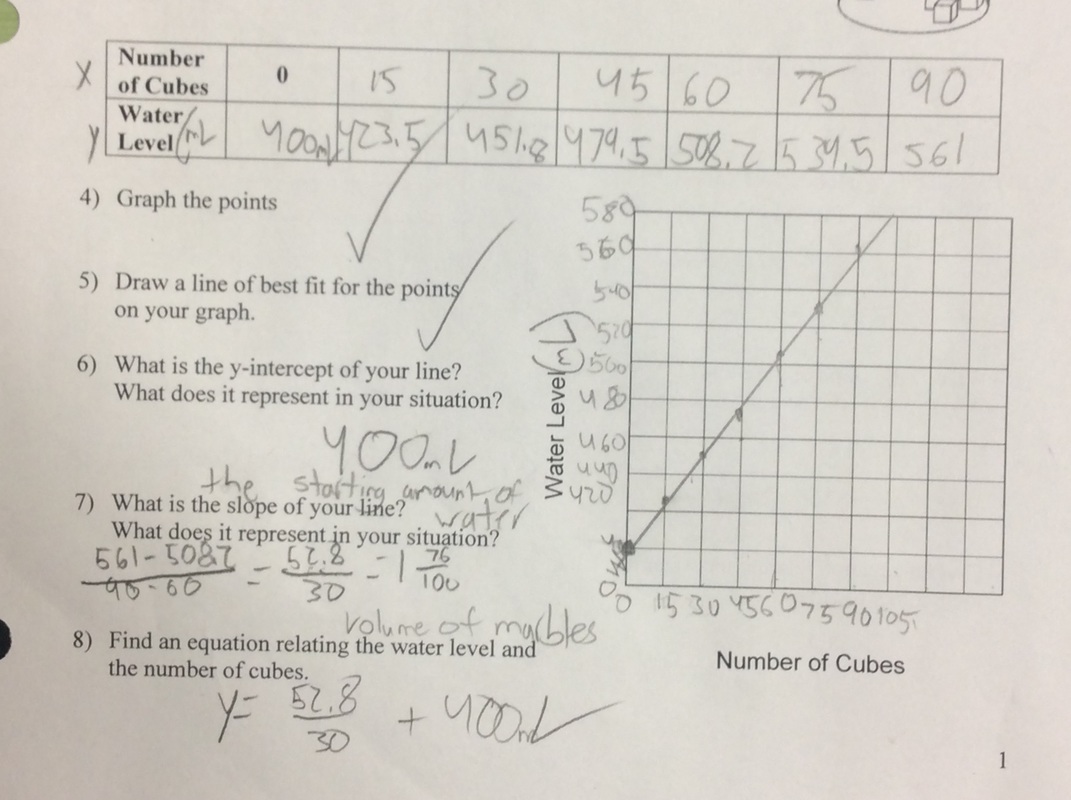
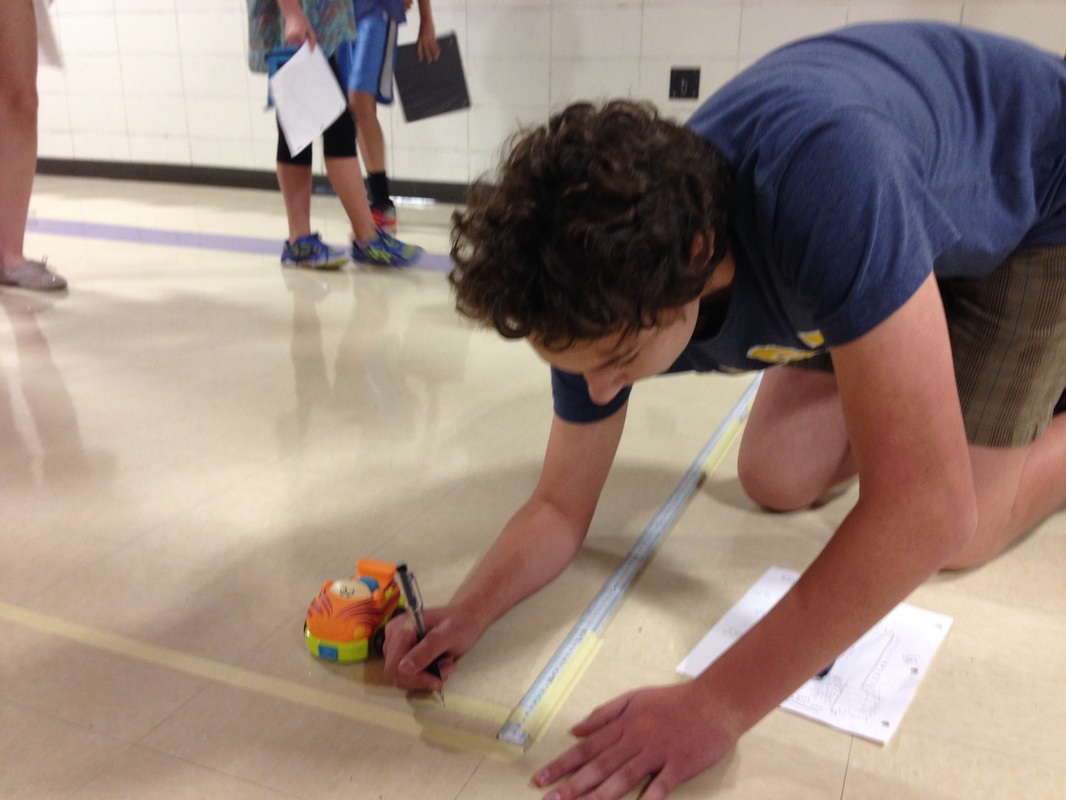
This last week we played with water in Algebra 1. My students have gone through all the typical linear stuff, but they're still weak on creating equations of lines from two points or in describing what certain aspects of the equation mean when representing a situation. To help give some motivation to practice the skill, I have a bunch of experiments in which we gather data, create lines of best-fit, and create equations to model the data. The experiments aren't amazing or anything but they beat a worksheet hands down any day. Here's the gist of how this goes. Students fill up a container with a random amount of water. They stick a ruler into the container and measure the initial height of the water. Students then add an equal amount of either centimeter cubes or glass beads to the container each time and record how the water height changes. Spoiler: the relationship is linear. Since I'm not a science teacher, I don't have all the stuff I need to do experiments just hanging out in my room. I ask students to bring stuff in. I go shopping in the science rooms. And, just in case you're wondering, science teachers actually want to help you make this work. They desperately want students to make the connections between the applications in their subject and the the math students are learning down the hall. Seriously. If I'm honest, it takes more work than I'd like to admit to pull of a good experiment but the increase in student engagement and the rapport it builds with students is amazing. And, it's fun. Fun matters. A lot. I put out a plea for staff and students to bring me glass jars. Within a couple of days I had somewhere around 15-20 jars on my classroom counter. Quick side note: I tried metal containers before but it was too hard to read the water height because of the reflection off the sides of the container. I also opted to use graduated cylinders from the science department this year. However, this put a slight wrinkle in my plans. I planned to use centimeter cubes to displace the water but I want data that isn't perfect. For those of you who aren't up on your unit conversions, 1 cm cubed is equal to 1 mL. That's about as perfect as it gets. To add some variation/spice to the experiment I had students use centimeter cubes with the glass jars and glass beads with the graduated cylinders. Since the glass beads aren't all the same size, it gave at least a little noise to the data. Students did much better when asked to create an equation from their data this experiment. However, when asked about what the slope and y-intercept meant we still had issues. In general, students nailed the y-intercept--it was the initial water height in the container. Students struggled explaining the what the slope meant in the situation. I have to keep reminding myself that what is obvious to me isn't at all obvious to an 8th grader. Here's my handout if you're interested.
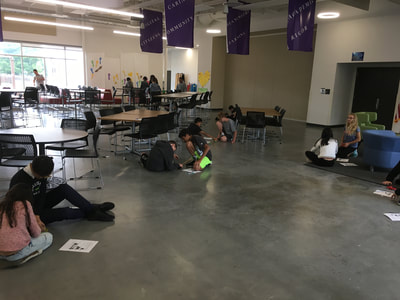
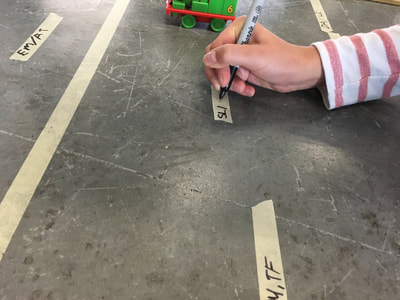
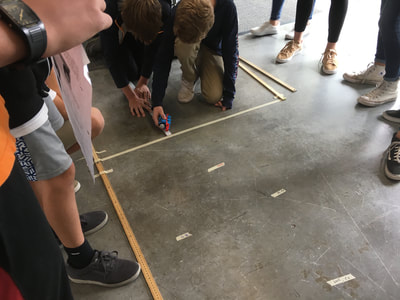
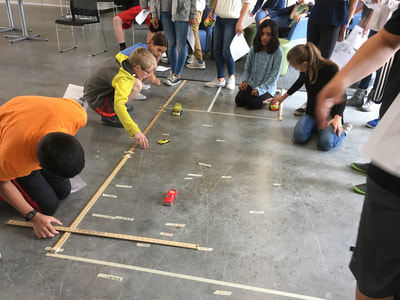
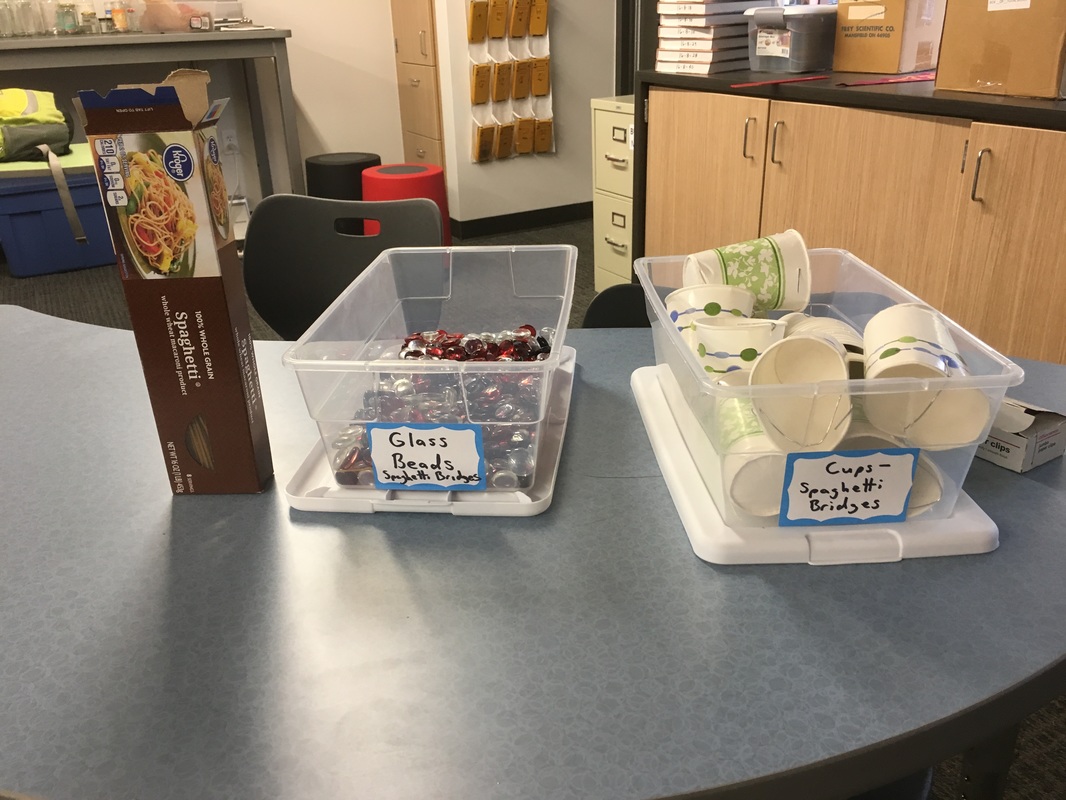
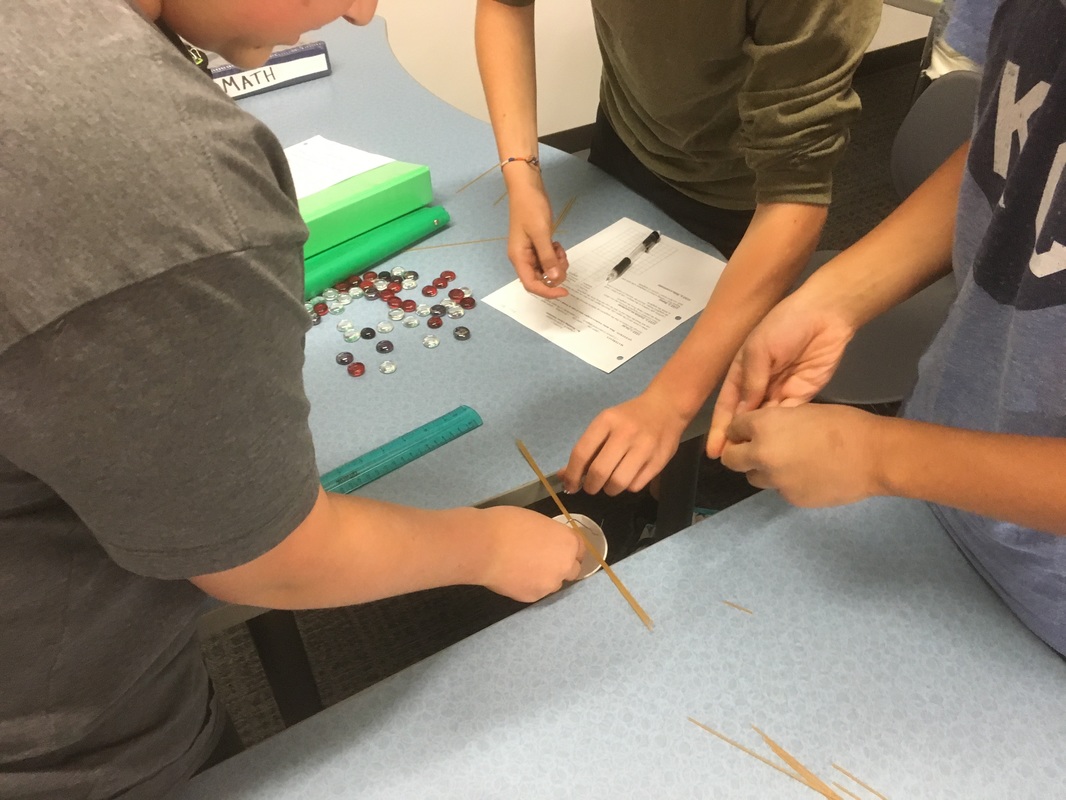
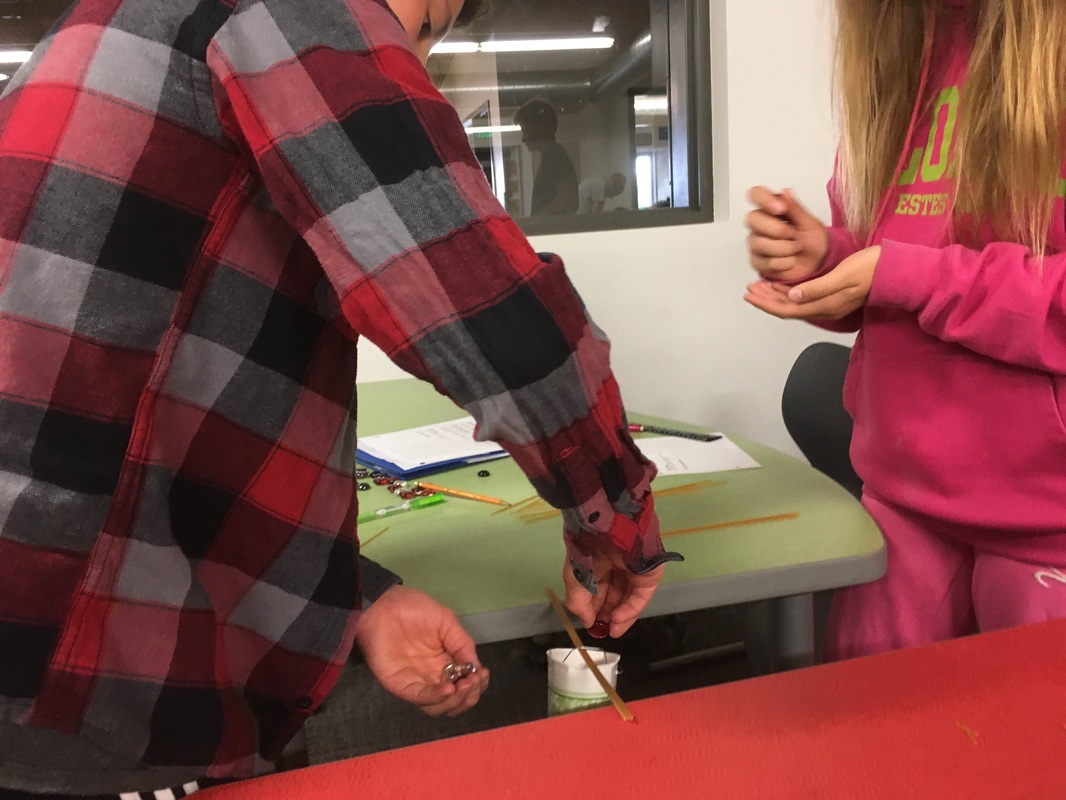
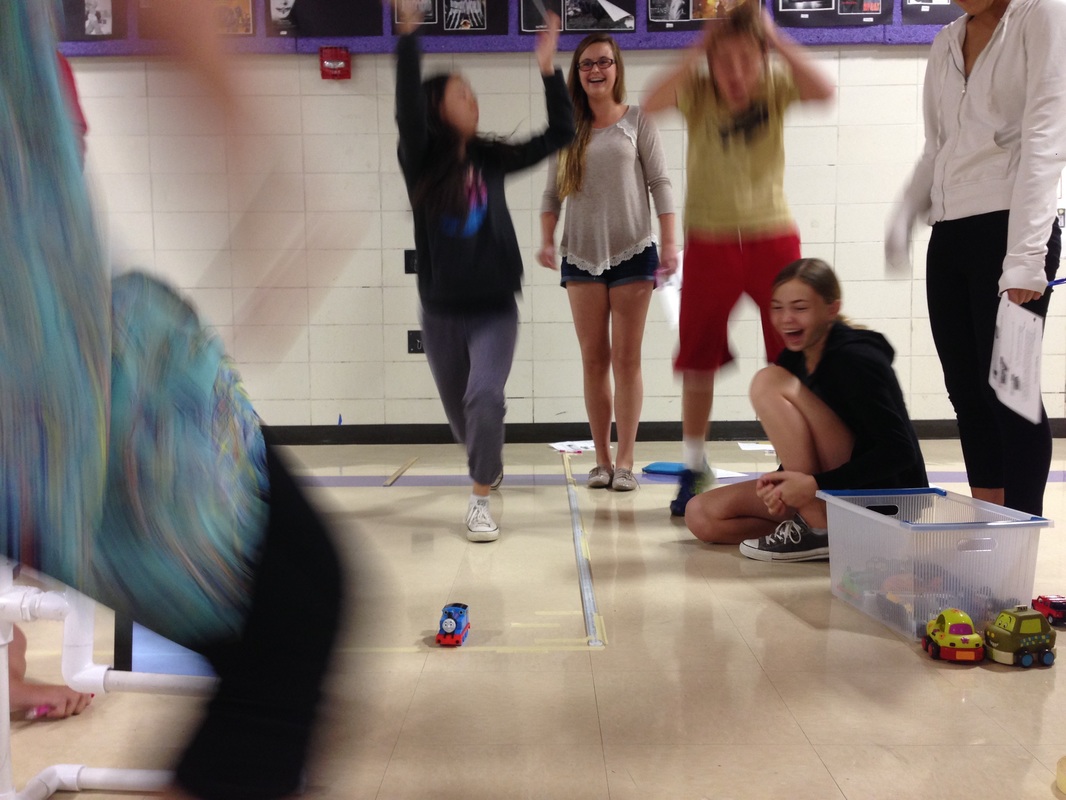
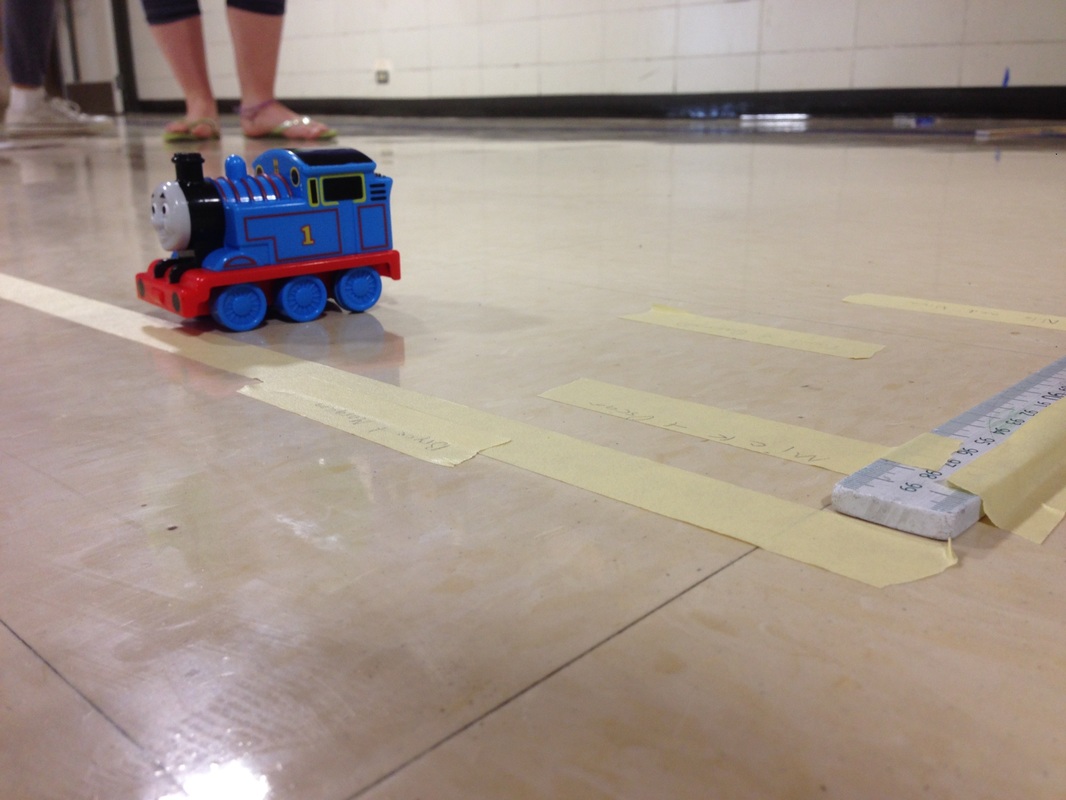
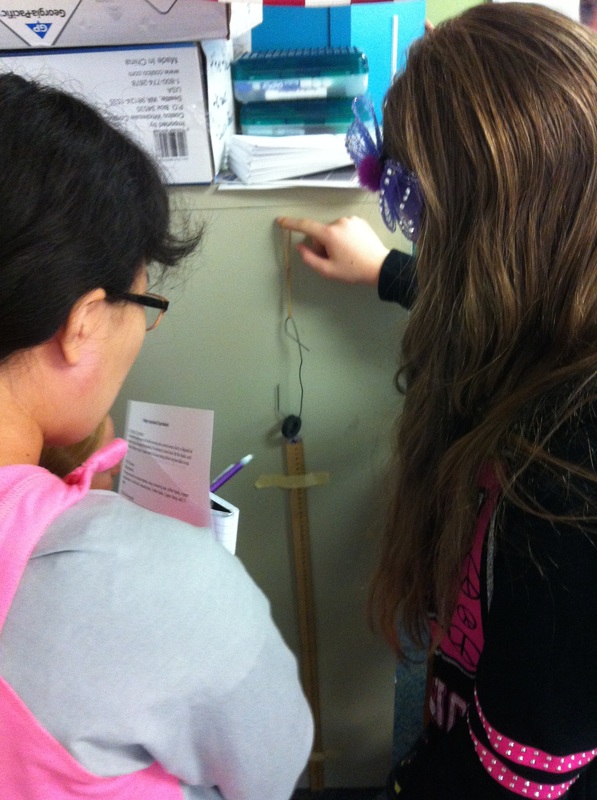
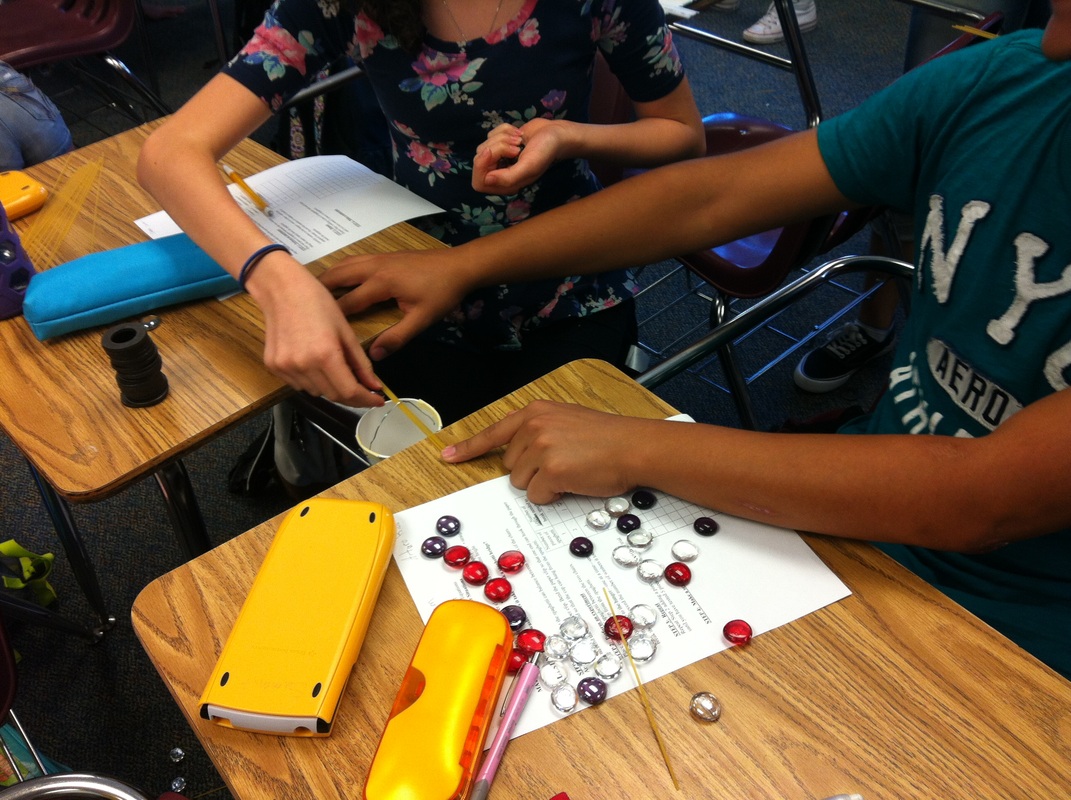
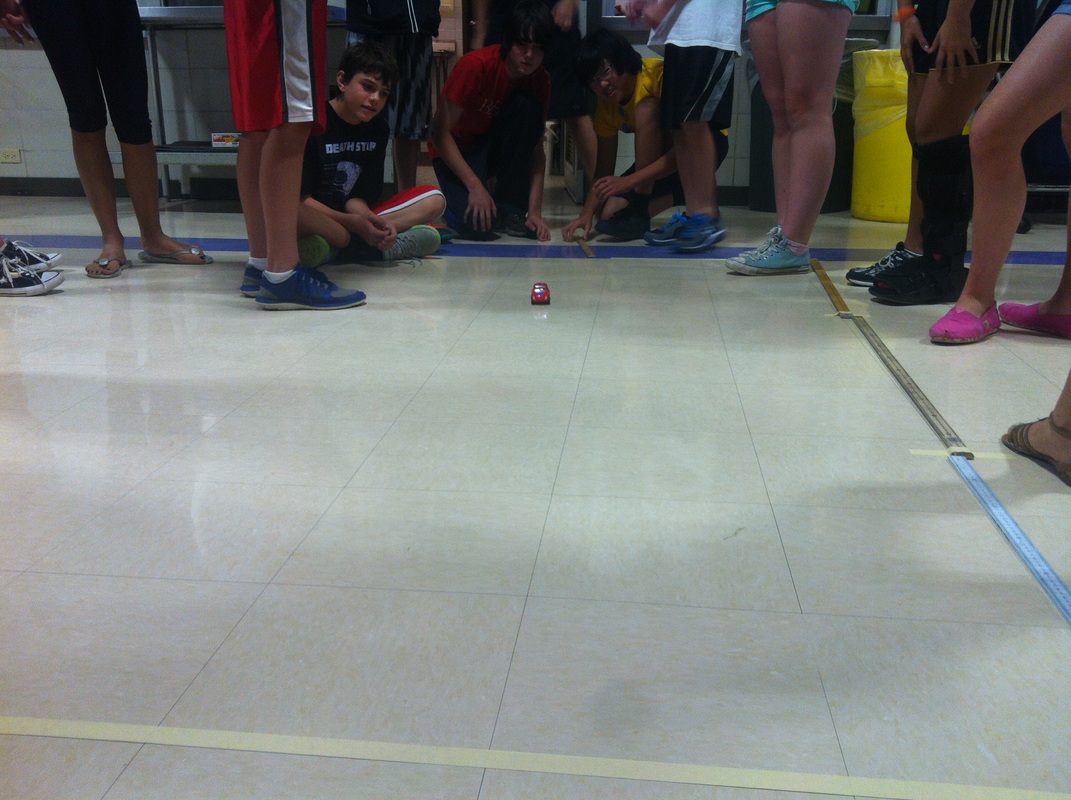
This week we start a unit on modeling linear data. But that means we need data. As it turns out, that's the fun part! Exploring linear functions in Algebra 1: Bungee Apparatus: exploring the relationship between weight and the amount of stretch. Spaghetti Bridges: looking for ways to describe how the number of pieces of spaghetti affects how many glass beads a bridge can hold. I love the conversations we have around these tasks. The physicality of the task ends up being an excellent mental hook for students to come back to when talking about topics like: independent and dependent variables, interpolation and extrapolation, correlation, error, and regression. The lineup over the next two weeks:
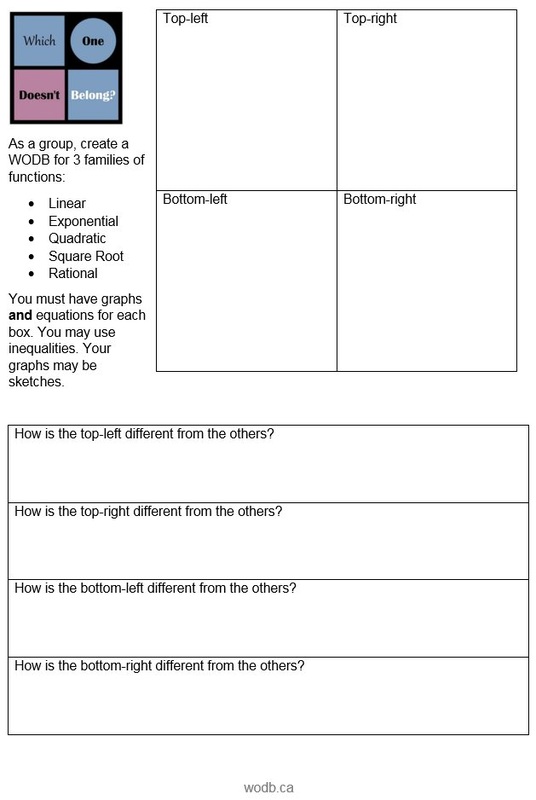
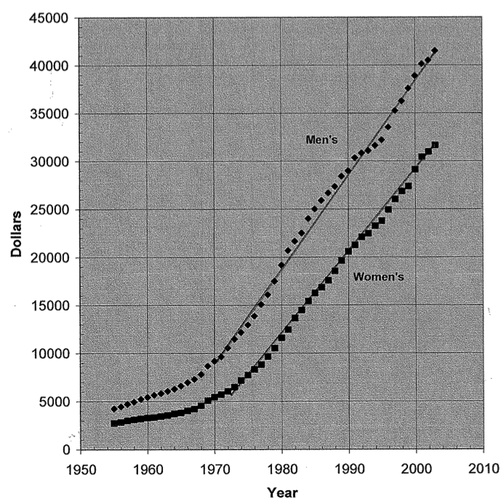
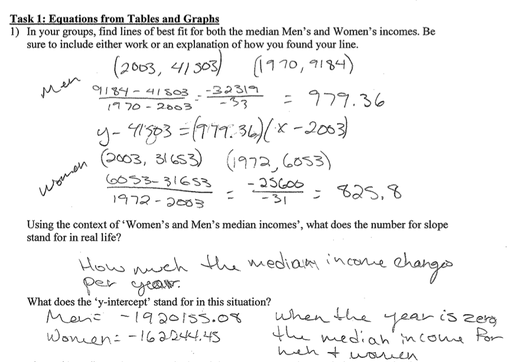
-water height based on how many cubes we drop into a container, -how the pull-back distance of a toy car relate to how far it goes forward, -the gender pay gap in these United States, -Barbie bungee jump I'll do my best to put up pictures as we go. This is an epic month for Algebra 1 if there ever was one! Quite a bit of time ago, I posted my intentions to review families of functions using Mary Bourassa's Which One Doesn't Belong format. This is a follow-up to that post. First, I feel overly proud of myself right now. I have all sorts of grandiose ideas I never follow through on. I did this one! Originally, I planned for this:
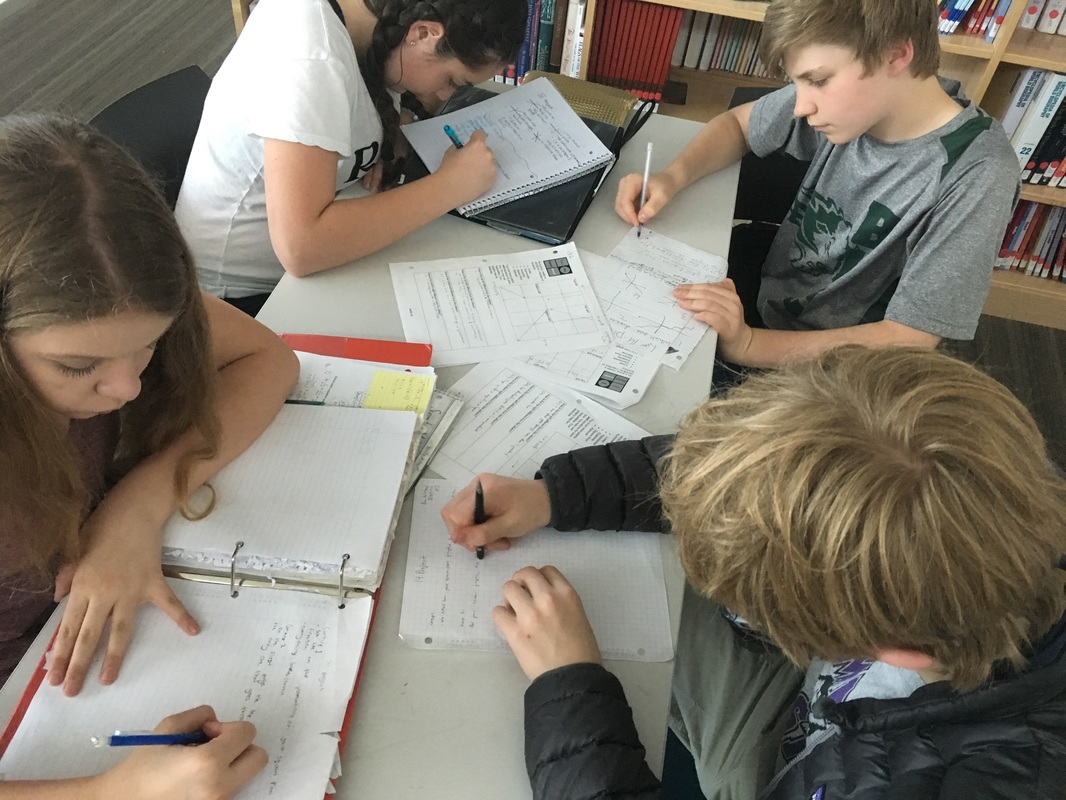
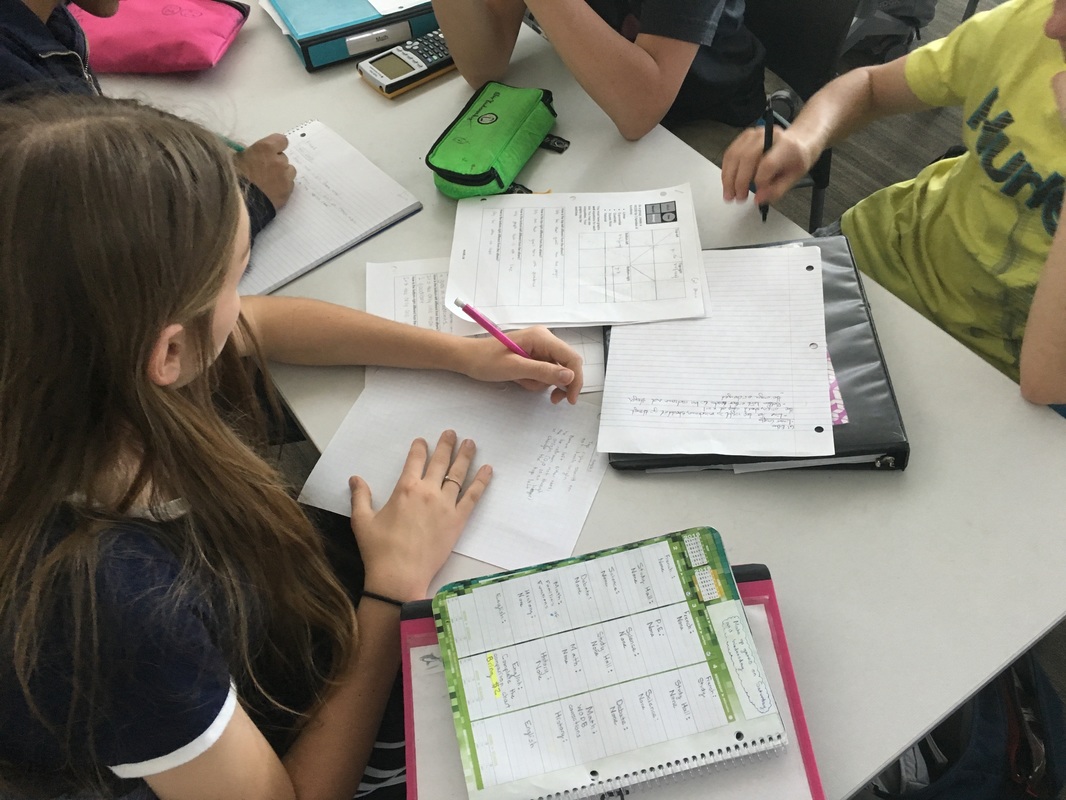
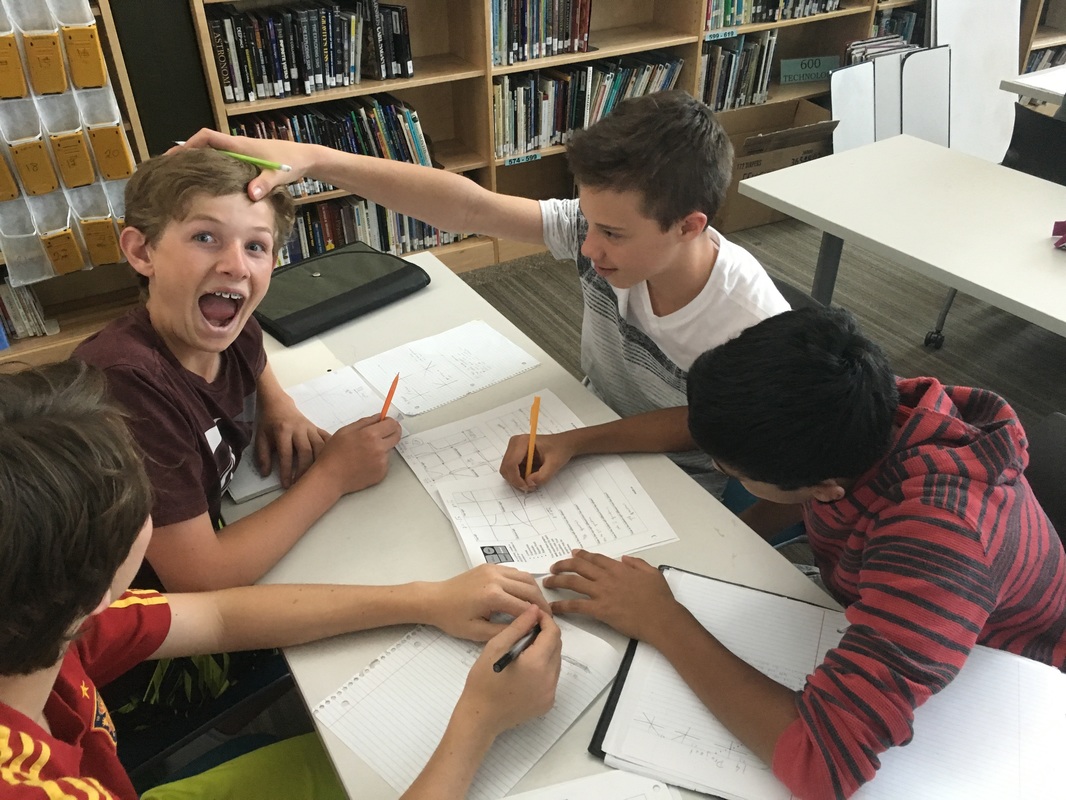
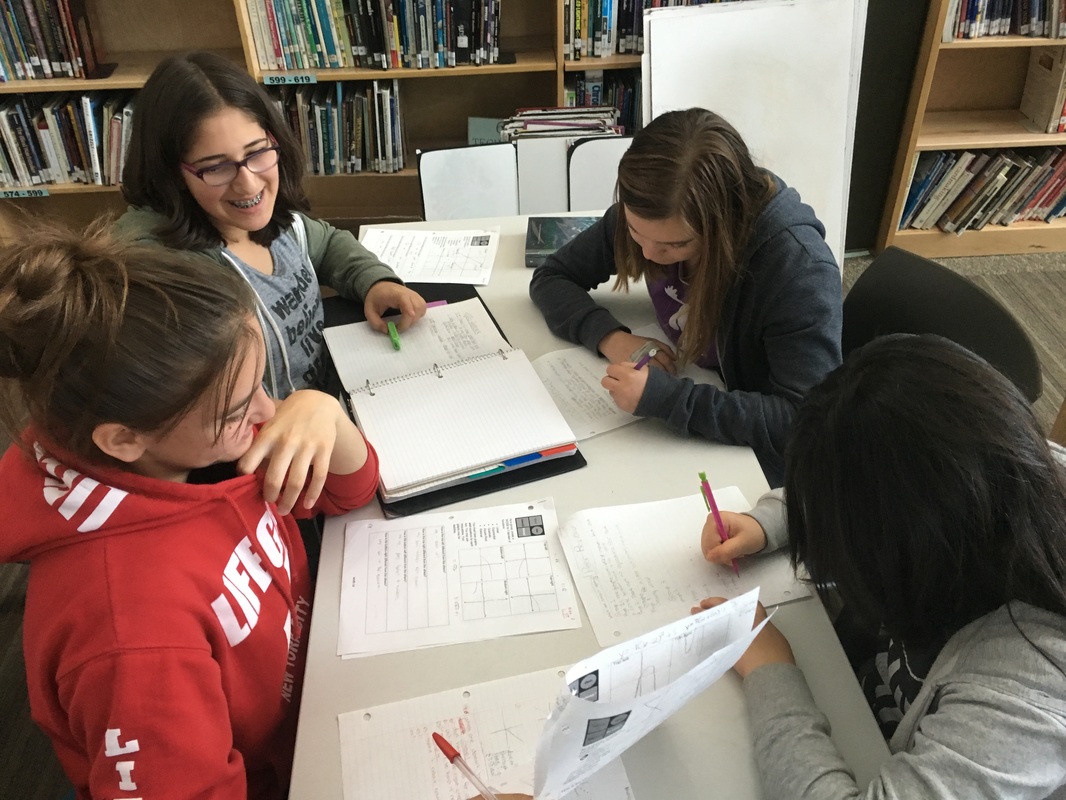
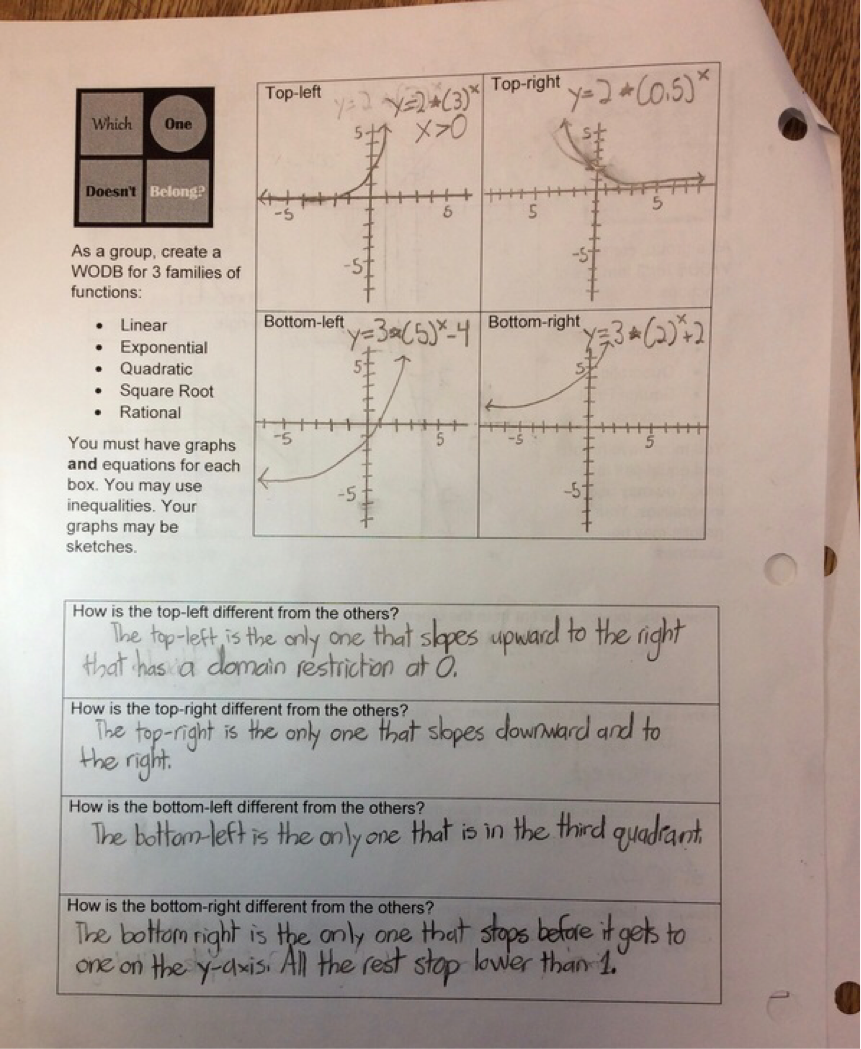
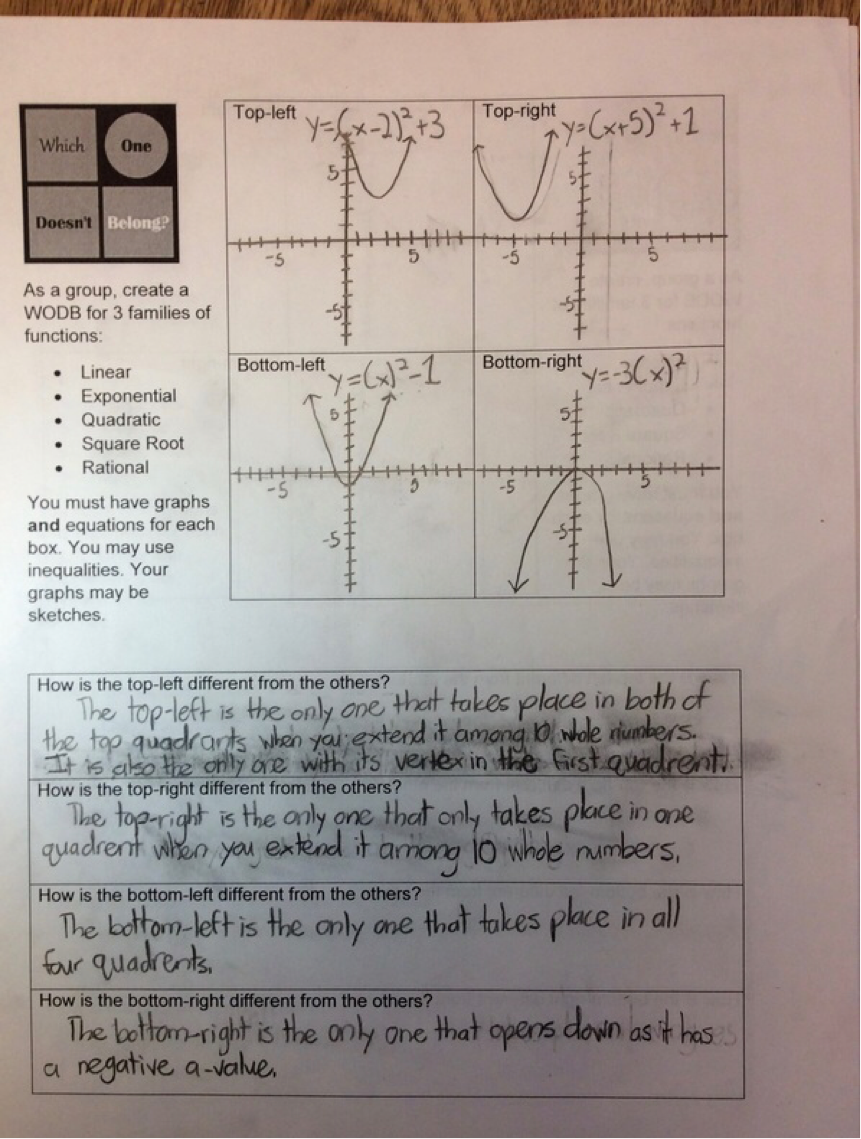
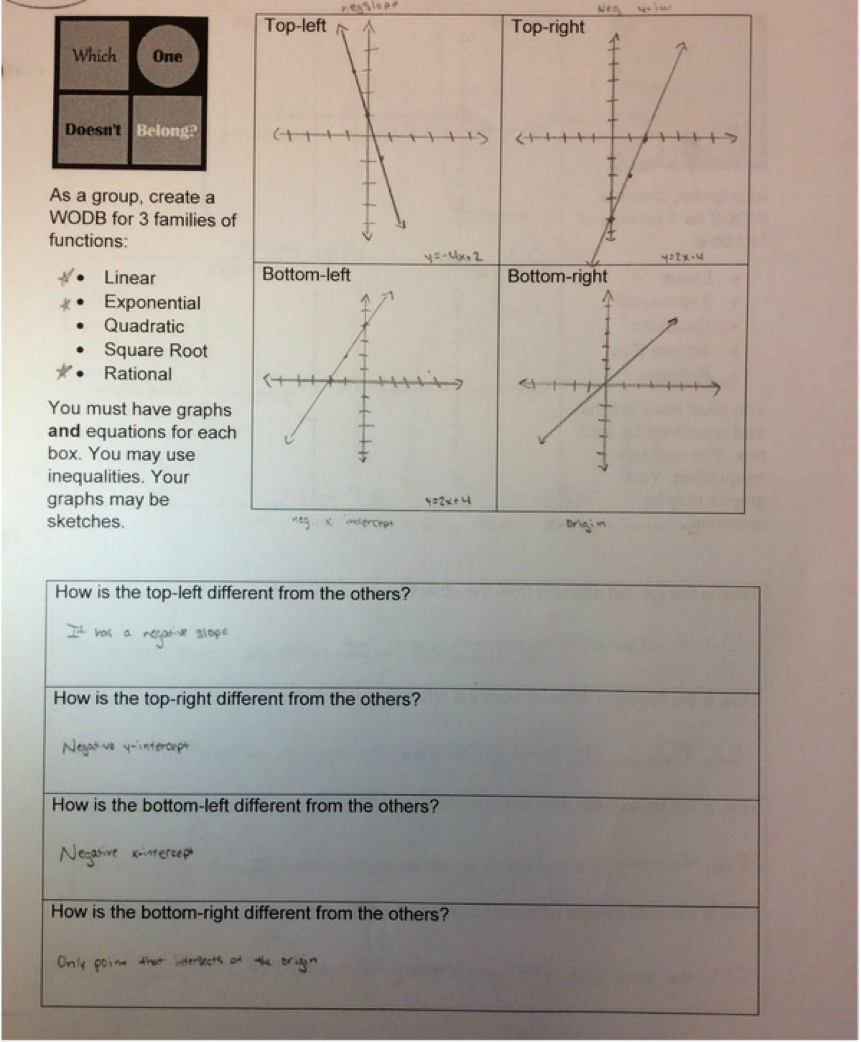
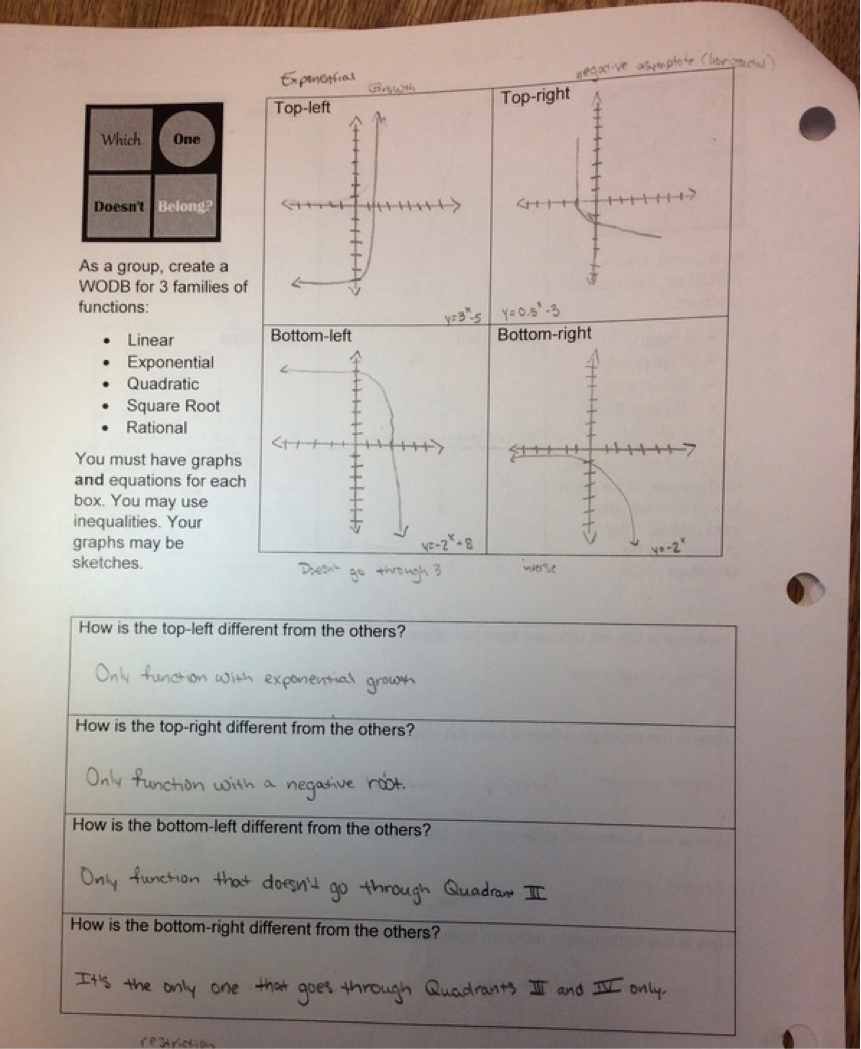
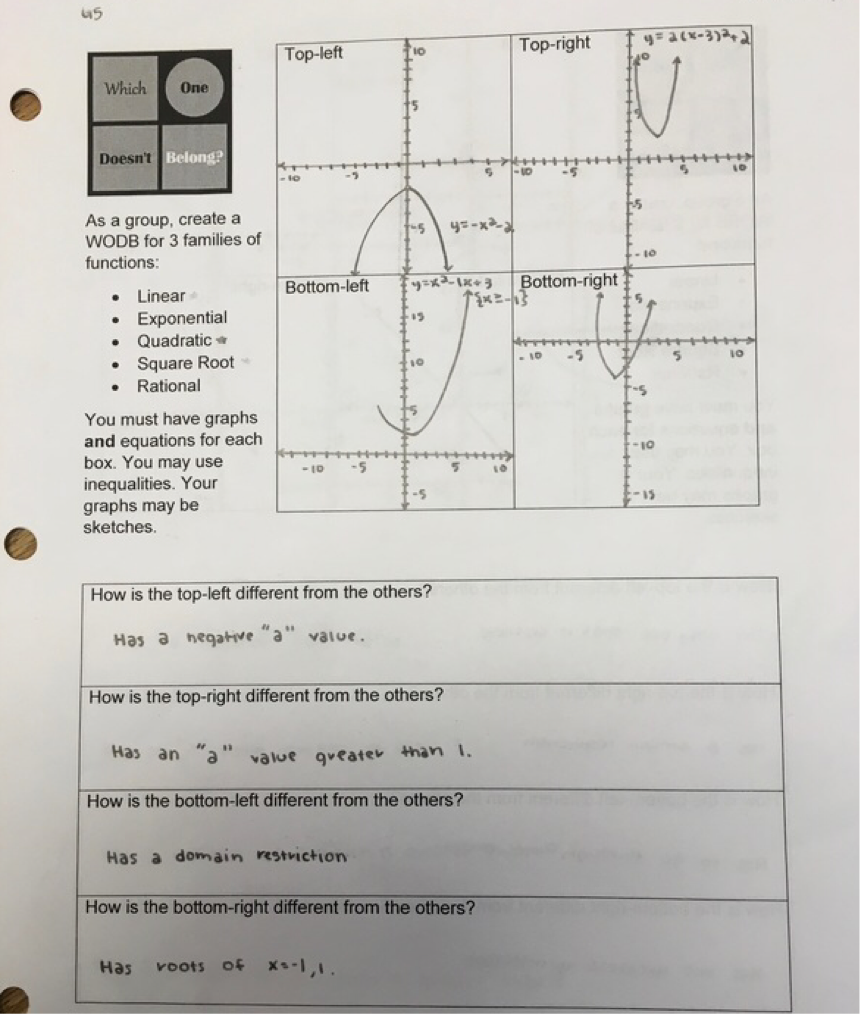
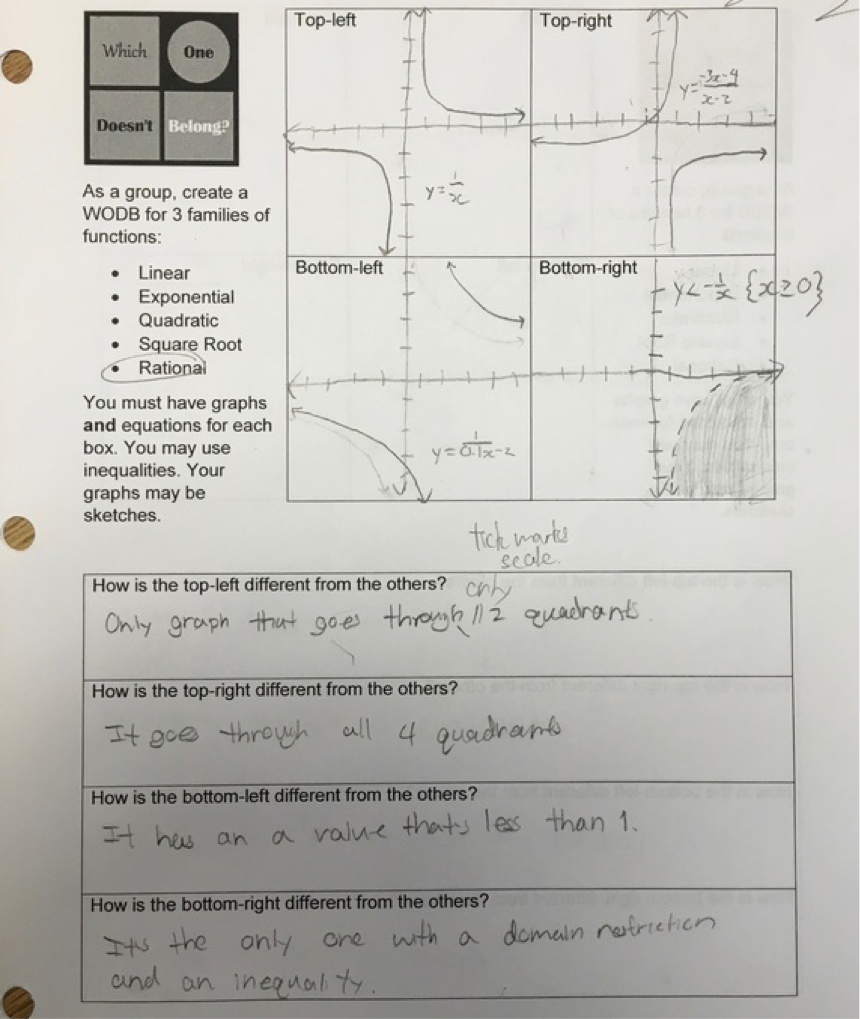
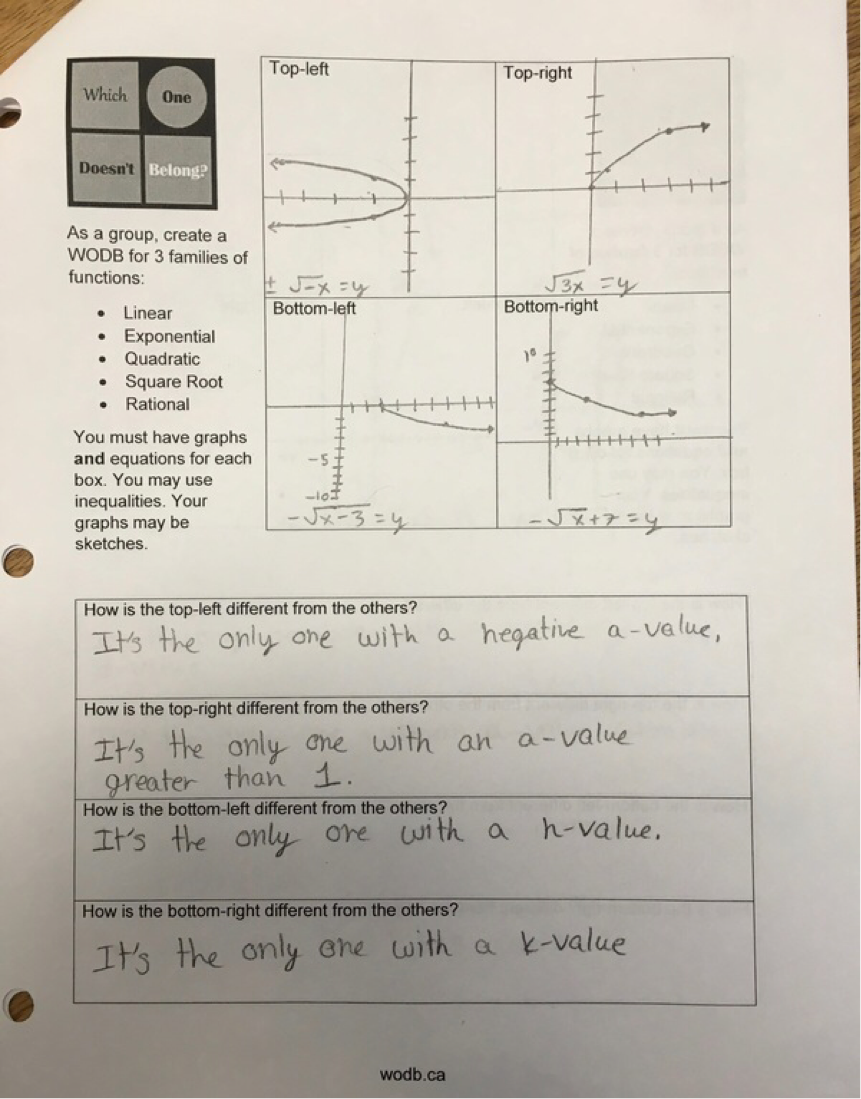
Here's what happened. 1. Groups of 4 worked really well. I had to help a couple of groups with their 'dynamics'. All groups were able to make progress without my help. I did have to give some clarification about what I wanted but I didn't have to help with the math. 2. No groups wanted to use the whiteboards. They wanted to sketch the options on the handouts or in their notes. I didn't expect that. Normally, they jump at the chance to do some white-boarding. I'll have to ask them about that. I also pulled in a chromebook cart into my classroom for the activity so students could choose to use graphing calculators or Desmos. Here the students surprised me again. Most chose calculators instead of chromebooks. 3. Handout needs some slight tweaking. See #5. 4. Rather than doing a w.o.d.b. on shapes, we did one on rational functions. I shot myself in the foot a bit here. I wanted students to compare and contrast within a family of functions not between the families of functions. The example I chose had one function that wasn't a rational function. I should have caught that. Next year. 5. Students did an impressive job making connections between representations. Next year, I plan to change the directions regarding the graphs. This year, I said "sketches of graphs" were okay. Turns out, they were in no way okay. Apparently, my concept of "sketch" is different than almost all of my students' concepts of "sketch". Next time, I plan to require an "accurate" graph and put a grid inside the 4 boxes. Hopefully, that fixes the differences in expectations. While I'm at it, I probably should require that all the graphs have the same window. Here's a quick selection of student work. I'll talk a bit more about how the days went after the picture show. Day 1: I didn't know what to expect. As it turns out, this task was easier for them than I thought it was going to be. After groups rocked out a quick w.o.d.b. on lines without a whole lot of effort, I did ask them to make the distinctions more interesting. For example, when making a w.o.d.b for lines, please don't use 1) positive slope, 2) negative slope, 3) zero slope, and 4) no slope. That works, but it's a little too basic for end of the year Algebra students. Most groups finished one of the families of functions on this day. Day 2: Most groups finished their other two families of functions. Those that didn't finish needed to finish at home. Day 3: Peer revisions! Students worked collaboratively to create the w.o.d.b. for all three families. Mostly this worked well. However, in some groups there was a feedback loop of bad advice and/or misconceptions. The logical voice didn't always win out over the loud voice in the groups. I took a play from our English and History departments and decided to spend a day doing peer revisions. I shifted the groups, so that every member of the group was now with a different group. (Group 1 Student 1, Group 2 Student 1, Group 3 Student 1, and Group 4 Student 1 are now all in a group together.) Students gave each other great feedback. Afterwards, students went back to their original groups and shared the criticisms. Then groups had a chance to revise their work before handing it in to me the next day.
All sorts of wonderful things can be said of Mary Bourassa's Which One Doesn't Belong. This year I've started incorporating it for new families of functions in Algebra 1. We have great 10 minute discussions about how each of the options could be thought of as not belonging to the group. In light of these brilliant compare and contrast sessions we have throughout the year, I plan to attempt a review project having students create their own WODB for different families of functions. Here's the plan:
Here's my handout. The file is linked below.
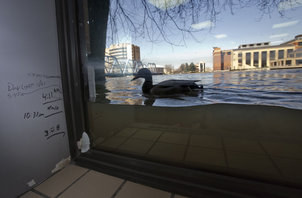
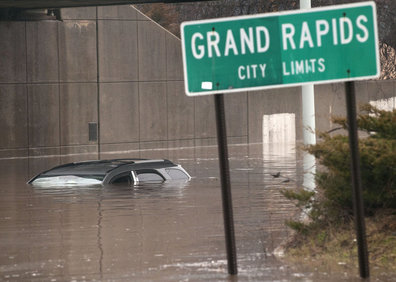
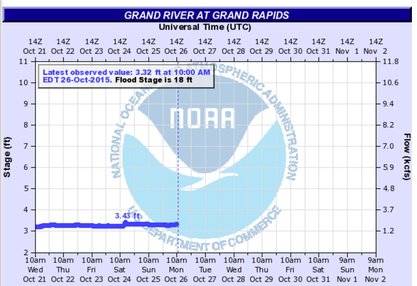
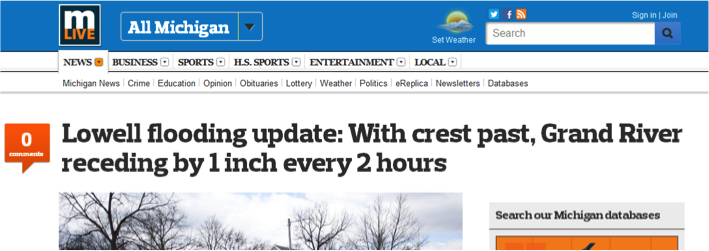
A couple of years ago, the town I came of age in experienced dramatic flooding. I couldn't do much to make the water recede or fix all the damage. I could help the kids process how math could apply to the situation. So, I created a rather simple math lesson grounded in the flooding context. The lesson was gold back in Michigan. But now I've moved--I'm teaching in Boulder, Colorado. Would it still work with students who had not experienced our flood? I didn't change a thing about the lesson. It's still about Grand Rapids, MI. Turns out, it's still gold. Why? I think it's less about the lesson and more about 'story'. Students walk in with pictures of the flood showing on the projector. On Sunday, April 21st, 2013, the river crested at 21.85 feet. Flood stage for the river is 18 feet. The Grand River is normally just 3.5 ft deep. In class, we take precious time to make this about people. We talk about how the displaced people must have felt. We see if anyone in class has been involved in a flood and wants to share a couple sentences about their experience. We talk about how people are anxious to get back in their homes and start the cleanup process. Of course, this can't happen until the river is below flood stage. You don't want to start pumping water out of your basement if the water is still a foot above your front door. In seat pairs, the students' job is to tell these scared people when they will likely be able to return to their homes. For those of you not familiar with the geography of western Michigan, Lowell is a suburb of Grand Rapids. The above headline gives us the information we need to make a prediction. Because this is a historical event, we don't have to guess at what happened. There are actual records. The Grand River crested on Sunday April 21st at 10pm and then started to recede. It fell below flood stage about 4 days later around 5pm on Thursday afternoon. Students are able to predict this result within an hour and a half! The last minute or so of class we talk about the power of math to make predictions. Using math, almost every time we can see a pattern in data we can make a prediction with a decent level of accuracy. That's absolutely brilliant!
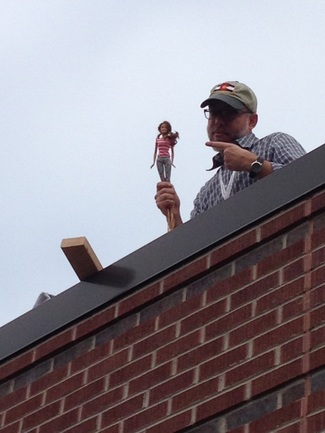
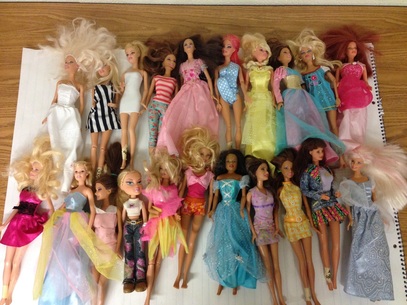
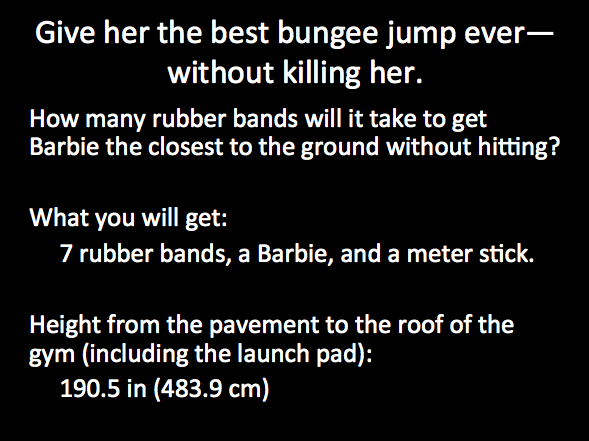
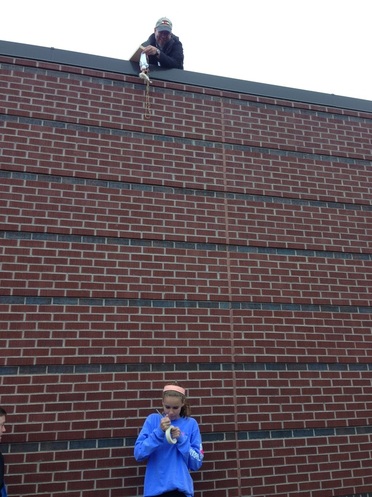
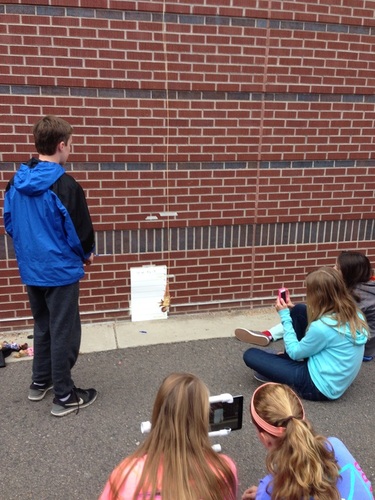
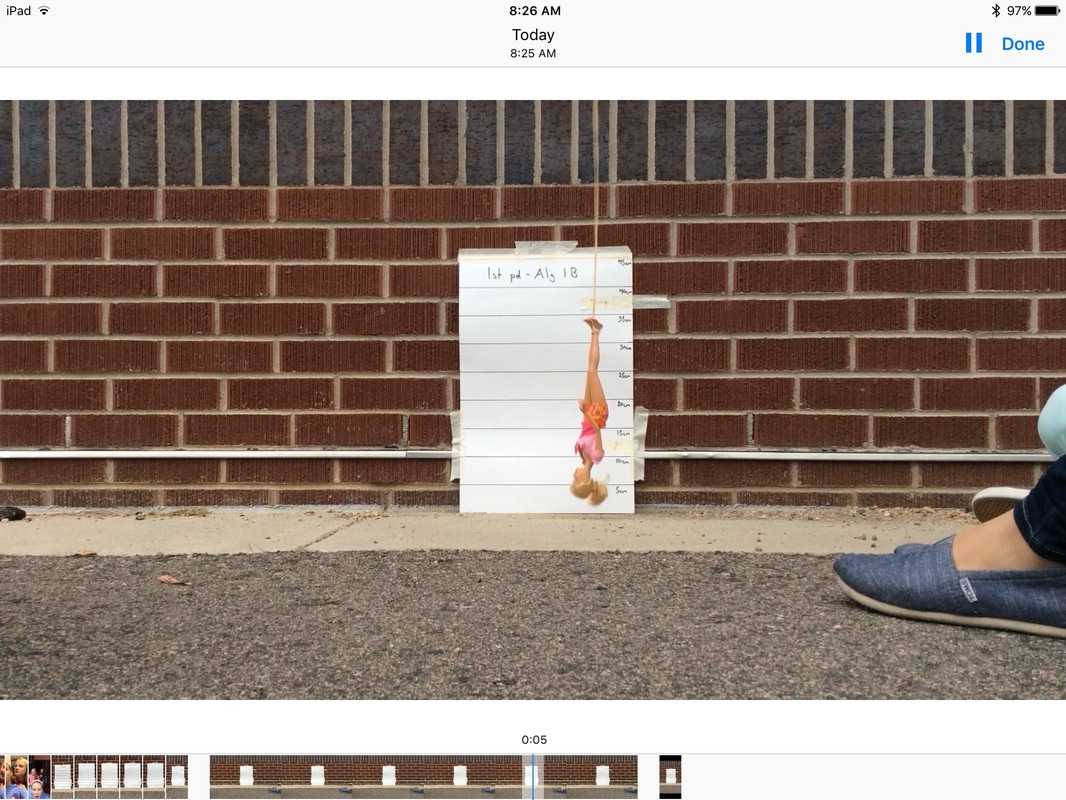
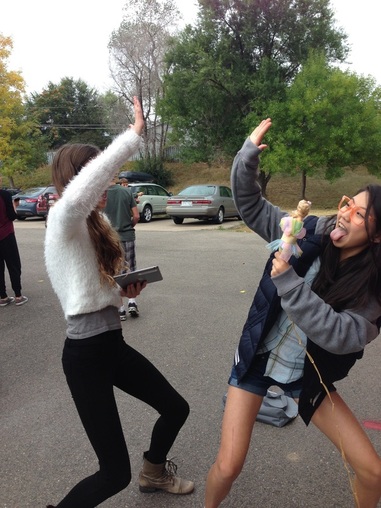
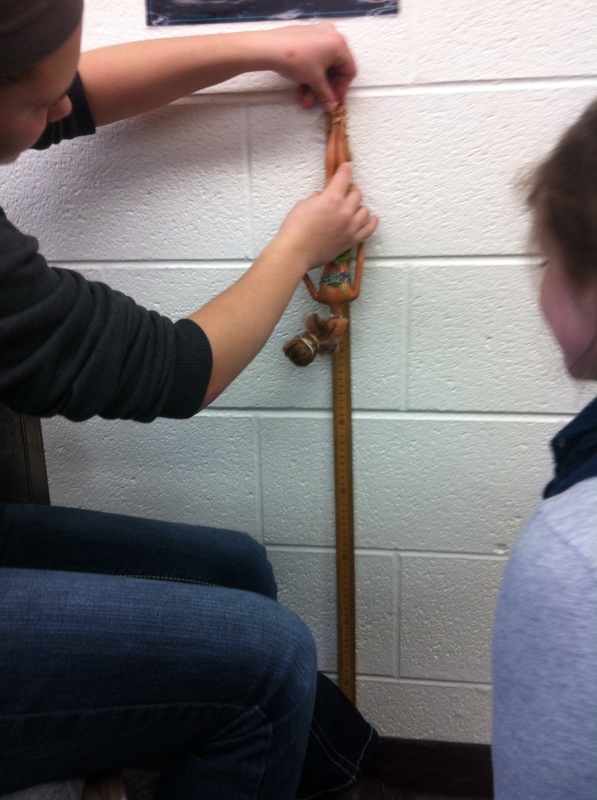
Let's start off with a little reality check. Almost none of what goes on in my classroom is new. I beg, borrow and steal from every brilliant teacher I meet. Barbie bungee has been around at least since the late 1990's--that's when I first encountered it. However, newness or uniqueness has nothing to do with student engagement. Students eat this stuff up! The last time I had a student ask me when we were every going to use this was when we were calculating percentages for tips in a restaurant. Eh, it probably happened when we were looking at rational functions last year but I bet I blocked it out to pretend I was doing a better job with that unit than I actually was. Day 1: For weeks in advance I have students bring in their childhood Barbie dolls. This year I even had some of the staff raid their kids' toy boxes. Even though we do all sorts of other experiments while we wait for the stock of plastic dolls to reach a critical mass, this experiment is what the kids are waiting for. I don't give a lot of directions with this activity. At this point, we've spent the last two weeks looking at messy data. We've gotten really good at making lines of best-fit and then creating an equation from two points on the graph. This is the only slide I put up on the screen. We talk about how I will drop the Barbies come show time--feet touching the bottom of the board. We talk about some way to get Barbie's hair to stay down so we can get good measurements. We talk about being respectful of other classes while we're in the halls. And then they go for it. We spend the rest of the first day gathering data, creating scatter plots, drawing lines of best-fit, creating equations and figuring out how many rubber bands we will need to get as close to the ground as possible. After a couple of years I started requiring some certain work in order to meet my objectives. Each student must: gather data, make a scatter plot, create a line of best fit, find the equation for the line of best fit, and show work for finding the number of rubber bands they want to use. Day 2: On the second day--the day of truth--I begin class by asking for some help. We need: -a videographer (uses my iPad): We use this for instant replay while I'm on the roof. Any disputes get settled quickly by going back to the video. -a photographer (uses my phone): I attended a technology conference years ago. The keynote speaker--whose name escapes me at the moment--said if we don't tell our stories someone else will. It's why I started blogging. It's the day I got a Twitter account. I want my parents and my admin to know the awesome things that go on in my class. I want to steer the conversation in the direction I want it to go rather than hope my principal comes in on a 'good'; day. -2 measurement experts: These are the folks that are in charge of the scoreboard. They corral everyone into putting their group names on a piece of masking tape and then placing the masking tape at the appropriate height on the scoreboard. All while I'm on the roof. And of course, if you give students your devices, they will take selfies. *sigh* I deleted lots of them this year. You don't have to use a roof. I've done it from the ceiling of my class. I use a roof for the spectacle. I want students to feel like this is special compared to what we normally experience in a school day. Plus, the kids from the other classes stare out the windows and wish they were in math class. Love it. My videographers hard at work. Plus a student who had slow motion capabilities on her phone so she volunteered to help out. Here's an example of instant replay on the iPad. I ask students to take screenshots of the close ones so I can fire off an email at the end of the day to parents without having to sift through all of the pictures. One of the side benefits of taking video is that people outside my classroom get to hear the students' reactions to math class. Never underestimate the power of a parent hearing their child squeal with delight in your classroom. I've seen tears of joy on more than one occasion. It's not that I'm a better math teacher than most. I decided to start telling my own story instead of letting my students, my admin, or the broader culture tell it for me. The rest of the world doesn't know the awesomeness that is math class. Racing Day in Algebra 1 Goal: come as close as you can to the finish line without going over. How can you possibly come any closer to the finish line than this group? Wait for it. Wait for it. Oh. My. Goodness. This group of brilliant students got as close to the line as I have ever seen! Congratulations Thomas. That's a photo finish if I ever saw one.
This year I find myself teaching a class called Algebra 1B. It's basically the second half of Algebra 1--except that I have almost the whole year to teach it. So pretty much, almost every activity I've ever collected I get to do with these kiddos. Here's our last two weeks together. Next week: Barbie Bungee Jump
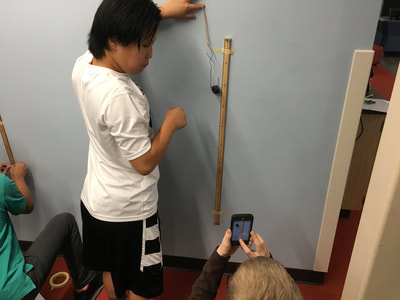
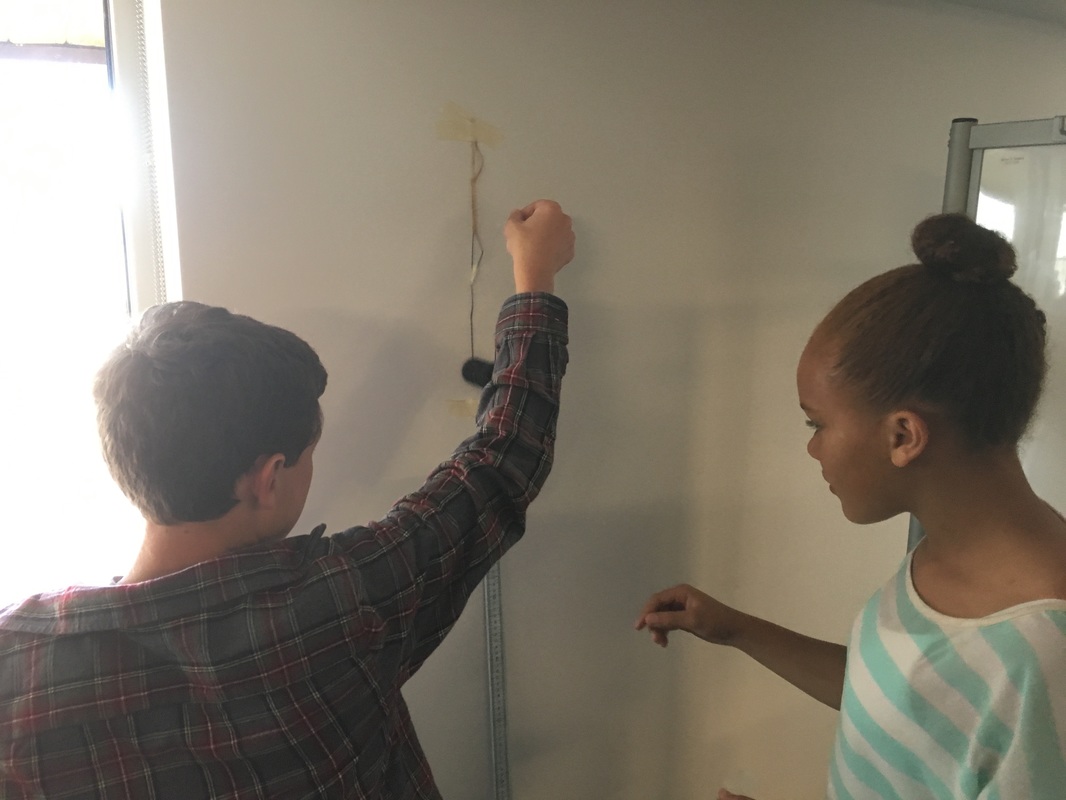
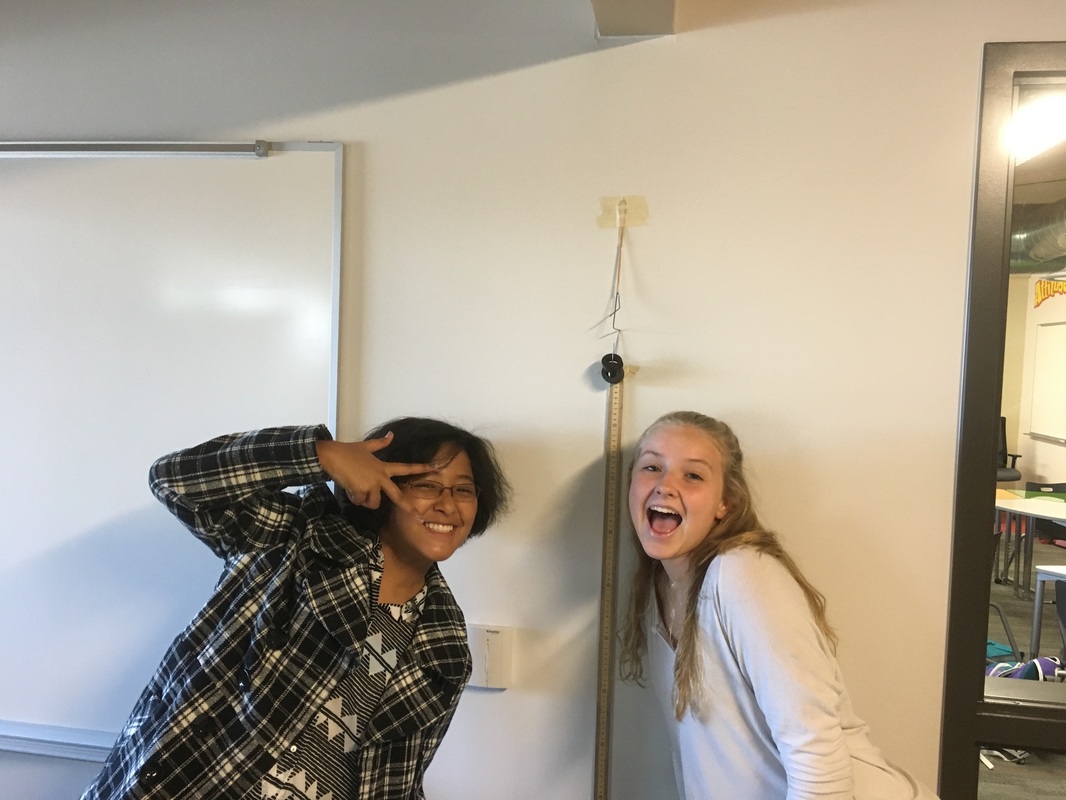
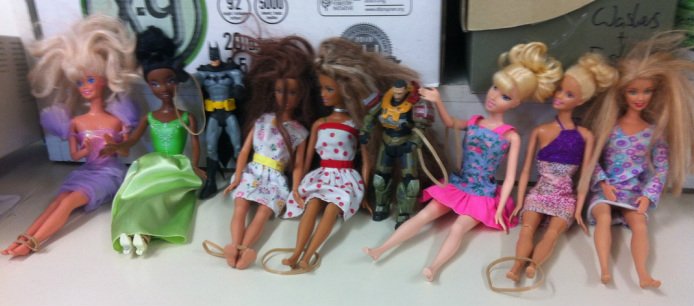
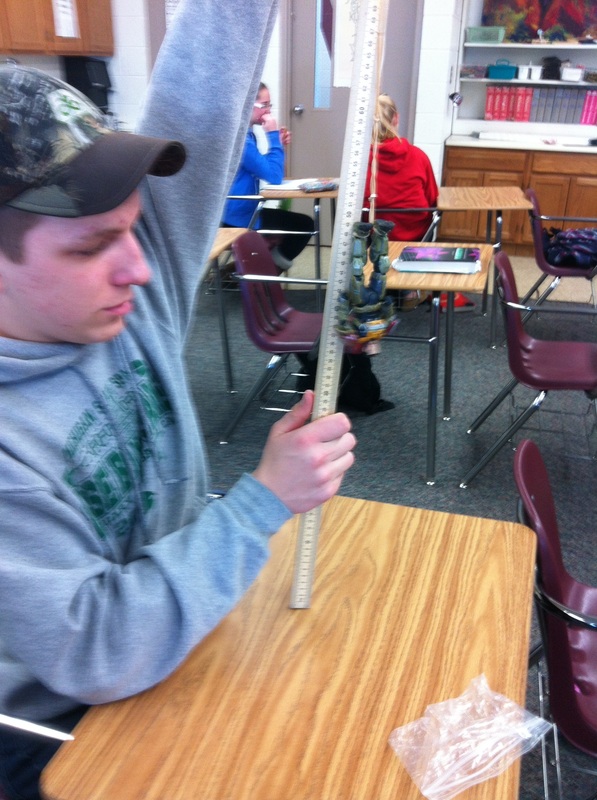
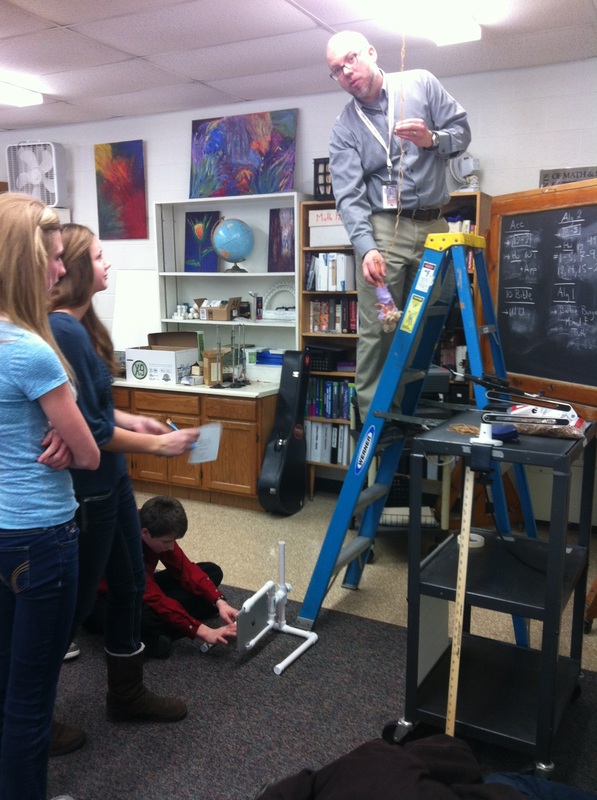
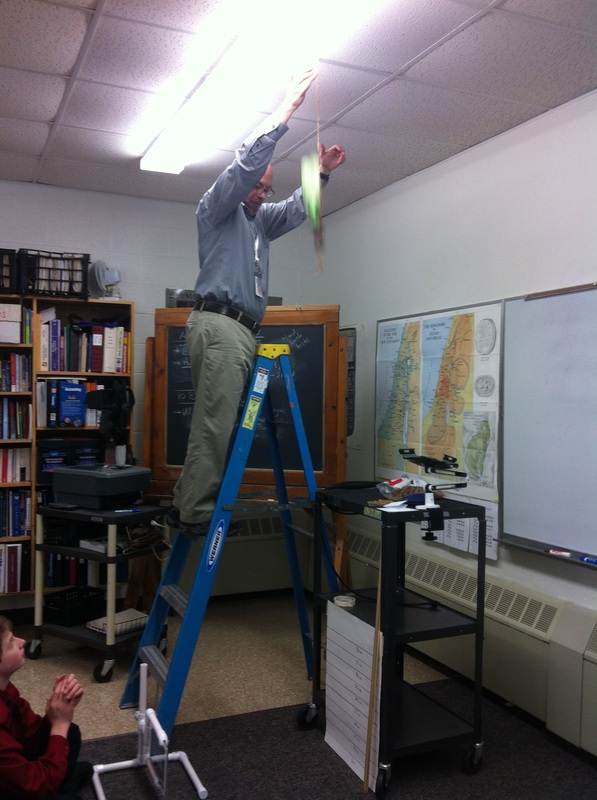
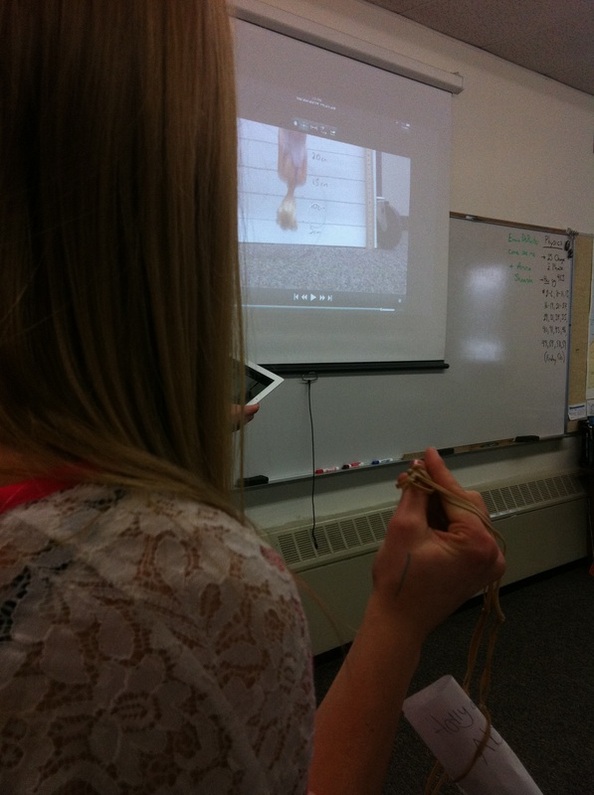
I had enough requests for pictures that I made our 1st Barbie Bungee extravaganza into a video. This last week we ended our focus on linearity in Algebra 1 (finally!). The Barbie Bungee has been around for as long as I've been a teacher (I had conversations with other teachers about it back in 2001). I've never done it before because generally because of my deficit in Barbie dolls. Well, this year I decided I wasn't going to let a little thing like having no Barbies stop me from doing a fun math lesson. I put out an all-call for Barbie dolls, preferably with their clothes (I teach in a Christian school after all). The response? Nothing. Not one doll. It took some doing but I finally convinced my Algebra kids to bring in some kind of figurine to drop. Here's what they came up with. I had a couple of guys not wanting anything to do with Barbie--hello batman and dude from Halo. Day 1: Data collection Gathering data and making inferences is slowly getting better as the year goes on. I guess it really comes as no surprise that the more they do it the better they get. When I do this again next year, I need to make sure they have more time to gather data and make connections. The 20 minutes we had in class after questions on homework, the intro, and gathering supplies wasn't quite enough. I had to break my vow of silence and give suggestions on data collection to a group. Maybe it would be a good idea if your collected more information than simply one drop with all of the rubber bands. No, really. I felt bad, but I did it anyway. I'm on a timeline people: can you say 7 snow days?. Many of the groups looked at the table and found the average rate of change and the y-intercept (both the winners and the runners up did this). One group graphed the points and used the line of best-fit (I love it when they see those connections!). One group doubled their data from 7 rubber bands and saw that it wasn't enough and then tripled it. They saw that it was too much so they found the average stretch per rubber band and then took away as many rubber bands as it took to get under the height from the floor to the hook in the ceiling (282.5 cm). Novel but unfruitful. They didn't take into consideration Barbie's initial height so they ended up being pretty high off the ground when all was said and done. Day 2: The moment of truth. I used a hook attached to the ceiling as the starting point for out plastic daredevils. Then we used the iPad and the Apple TV to video and show the happenings up on the screen. The video came in handy several times for the "instant replay" feature (see below). We had a hair's difference between first and second place. Our winning group had the photo finish above right. Their Barbie's hair just touched the ground but not her little noggin. We all agreed if you got twigs in your hair on a bungee jump and didn't die, that might just be the best bungee jump ever.
All in all, this was a great project to end our study of linearity in Algebra 1. |
Andrew Busch
I teach Math at Ralston Valley High School in Arvada, CO. Categories
All
Archives
March 2019
|
|||||||||||||||||||||||||||||||||||||||
 RSS Feed


