|
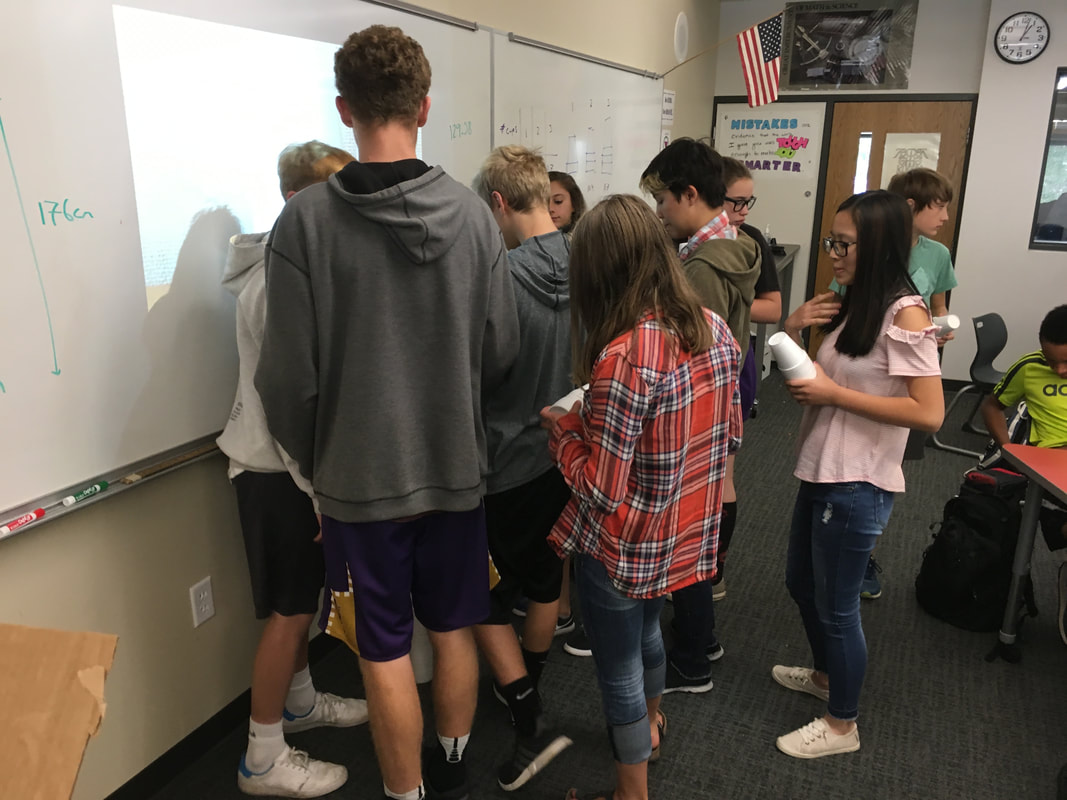
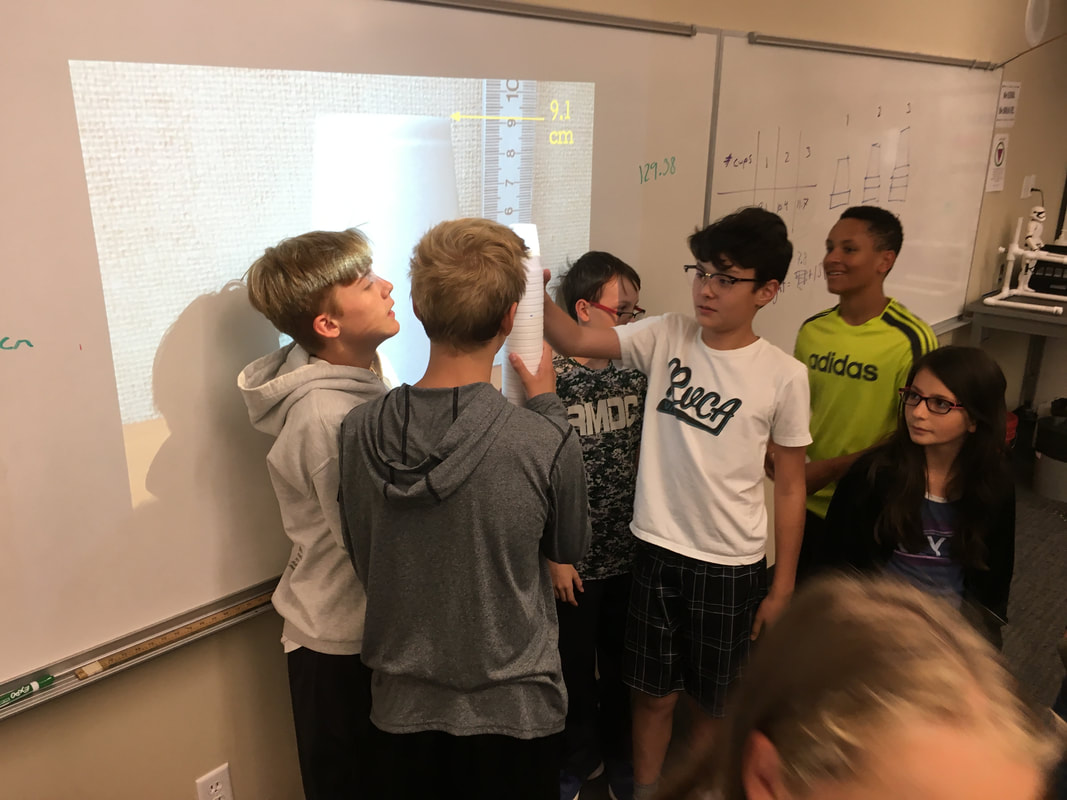
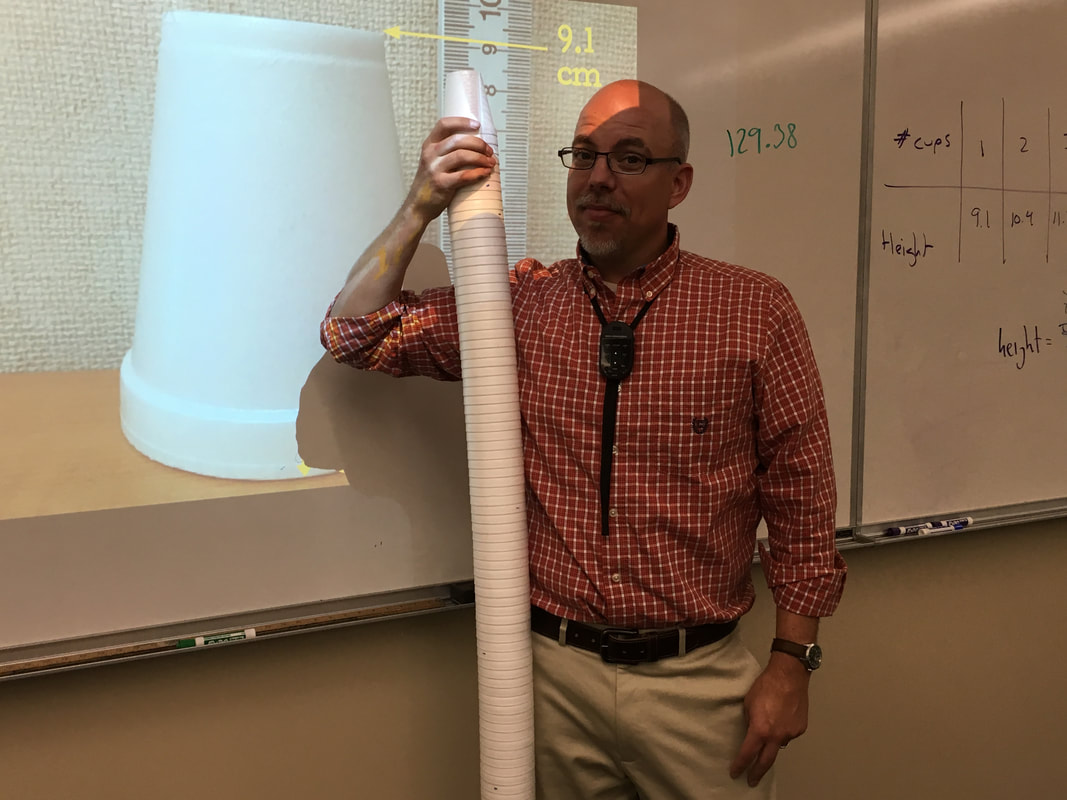
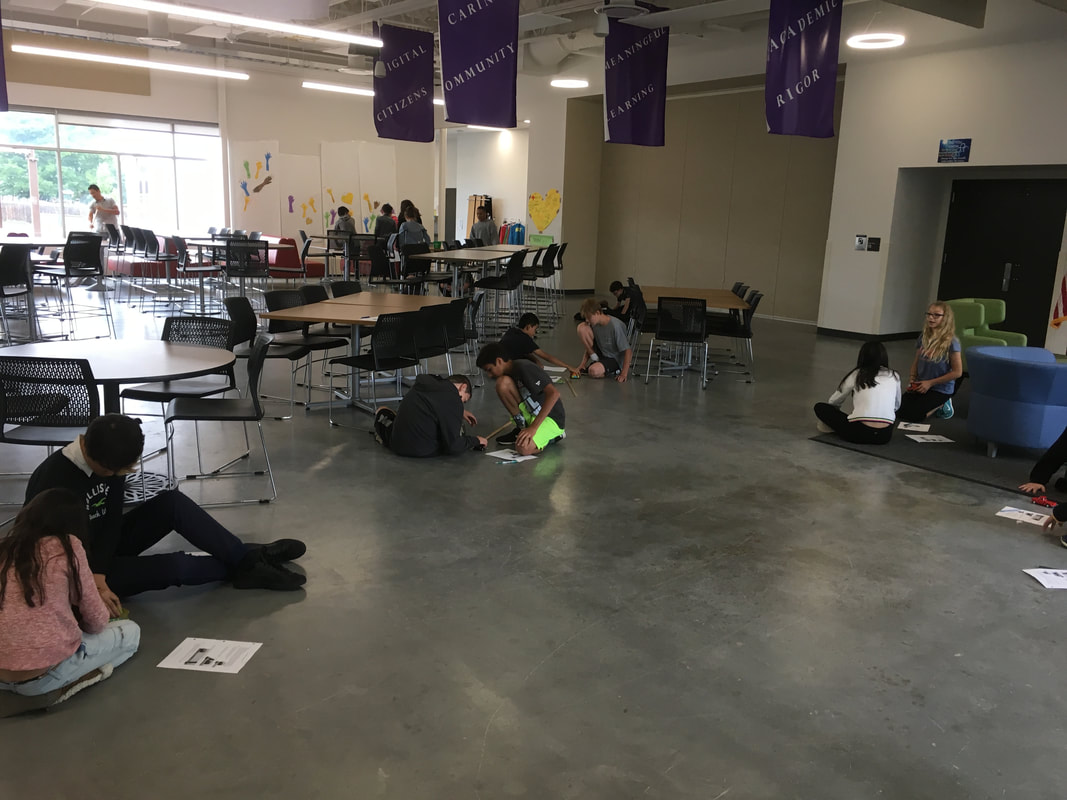
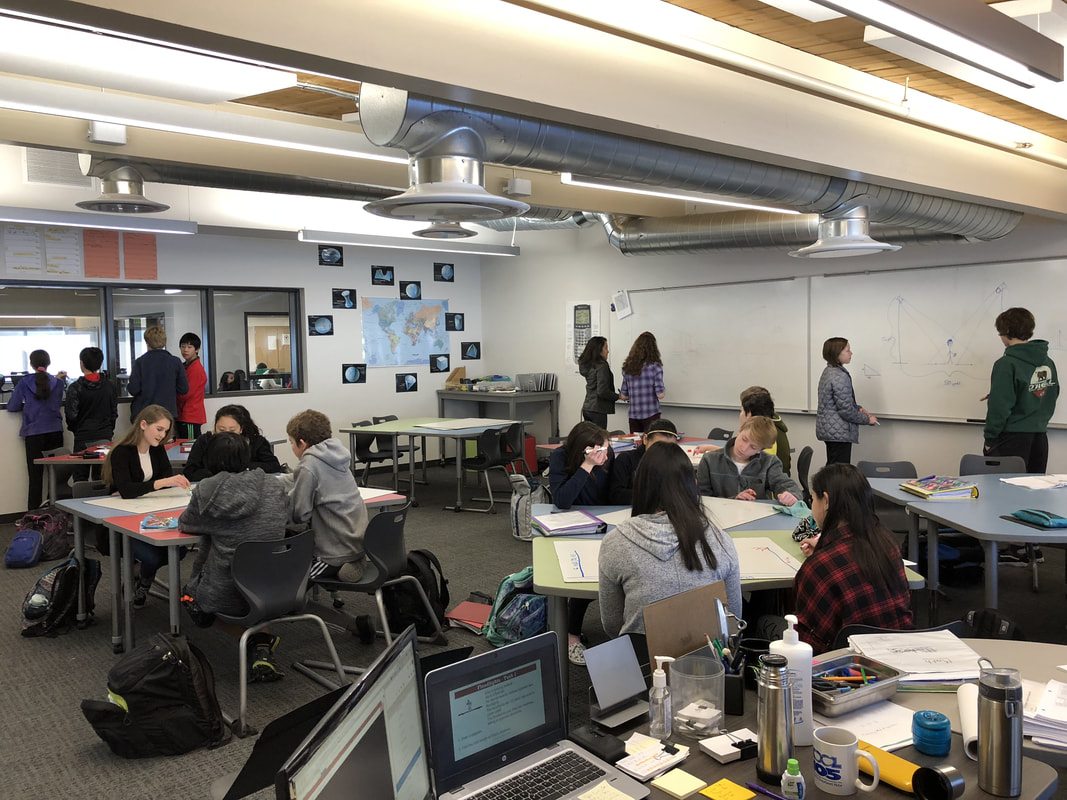
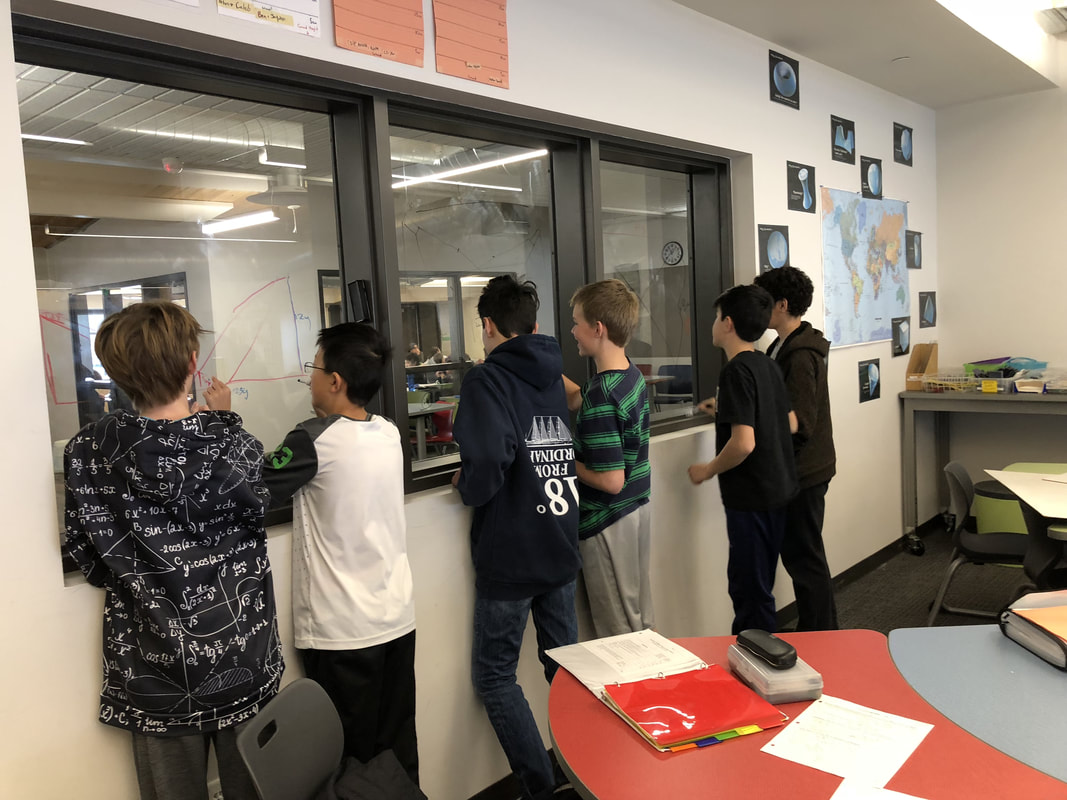
We just finished up our circles unit in Geometry. I had one more day before a long weekend. Rather than jumping into something new, we did a little bit of math art a la Desmos. I gave them a quick directions document with some review of families of functions they might want to explore. Then I set them loose. I gave students a choice whether or not they wanted to work on their drawings after the class period ended. That was not the assignment. Some students decided to go all out! Are you ready? I don't think you're ready. BTW, I linked the pictures to the actual Desmos pages. You're welcome! 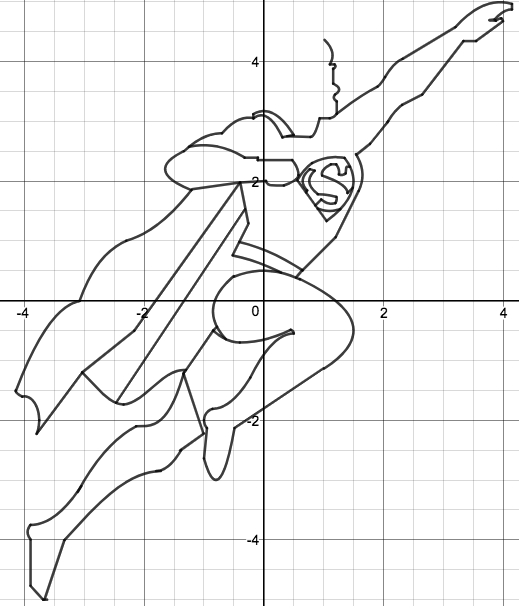 The moon revolves around the planet in this one! 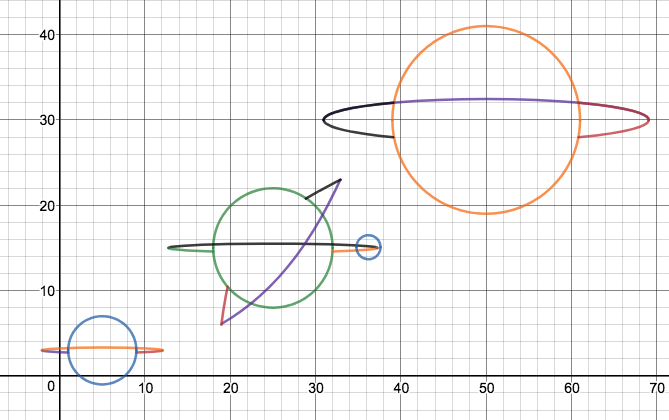 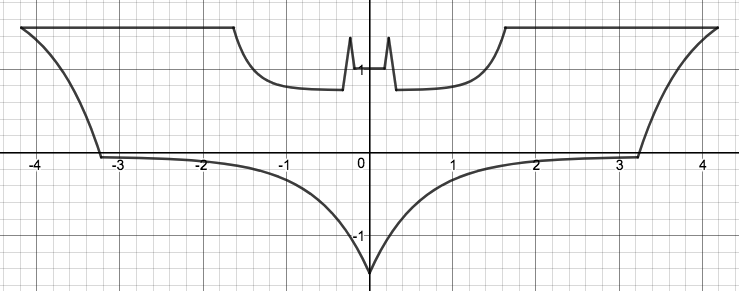 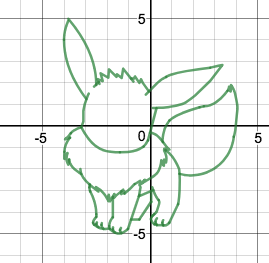 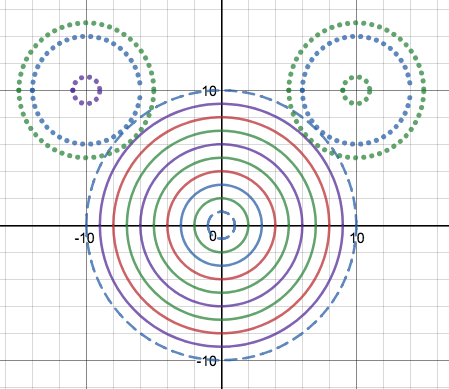 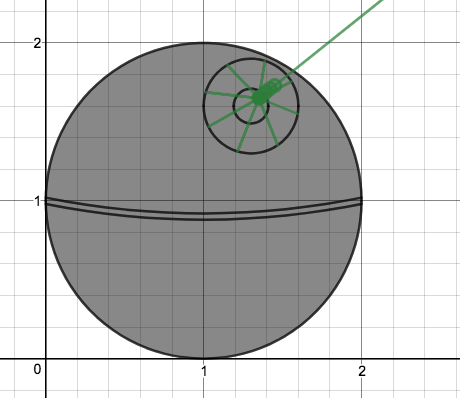 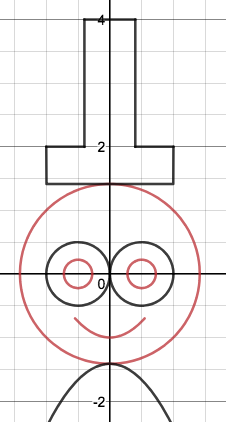 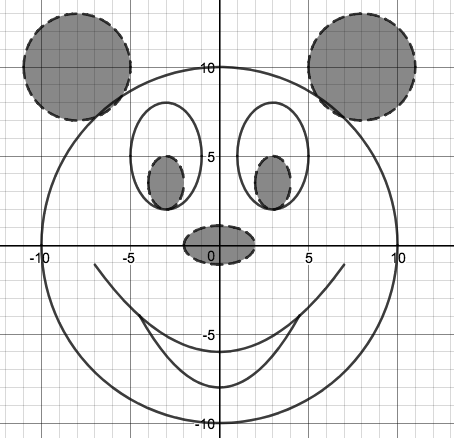 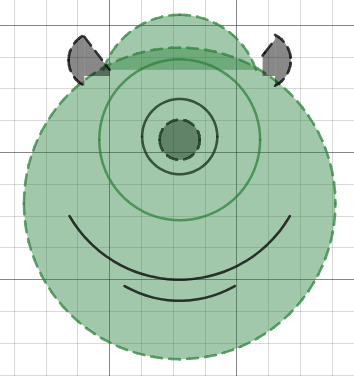 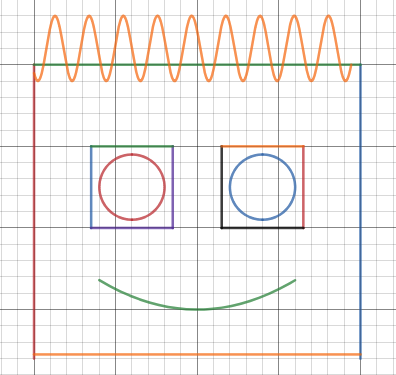 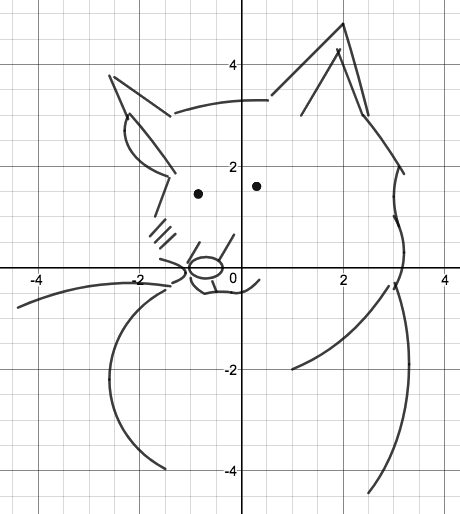 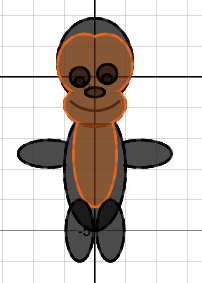 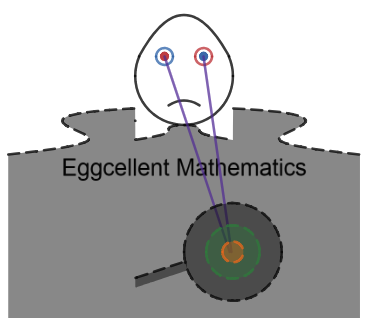 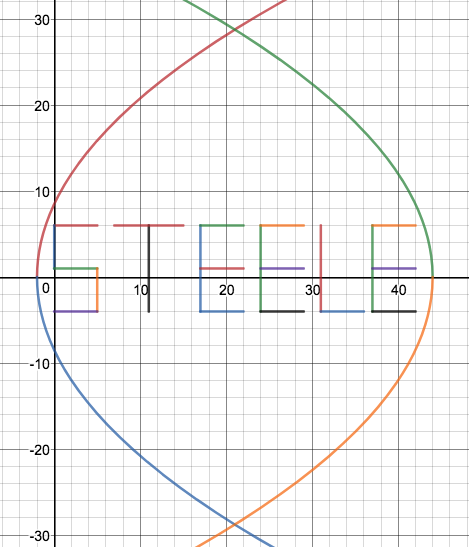 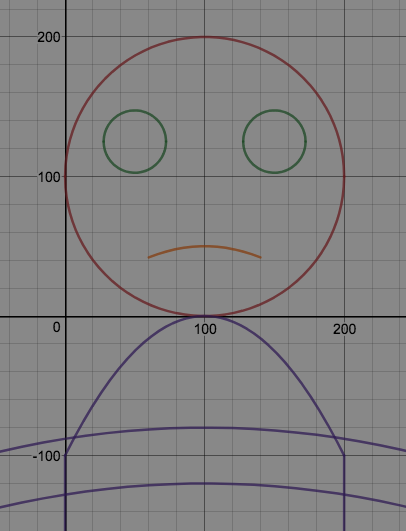 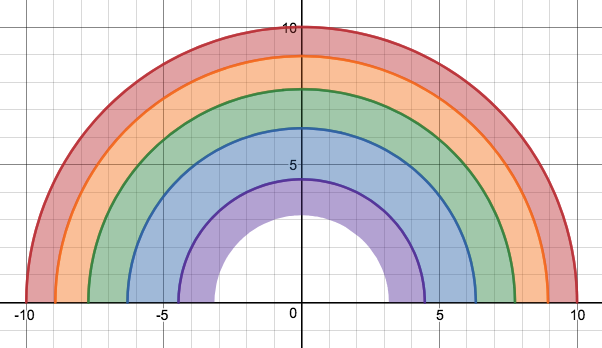 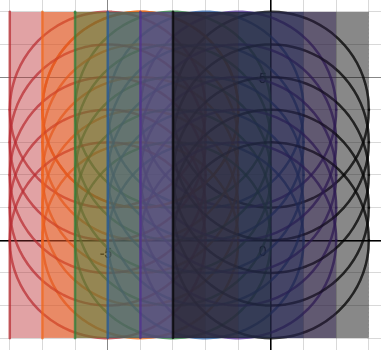 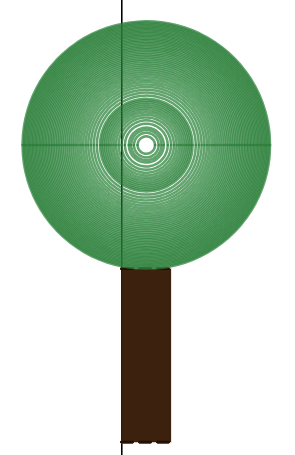 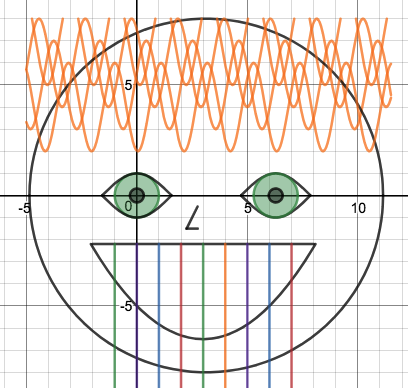 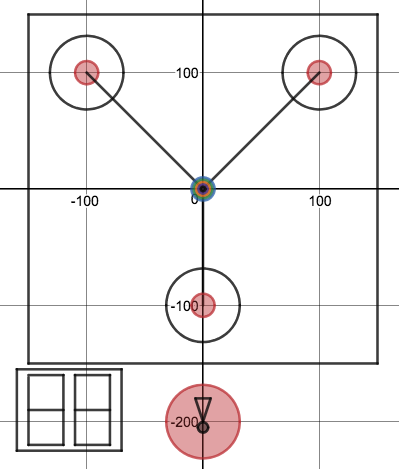 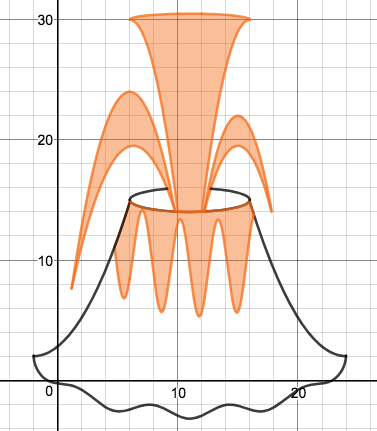 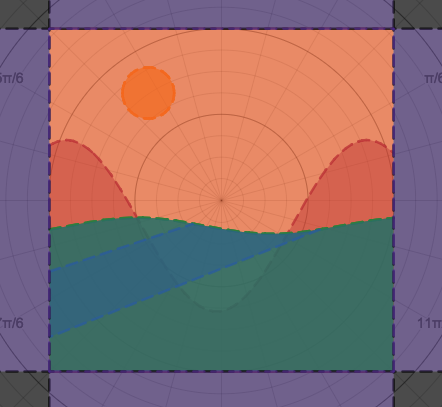 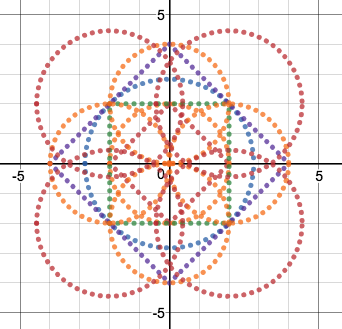 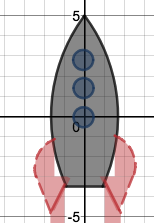 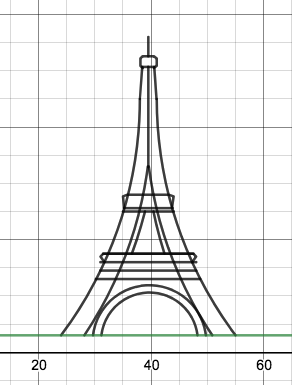 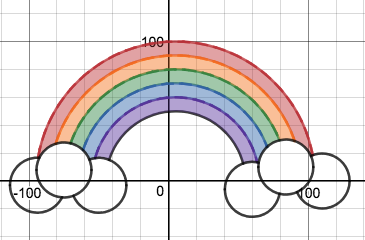 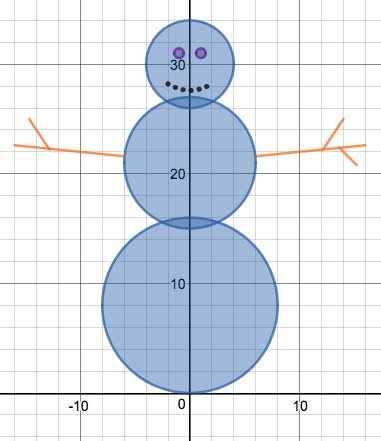 I base all of the trigonometric functions/ratios in the unit circle. We use this activity as an anchor for our future discussions about all sorts of things: the graph of sine and cosine, how we create triangles within the circle, and even sine being the distance from the x-axis and cosine the distance from the y-axis. I overheard multiple conversations between students who noticed the rate of change both sped up and slowed down. They were convinced they were doing it wrong. That's the kind of dissonance I'm looking for! Here is a complete write up of the lesson. I didn't do a very good job posting about activities as I did them this year. I'm working through a new Algebra 1 curriculum (I'm not impressed with it) and I'm trying to rethink how I do formative assessment. My activities aren't changing much this year, the amount of time we spend doing activities and experiments feels about right. I guess that's a good thing. Here's an activity we do at the beginning of our unit on linearity: cup stacking. I took this idea hook line and sinker from Dan Meyer and Andrew Stadel. Rather than do this as a 3 ACT lesson, I use it as a chance to get students out of their seats and talking to one another.
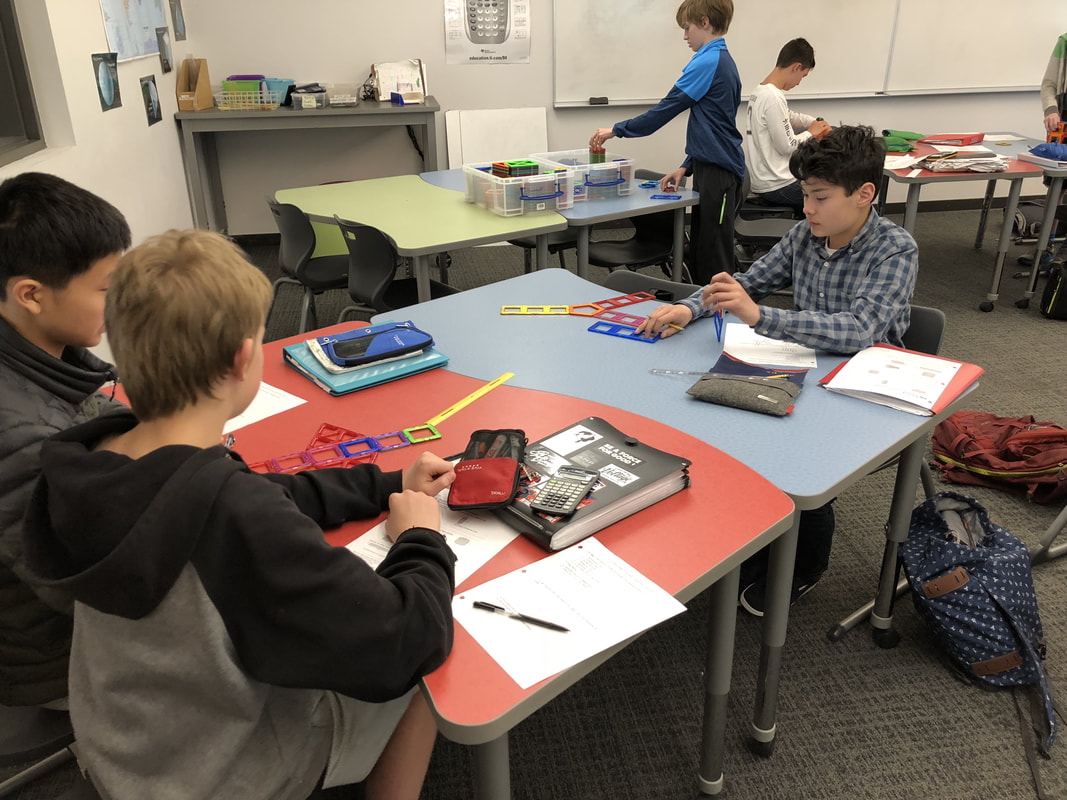
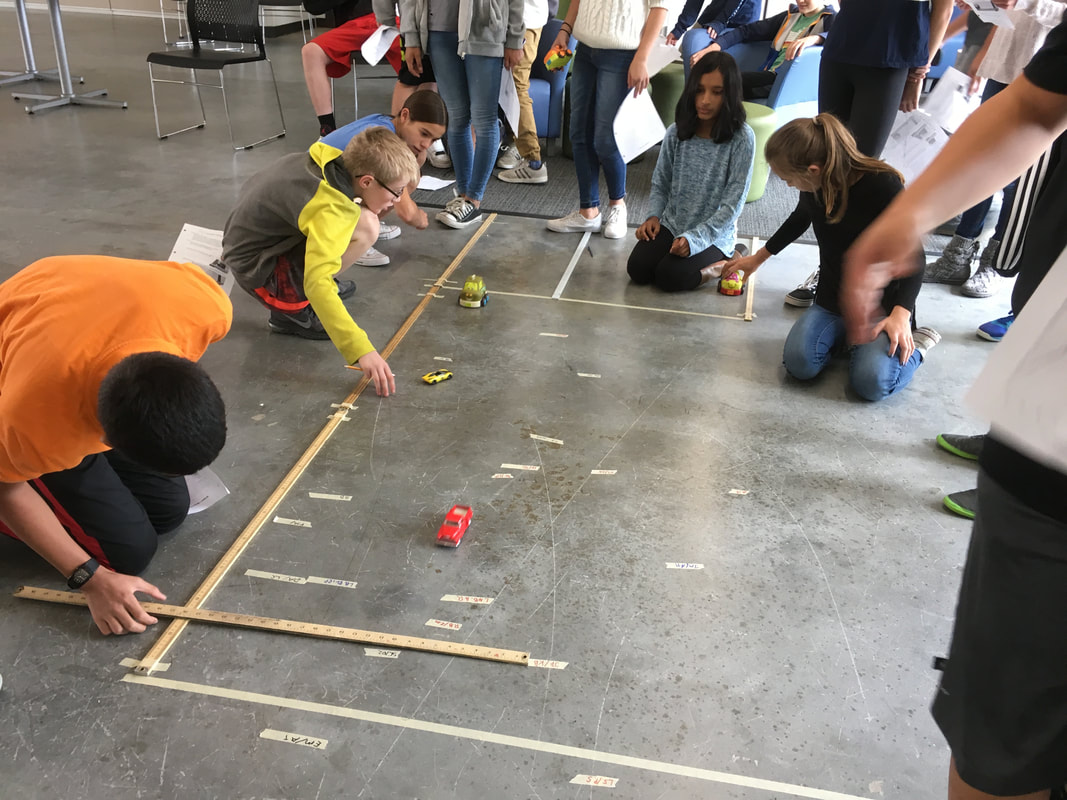
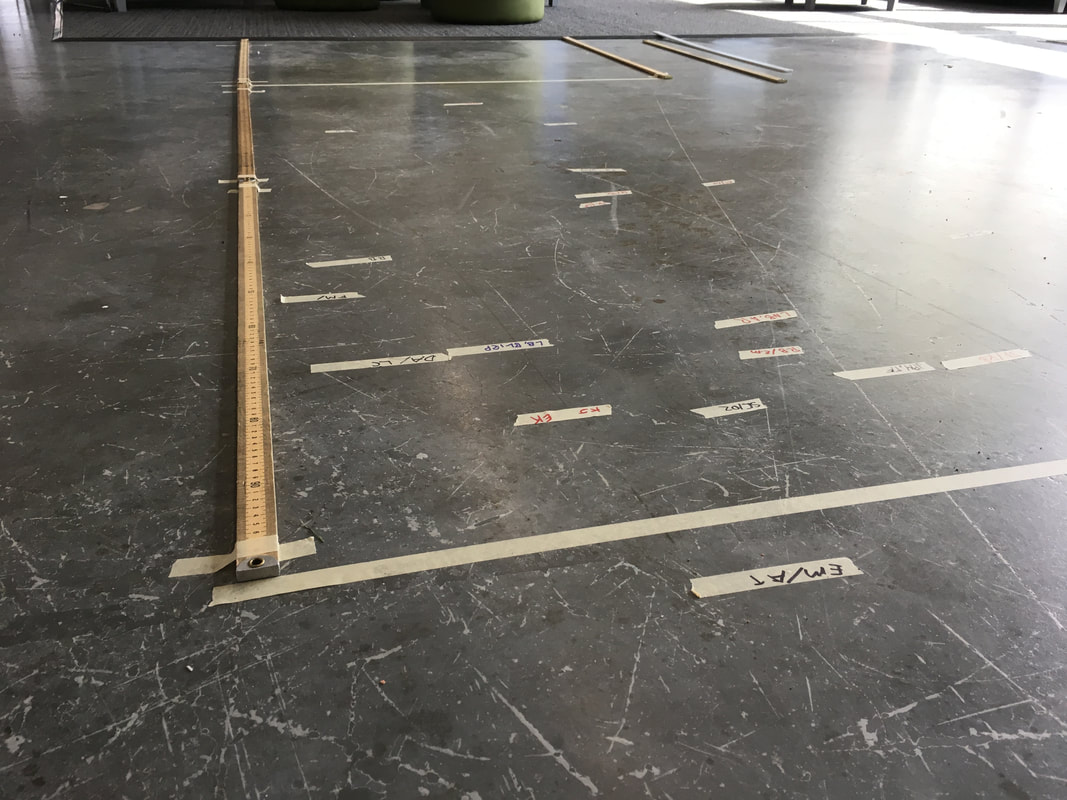
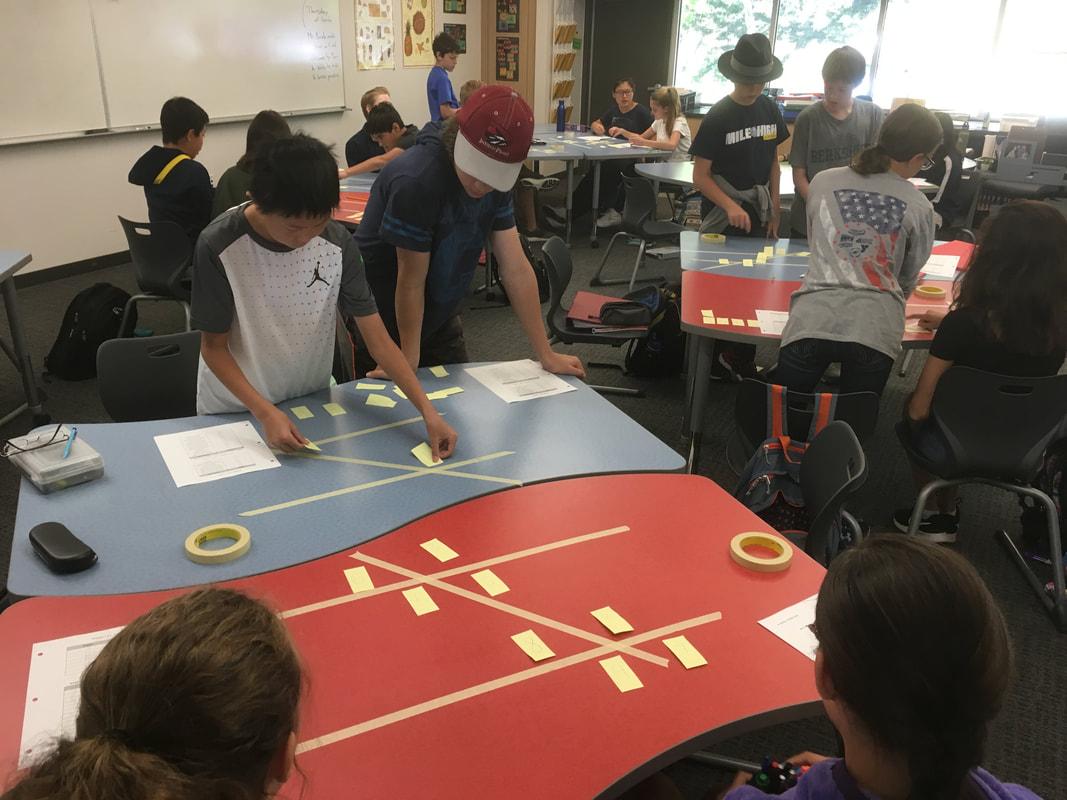
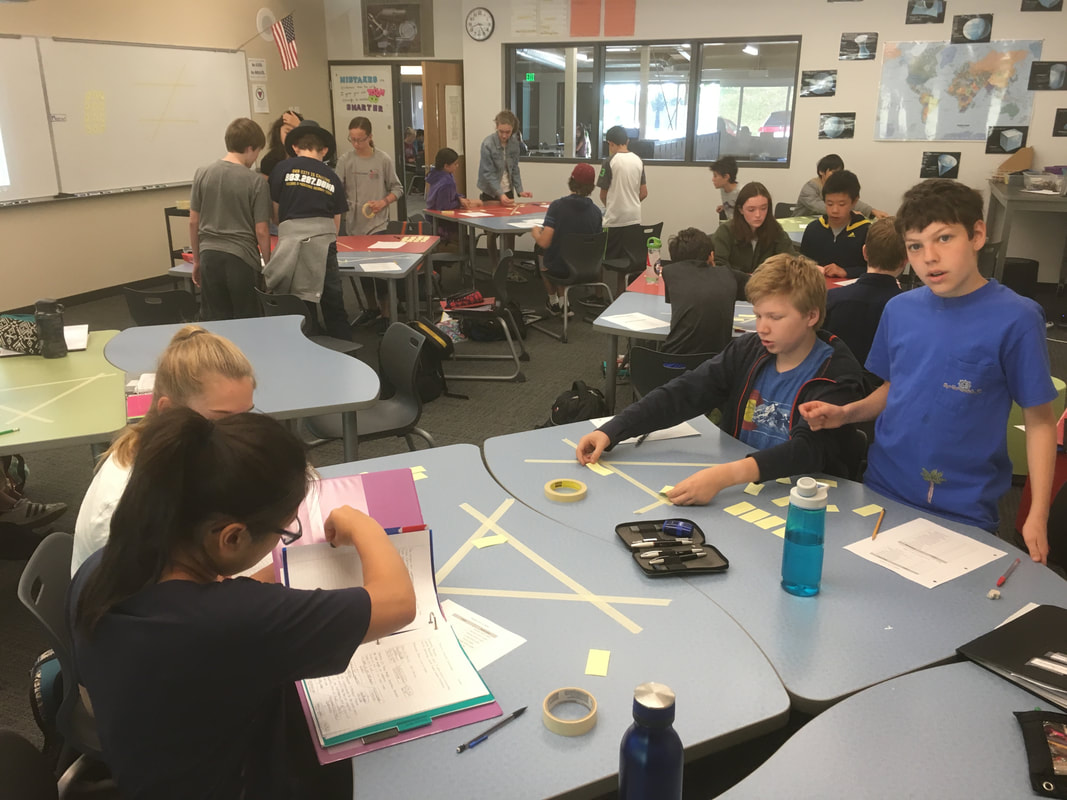
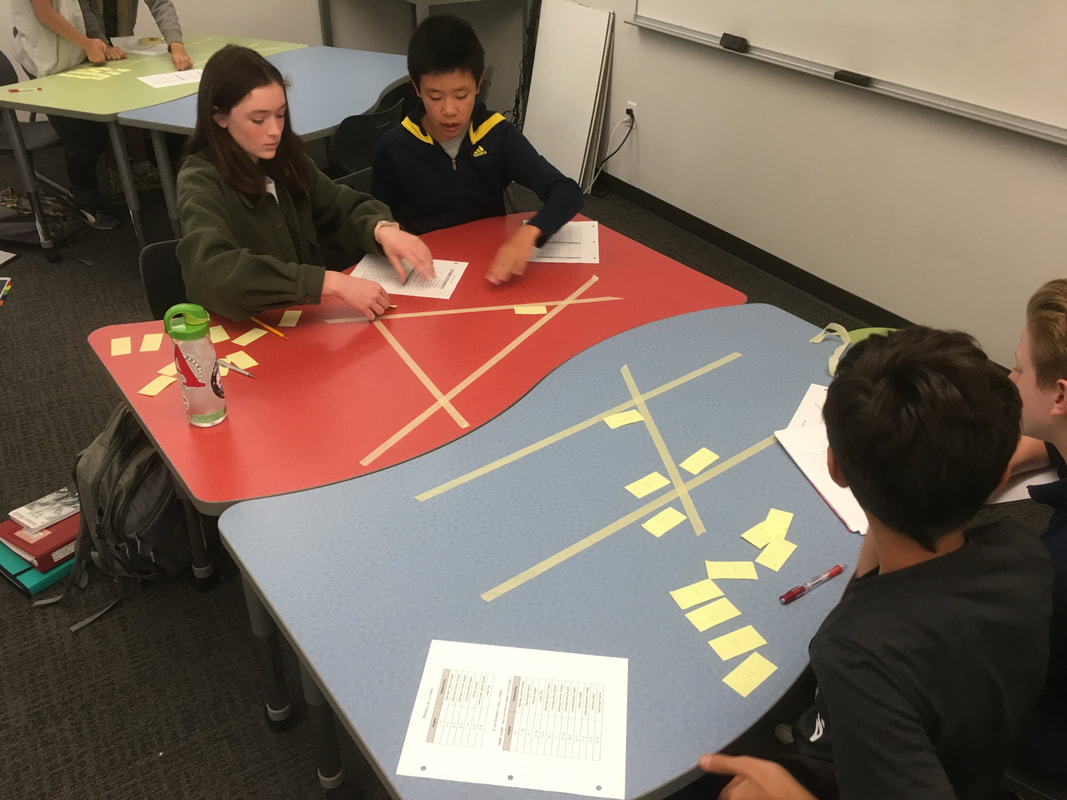
We begin by giving 5 styrofoam cups to every pair of students. Then I show a picture of me getting my height measured at my doctor's office (in cm). They have to figure out how many cups tall I am. We also almost always need to come to an agreement about how to measure the cups. Quick setup and clean up and almost complete engagement. You can't ask for much more than that. This activity helps students solidify their understanding of the new vocabulary identifying the angles created by a transversal between two lines. To make it a wee-bit more interesting, we also look at transversals across non-parallel lines. 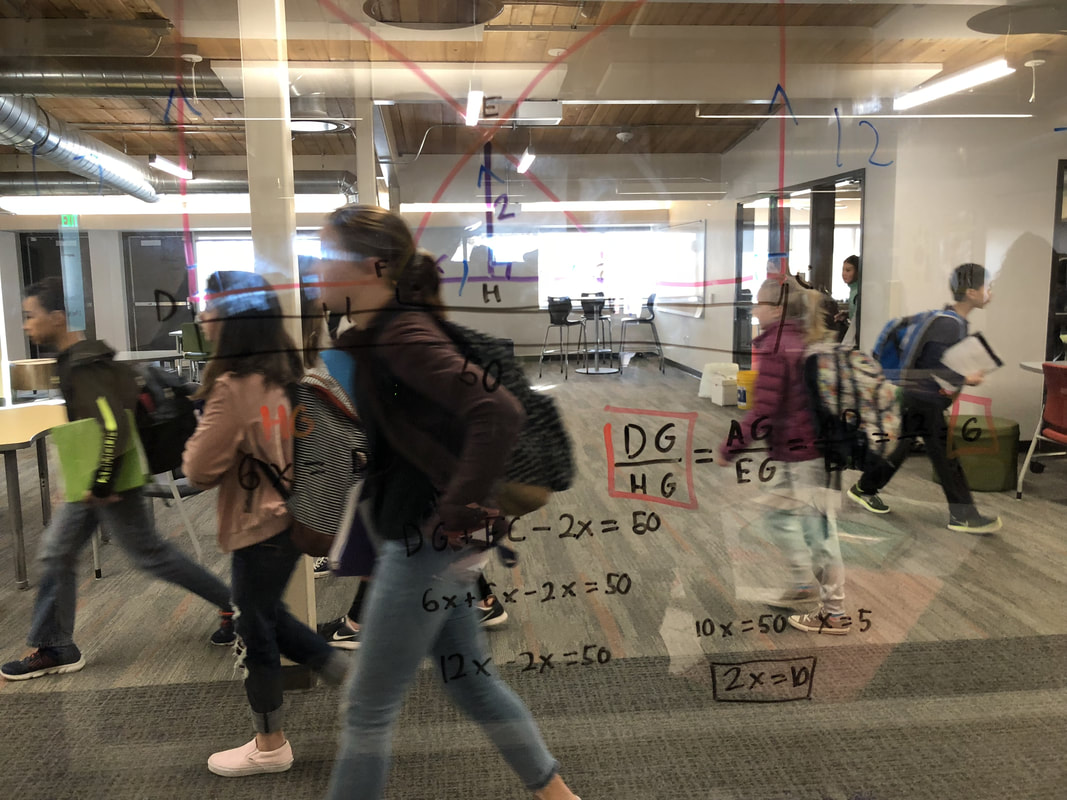 I spent some time searching for a card matching exercise for exponential functions. I found a couple but none that did exactly what I wanted them to do. Rather than spending an hour searching for what I wanted, I spent an hour and made it. Although, to be real, I'm not sure what I made is what I wanted either. I plan to use it early next week. Students match percent growth and percent decay equations, graphs, descriptions, and tables. Not every function has a description or a table. I thought I'd cut down on the process of elimination solution method. I also included some function forms students would probably not be familiar with yet but I would like them to take a stab at looking at the form of the function and guessing what the matching graph might be like. I've included the files as both a pdf and word doc.
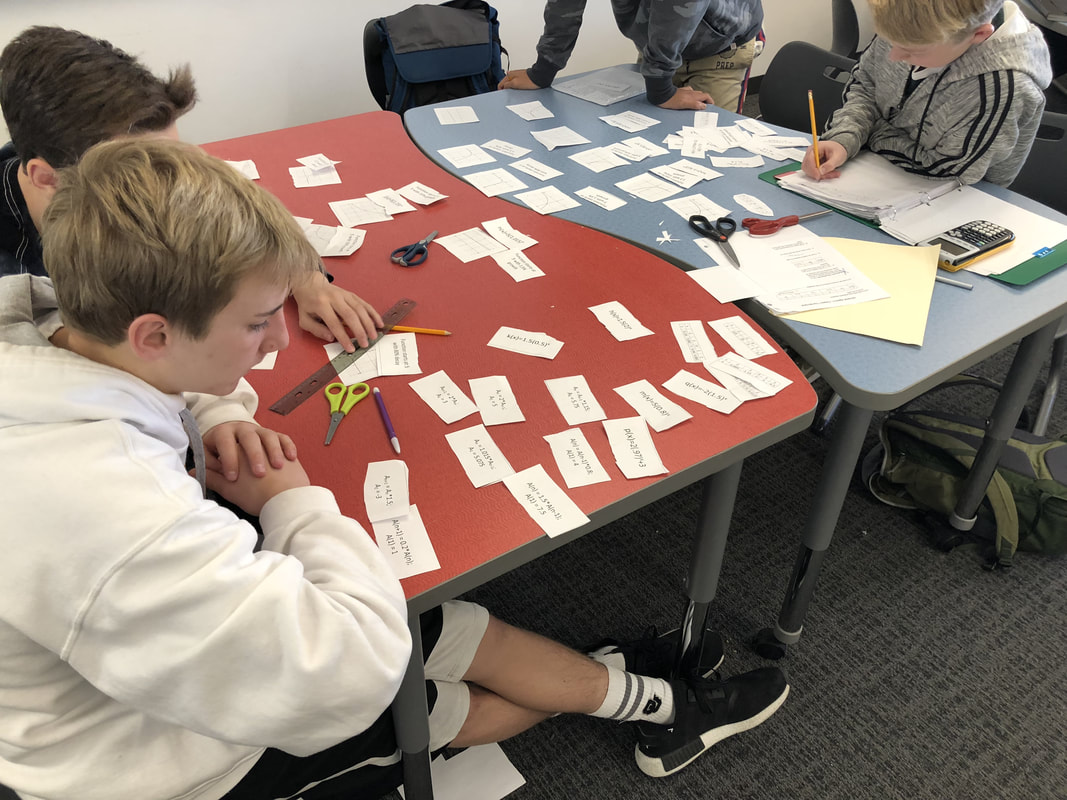 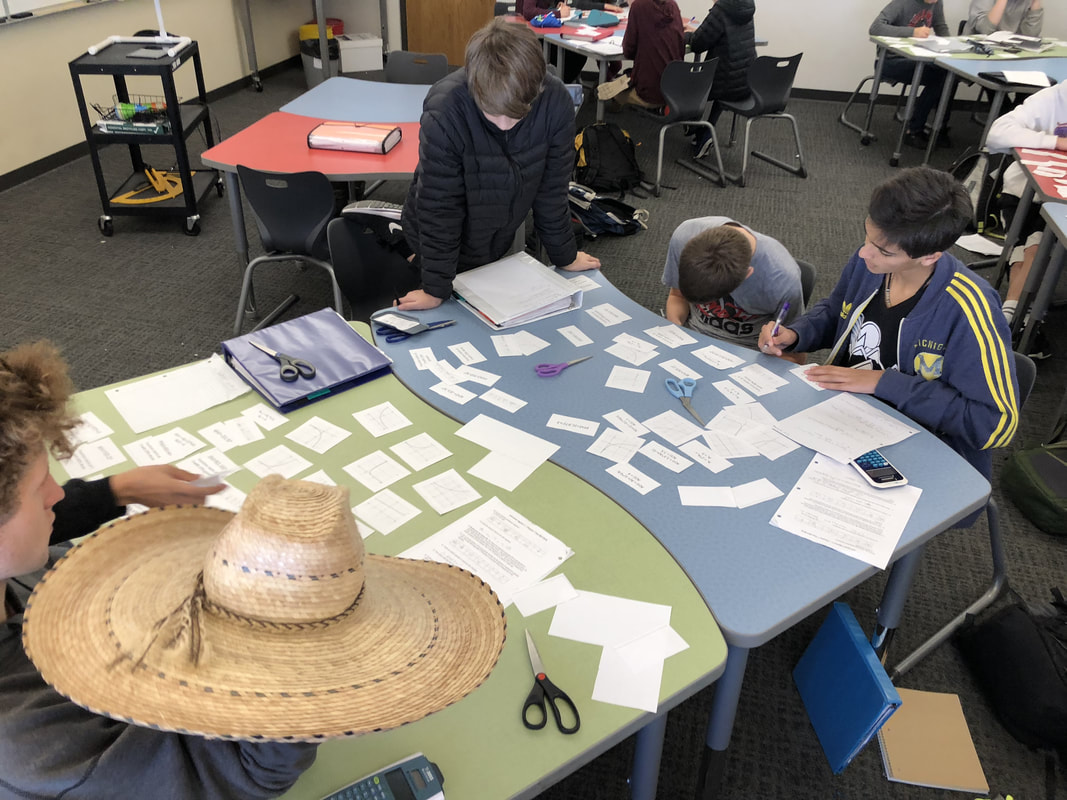 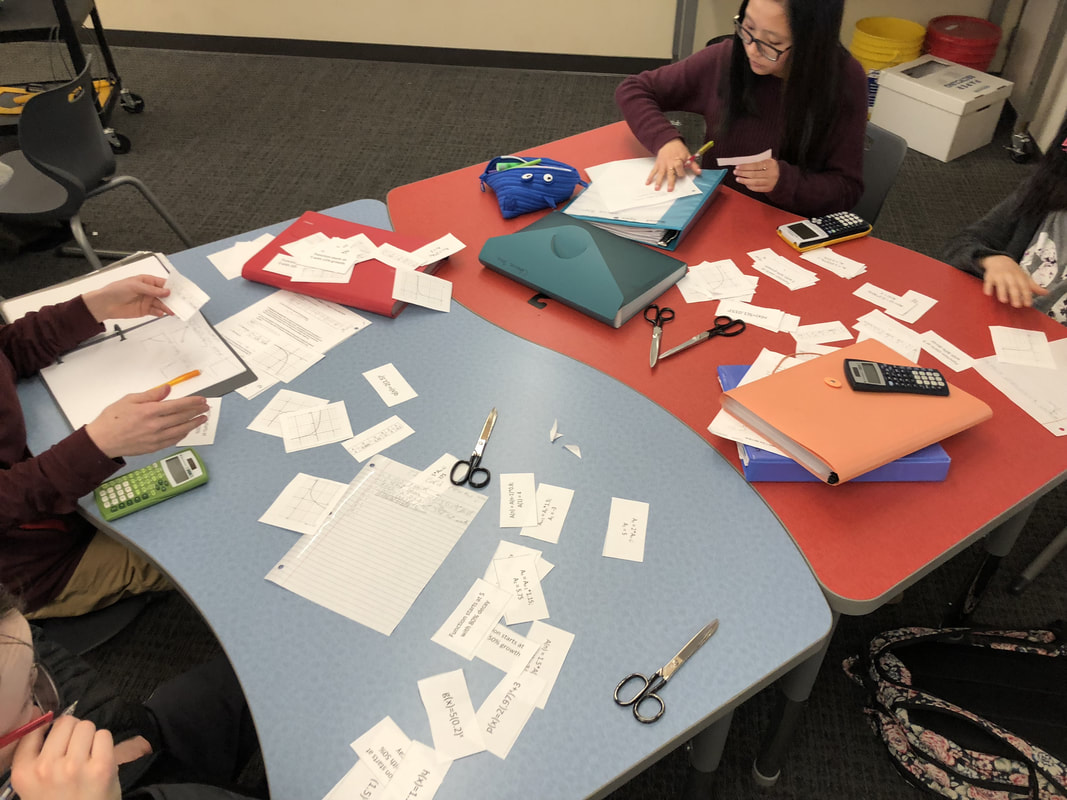 Update: I added an extra page with recursive definitions of most of the functions... just in case you want to add the extra step of complexity!
A few years ago I started introducing trigonometry using circles. It started in Algebra 2 and moved down into Geometry. By basing all trig off the unit circle, we make an easy transition from Geometry trig (finding missing sides and angles of triangles) to Algebra 2 trig (sine and cosine functions and transformations). After a couple of years, I'm never going back.
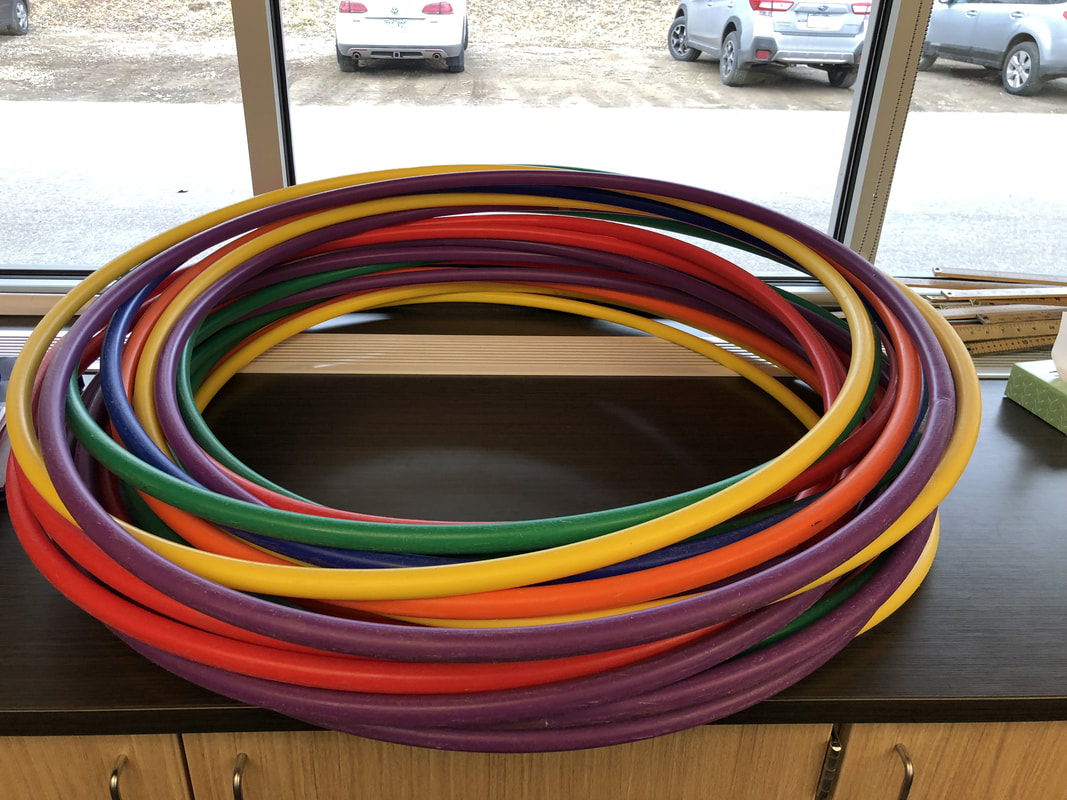
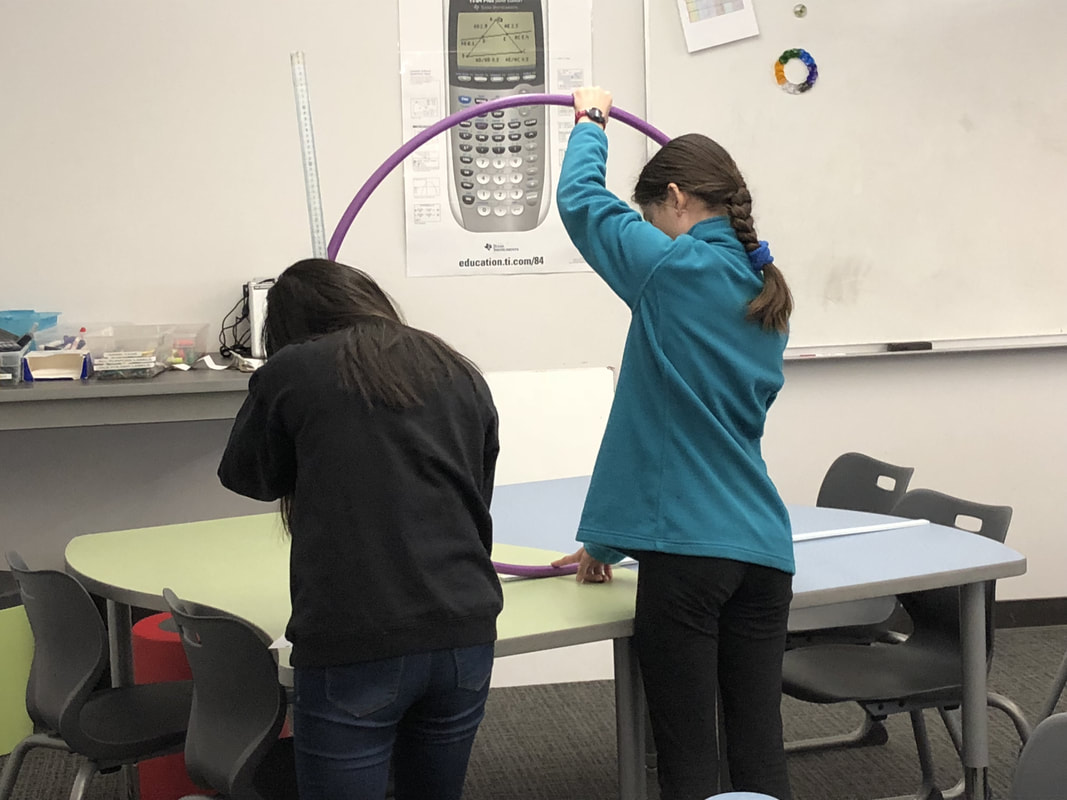
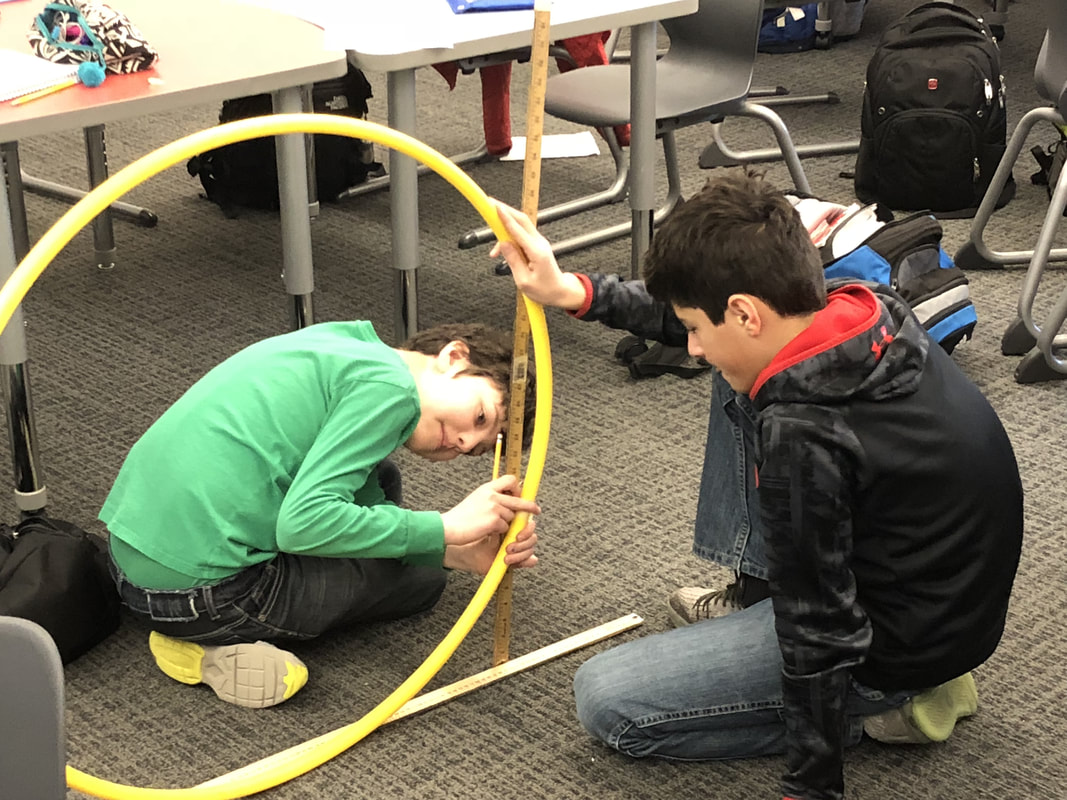
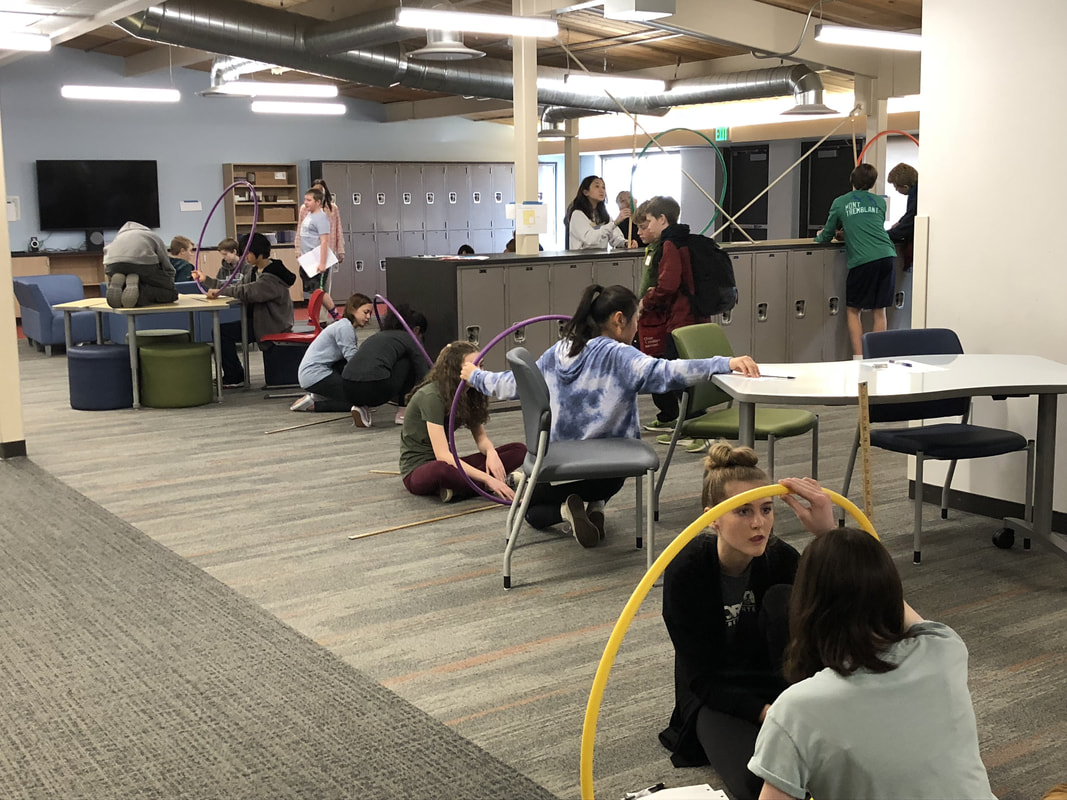
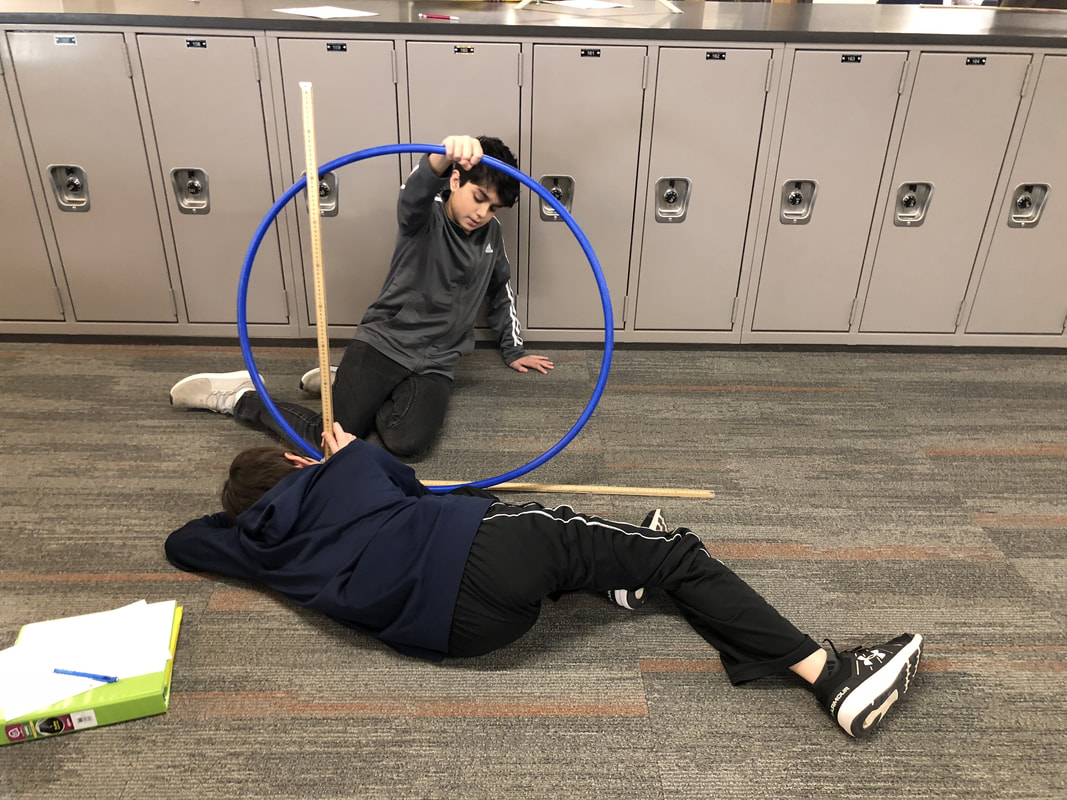
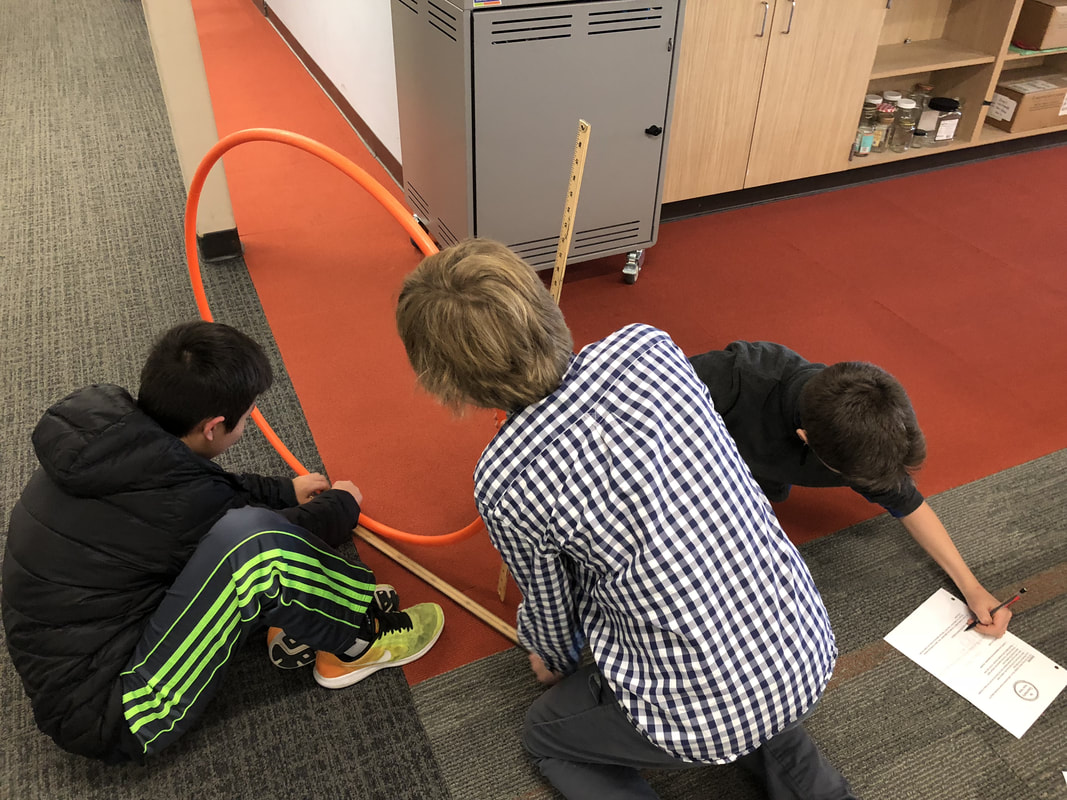
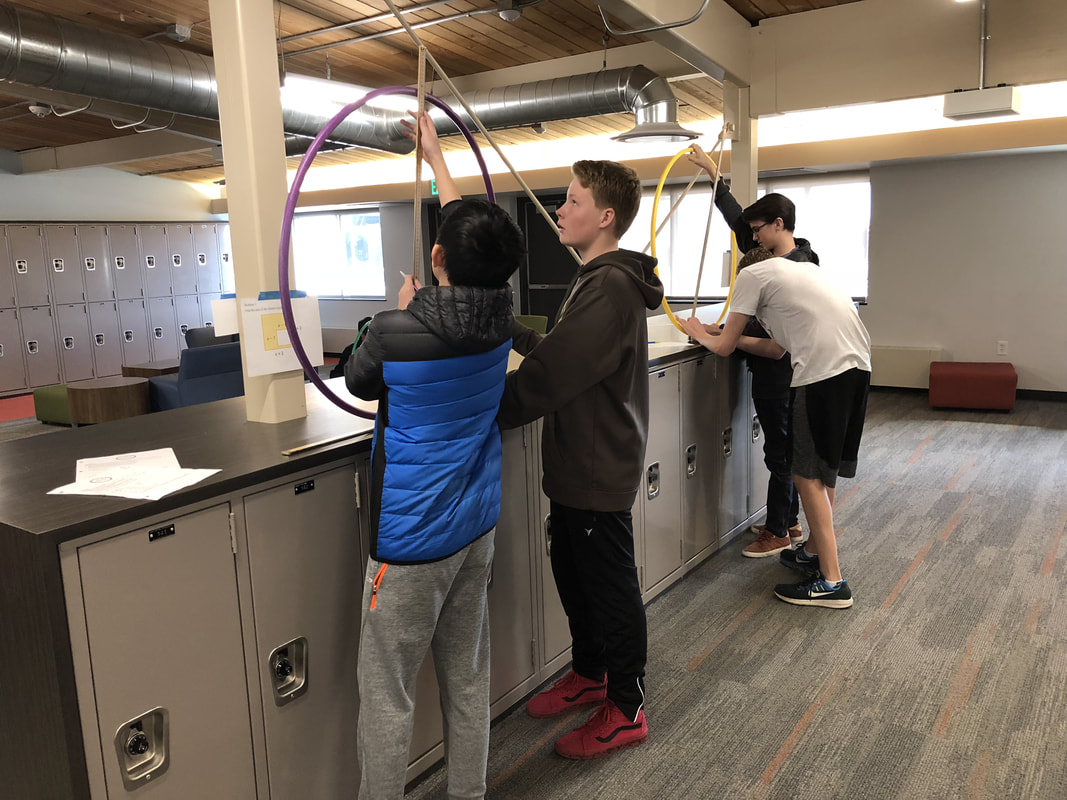
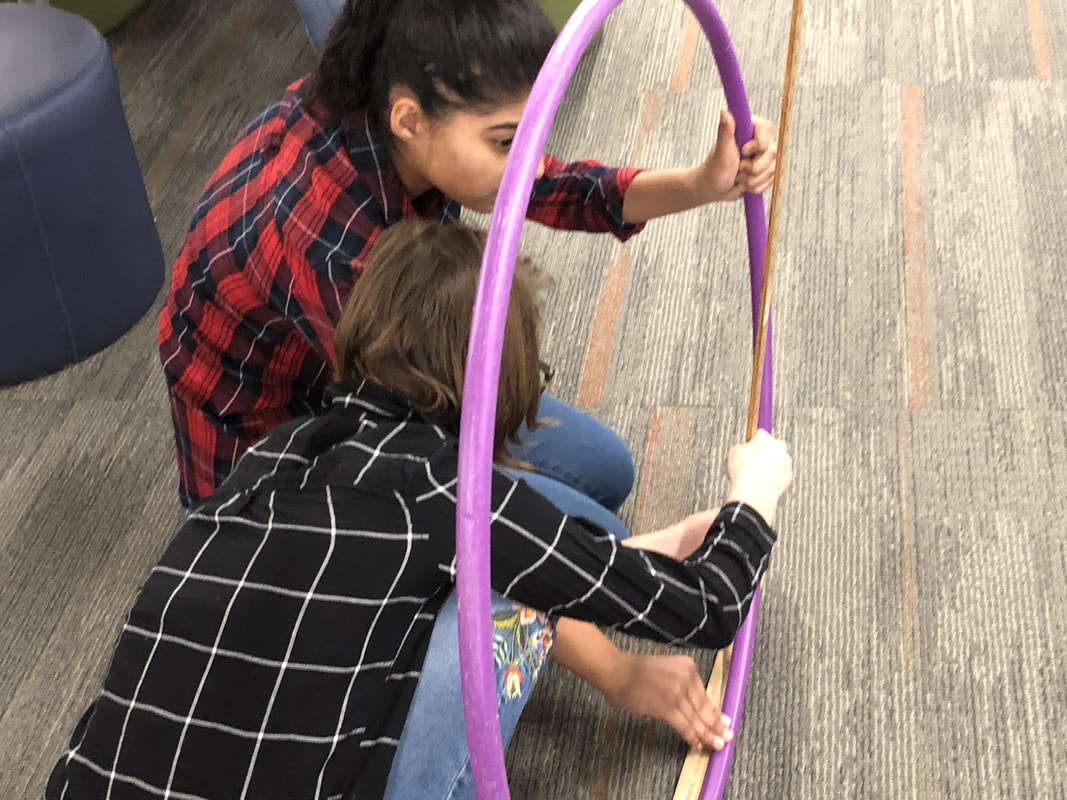
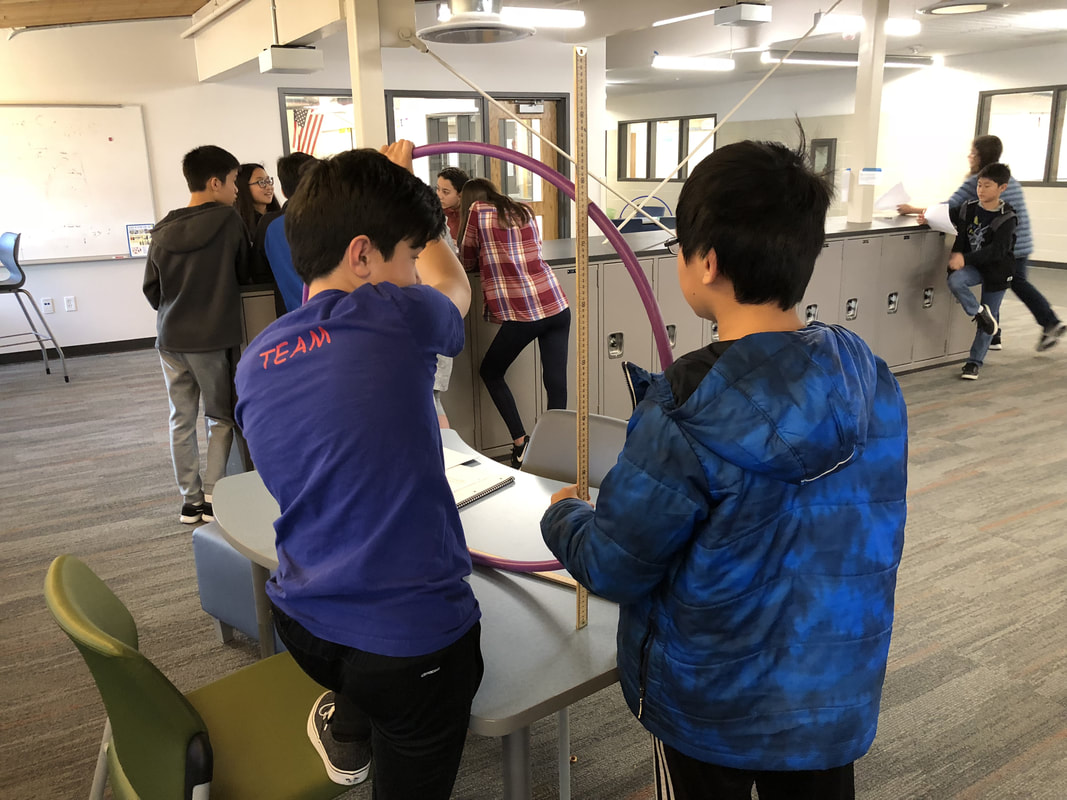
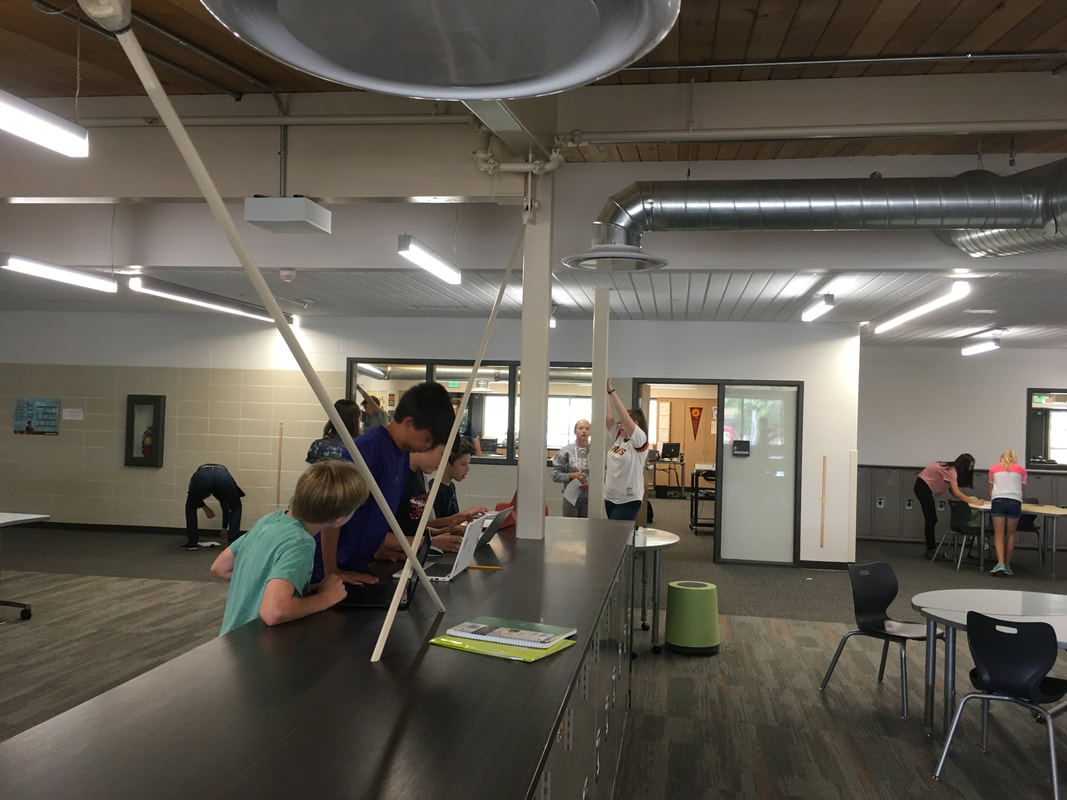
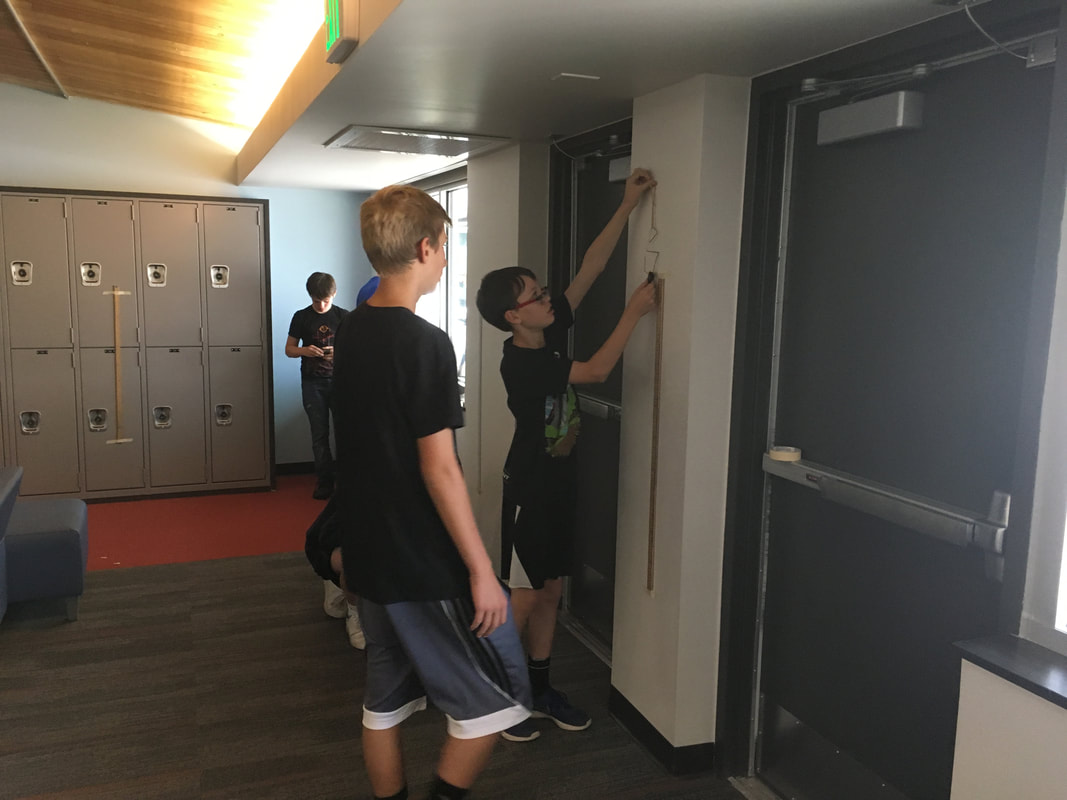
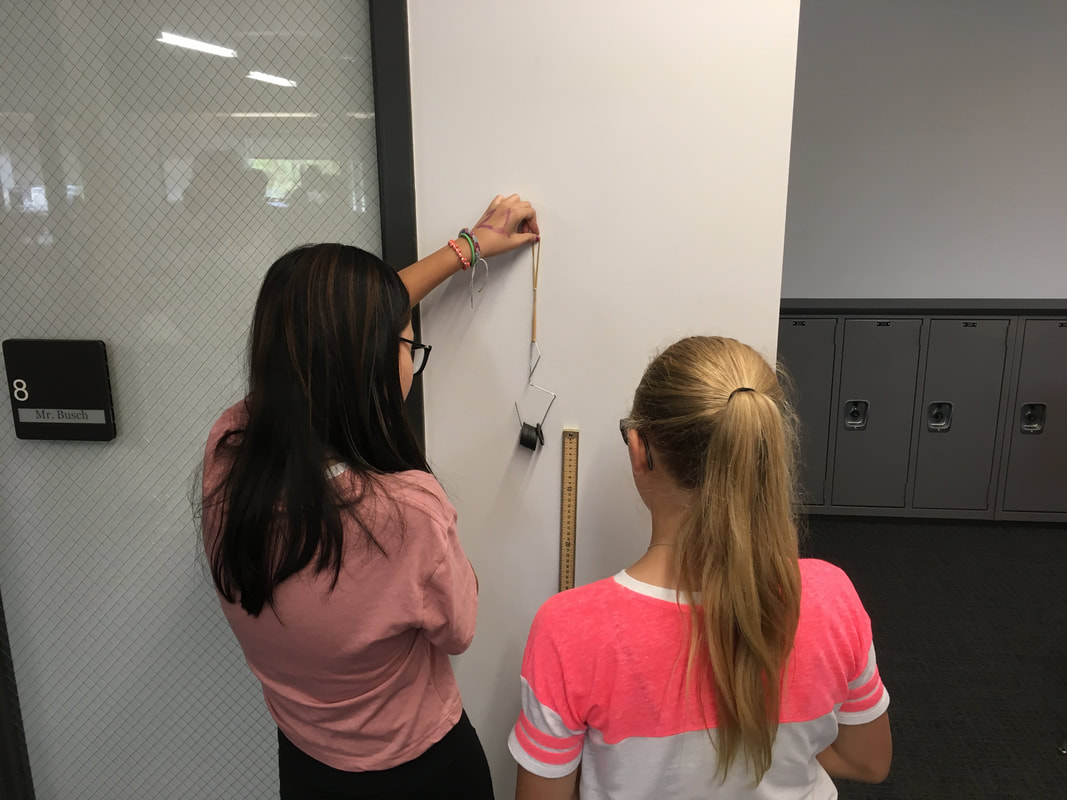
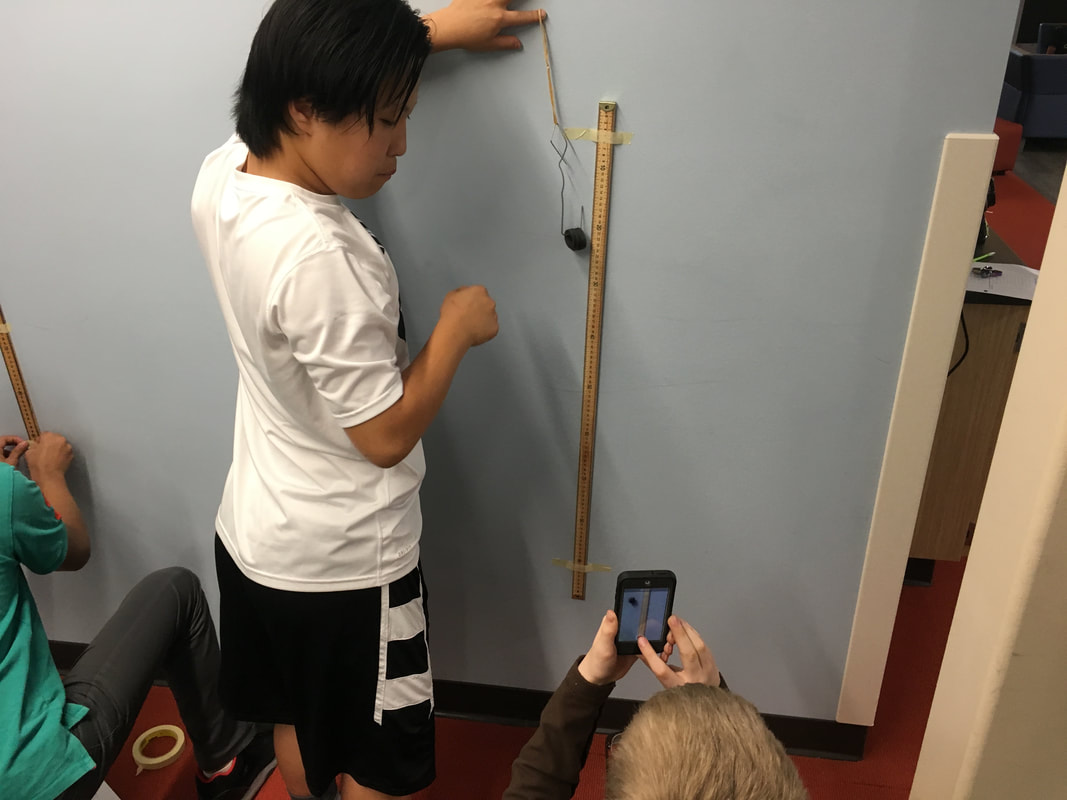
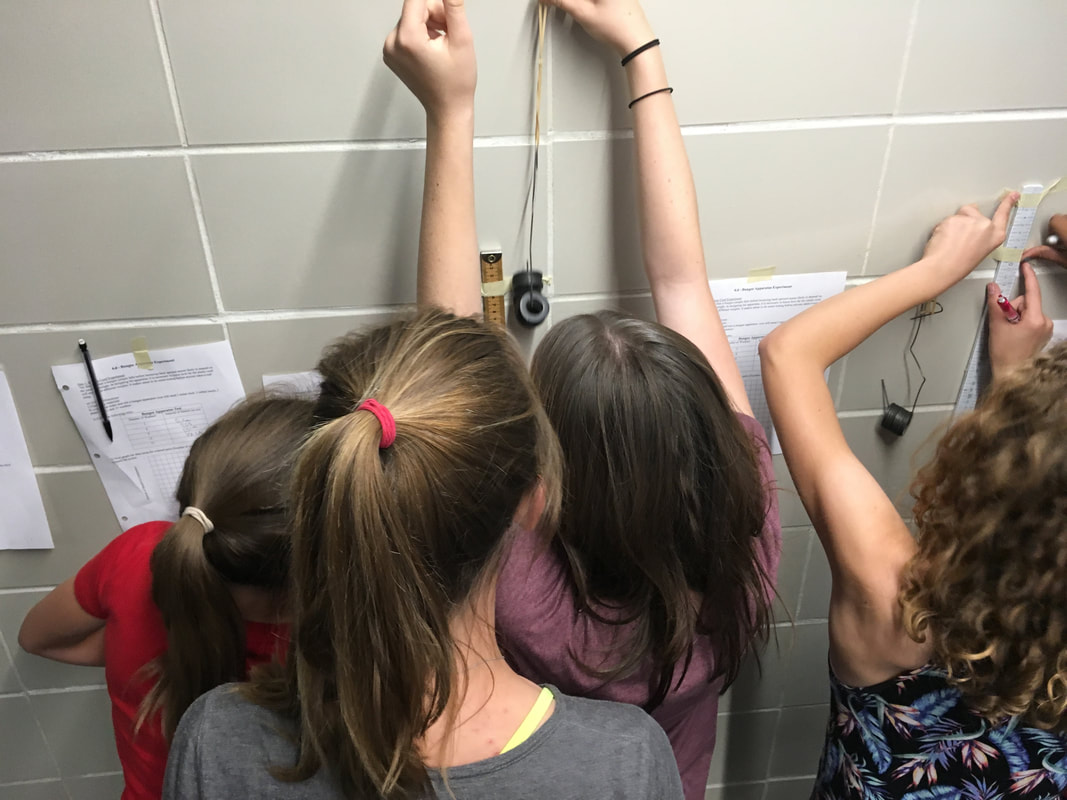
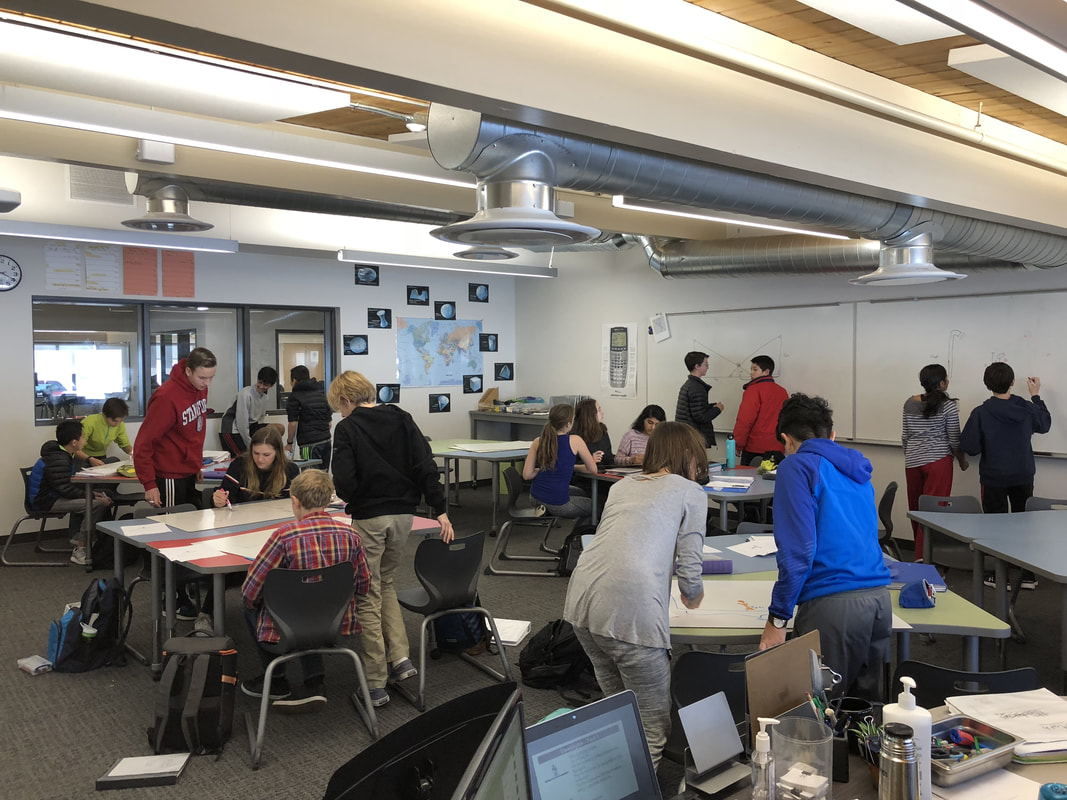
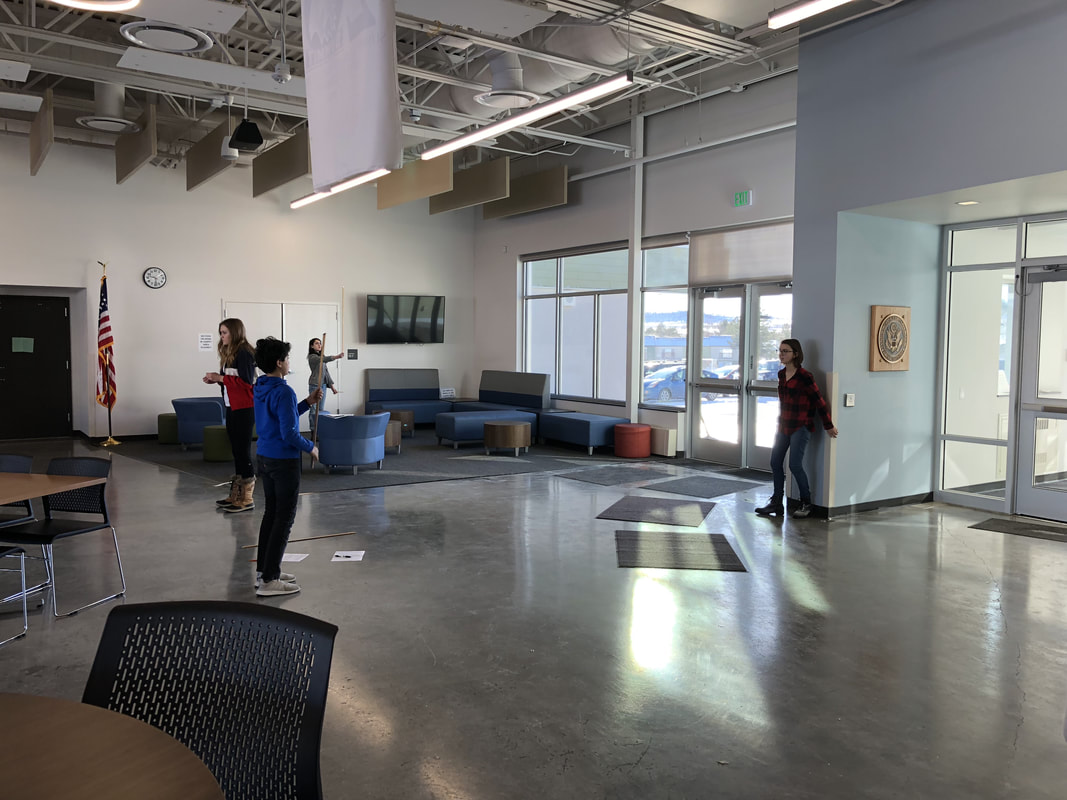
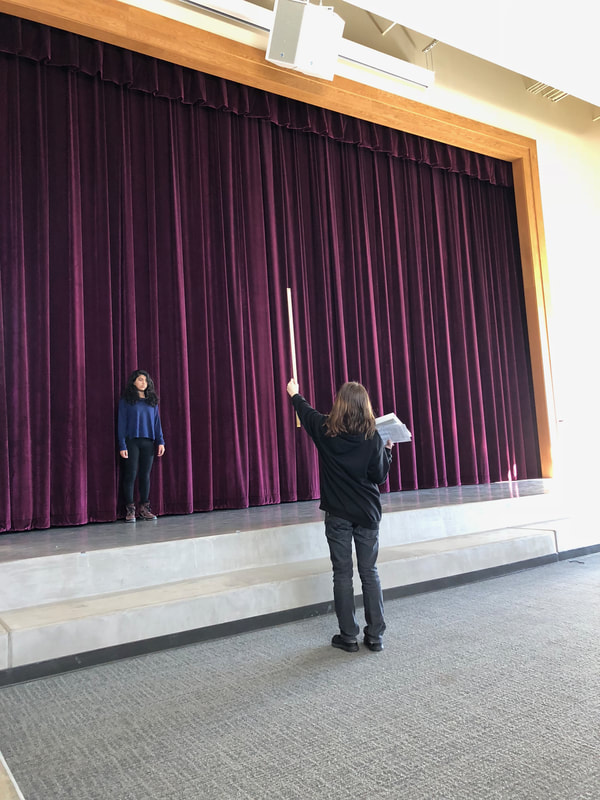
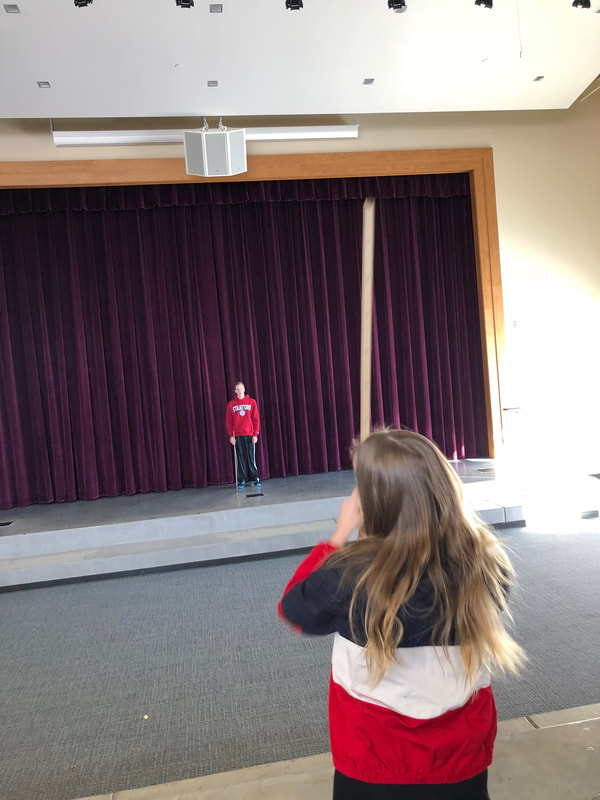
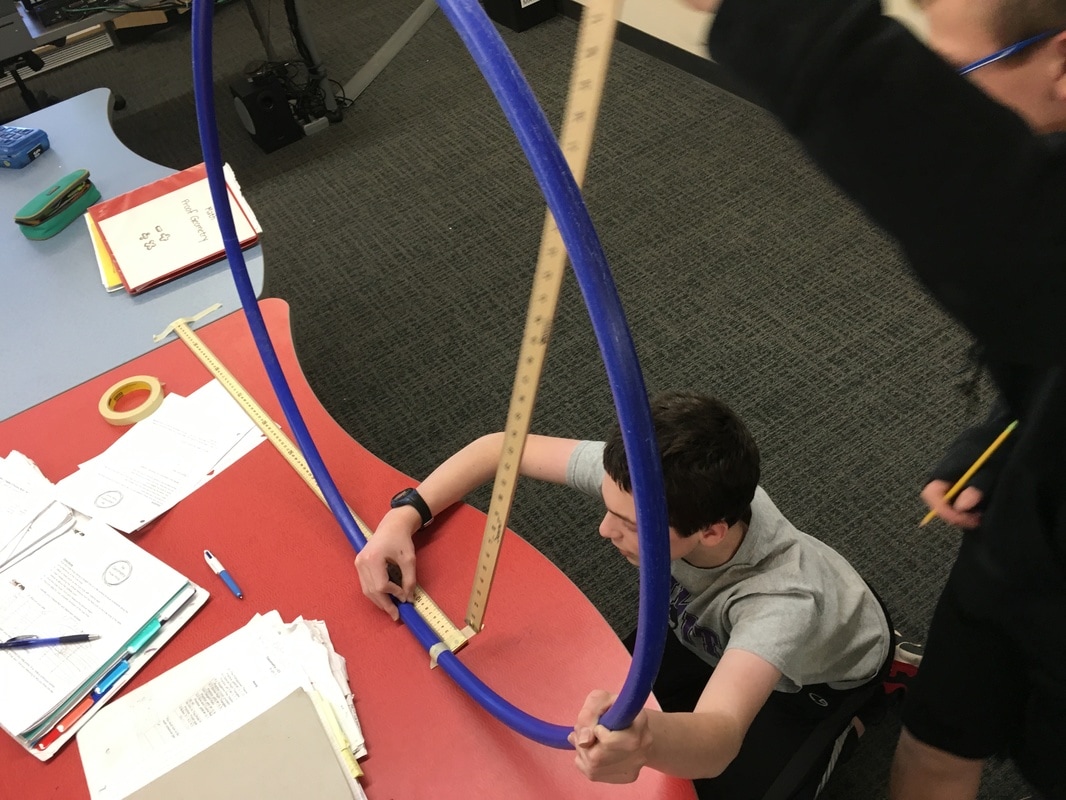
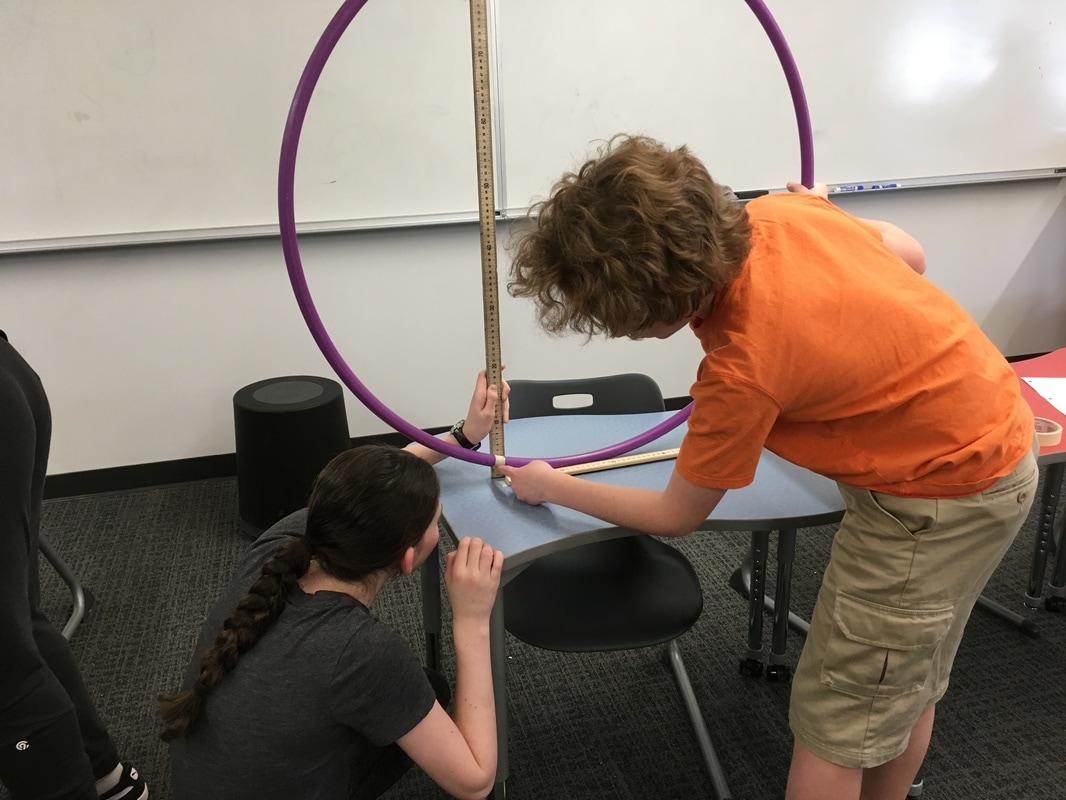
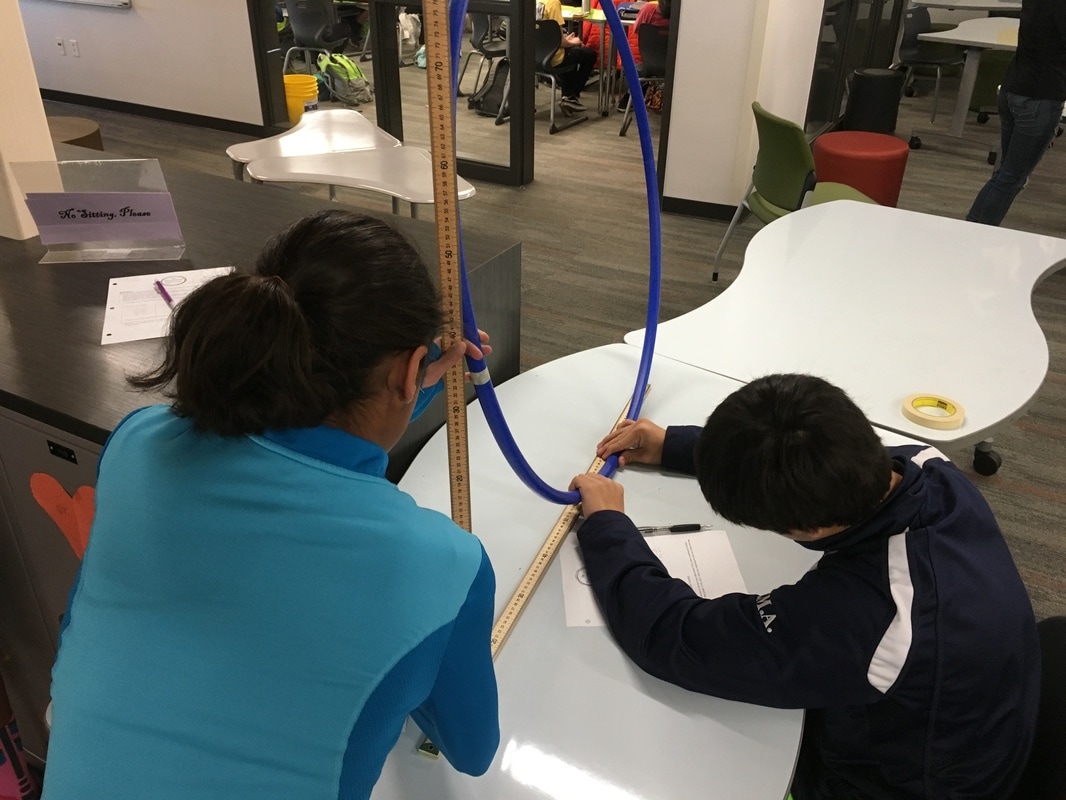
Q: If you were the person taking this video, what would the graph of your height look like? Sketch a graph. I get all sorts of mountain looking graphs or semi-circles. It's what I want. We are now going to get some intellectual dissonance. After students committed to a graph, we break out the hula hoops. I borrow them for a couple of days from our PE teacher. As an aside, I borrow stuff from the PE teacher and the science teachers all the time. Believe it or not, they are excited that your doing fun stuff in math class. They want you to borrow their stuff. Not kidding. 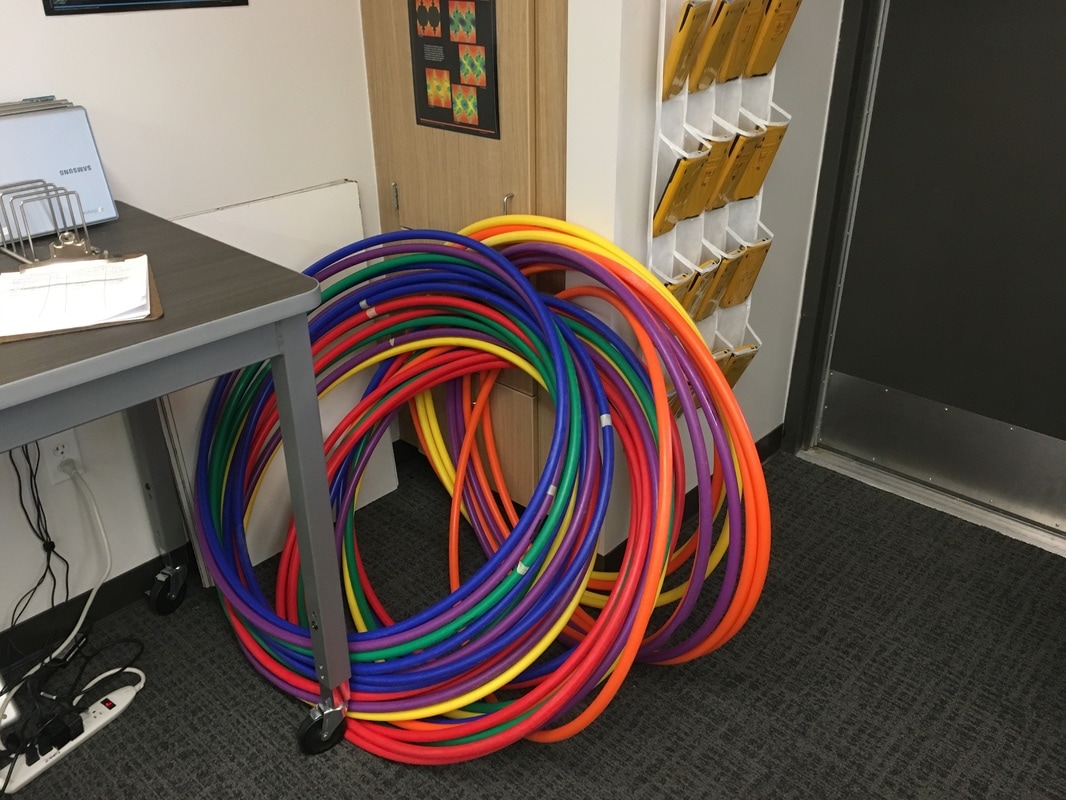 We give a two-minute talk through regarding how we are going to collect data. Something like: Put some tape on the hula hoops and put a dot on the side of the hula hoop. This dot is you. Throughout the experiment, you will always measure the height of the dot. You will roll the hula hoop 10 cm and then measure the height of the dot. In cm. When you get to the end of your meter stick, keep your fingers on the bottom point and slide it back to the beginning of the meter stick. Do this for one complete revolution of the hula hoop/ferris wheel. Most groups finish with the data gathering in 30 minutes or less. As another aside, I have students start at the bottom, like they are loading onto a Ferris wheel. Technically, this will look like a cosine function with an a-value of -1. However, we're measuring height, which is a sine function. Whatever. In four years of doing this, I've never had it throw students off the scent of the math we're doing.
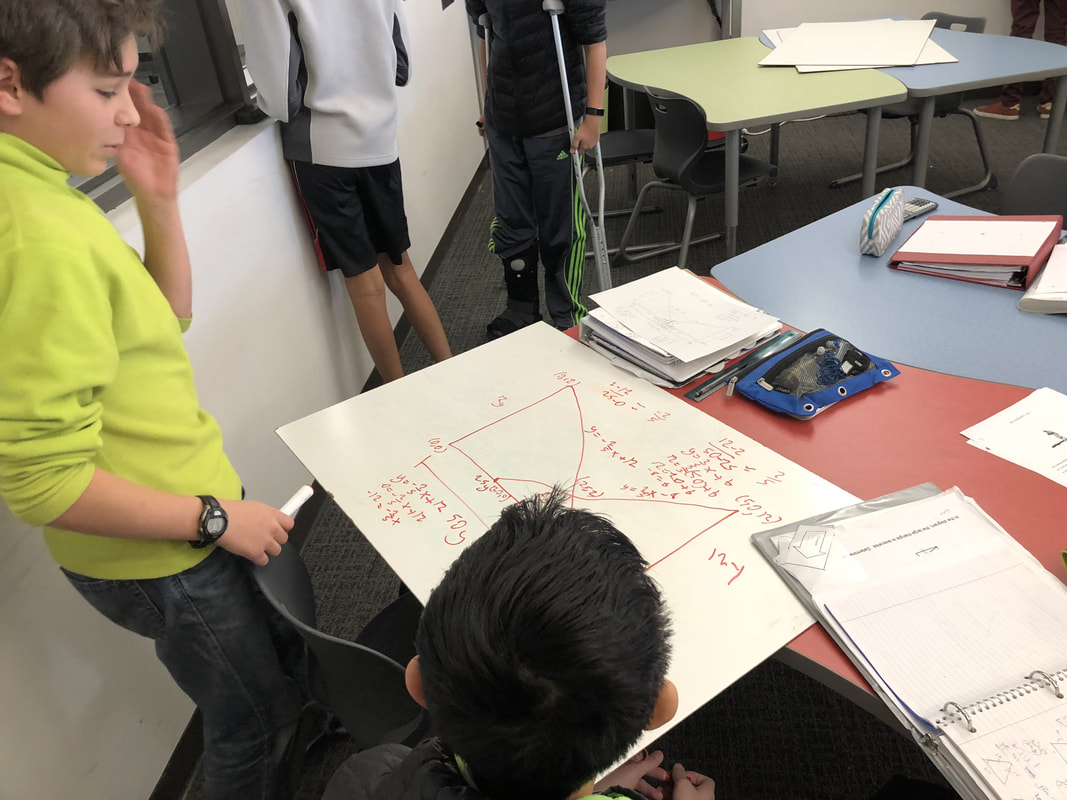
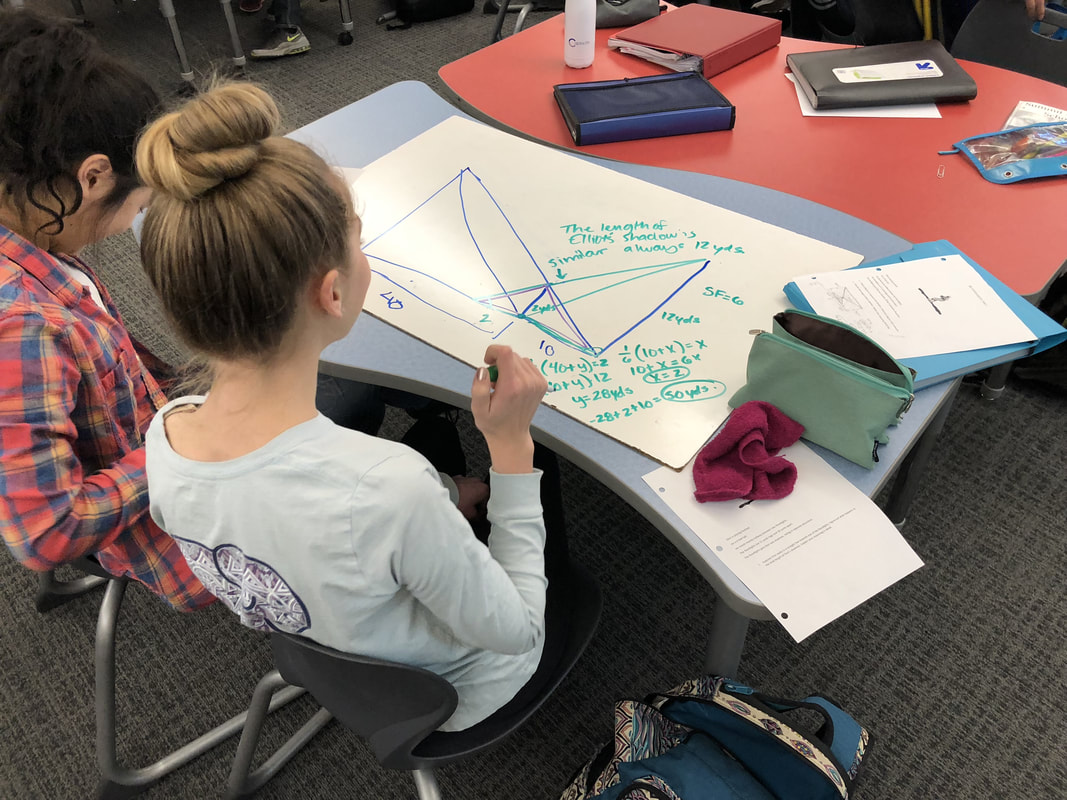
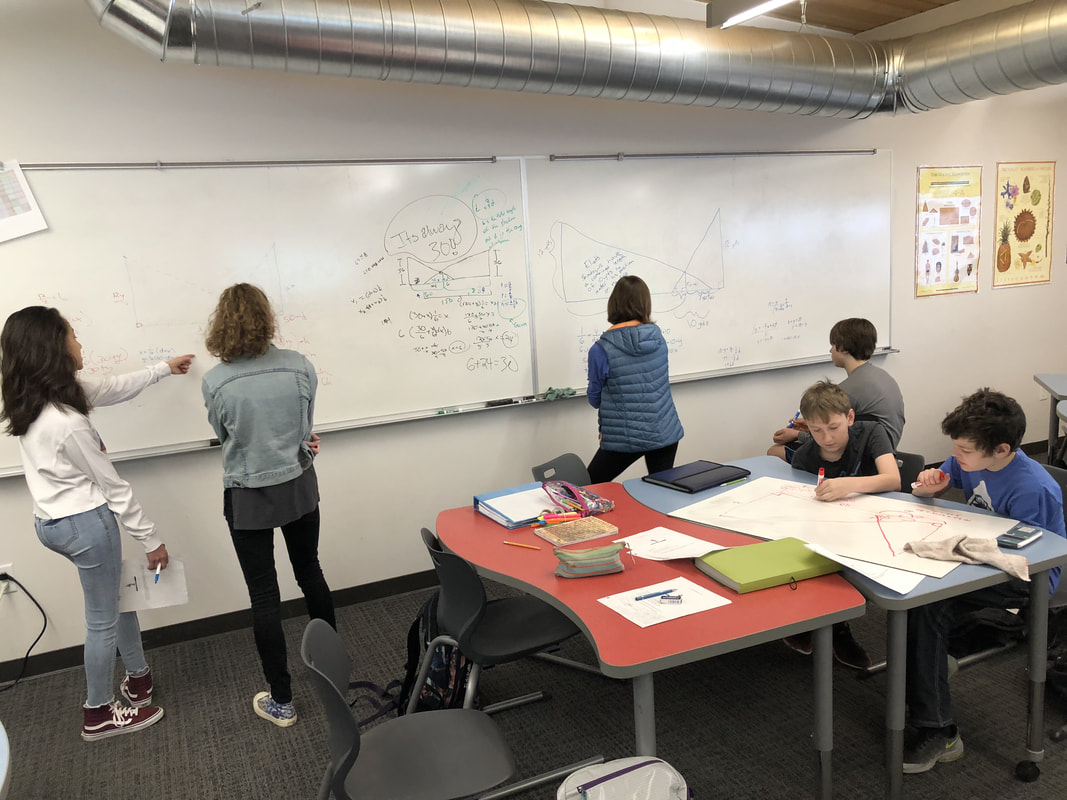
Here's some of the resulting graphs. I take pictures of some of the student work and we have a conversation about it. Q: What do you like or dislike about this graph? 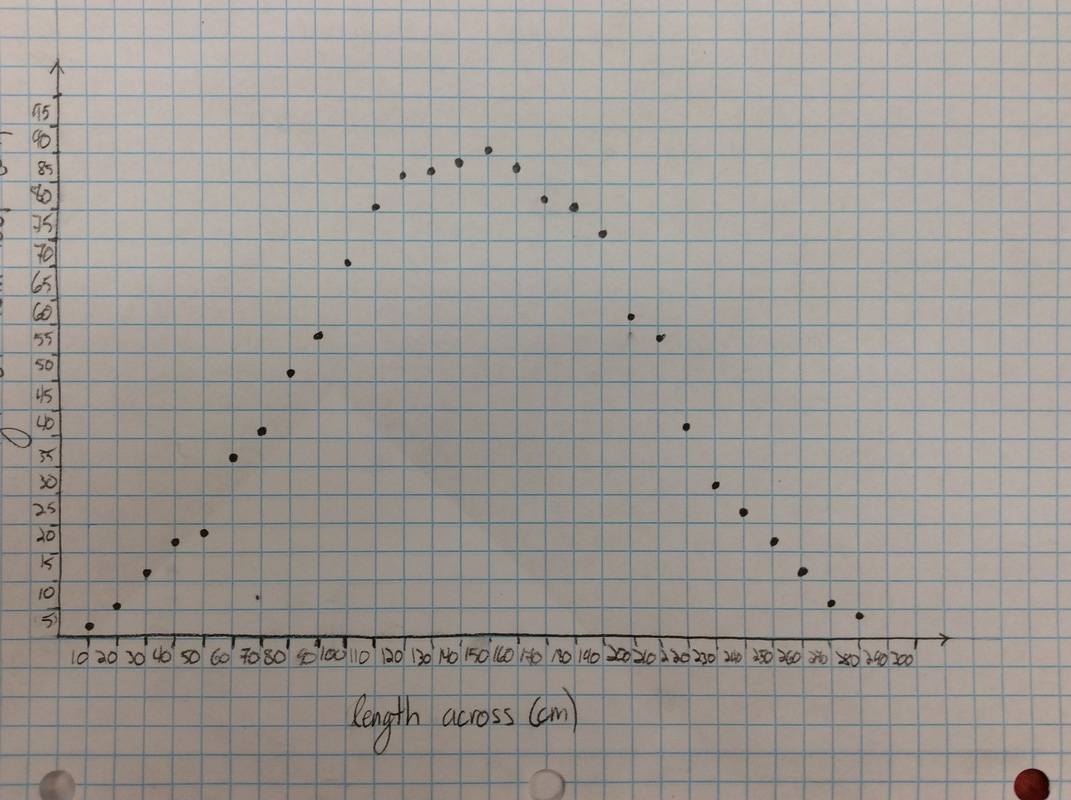 Students tend to not like the "lumpy" portions of the graph. I put the following graph on the screen in response. Students like this one much better. As if almost on cue, some student always says we should connect the points. Then we get to have a good discussion about whether the graph should be continuous or discrete. 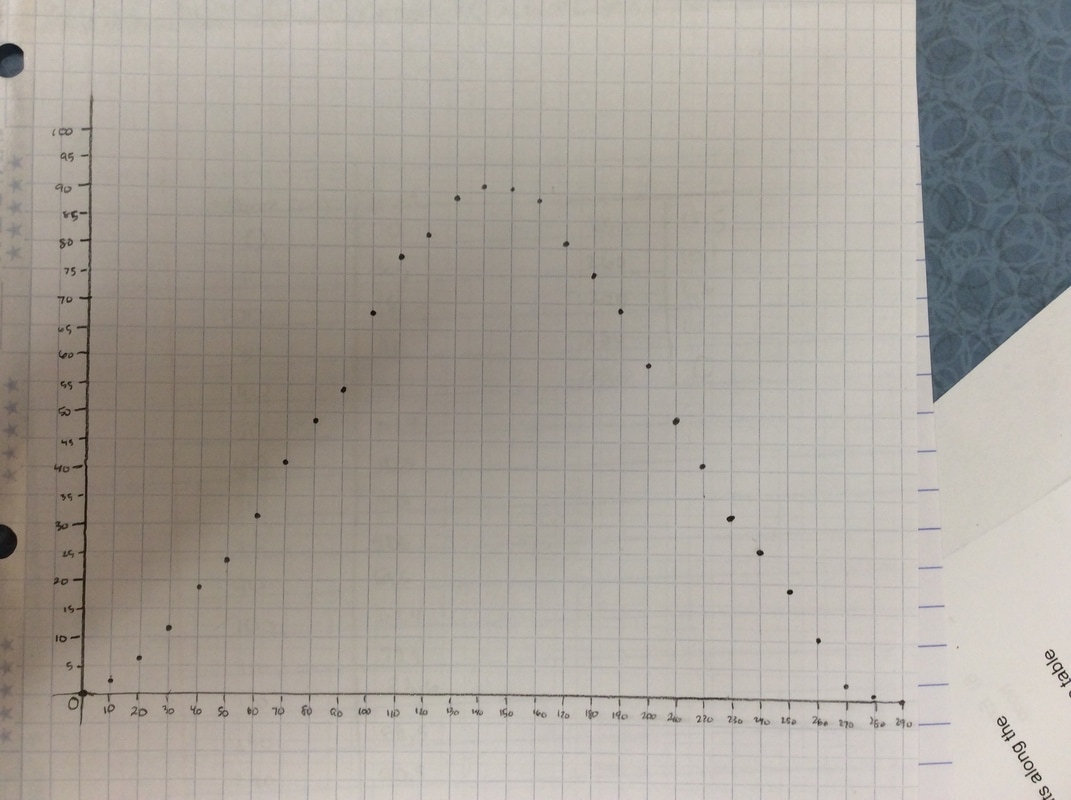 Students generally settle on the following as their "ideal" graph. We then talk about rate of change in table groups. How do you talk about rate of change with this graph? After flailing about wildly, we usually are able to give a decent explanation about whey when the point we are measuring is at the bottom or the top of the circle it doesn't have much vertical change in distance as opposed to when it is on the sides. 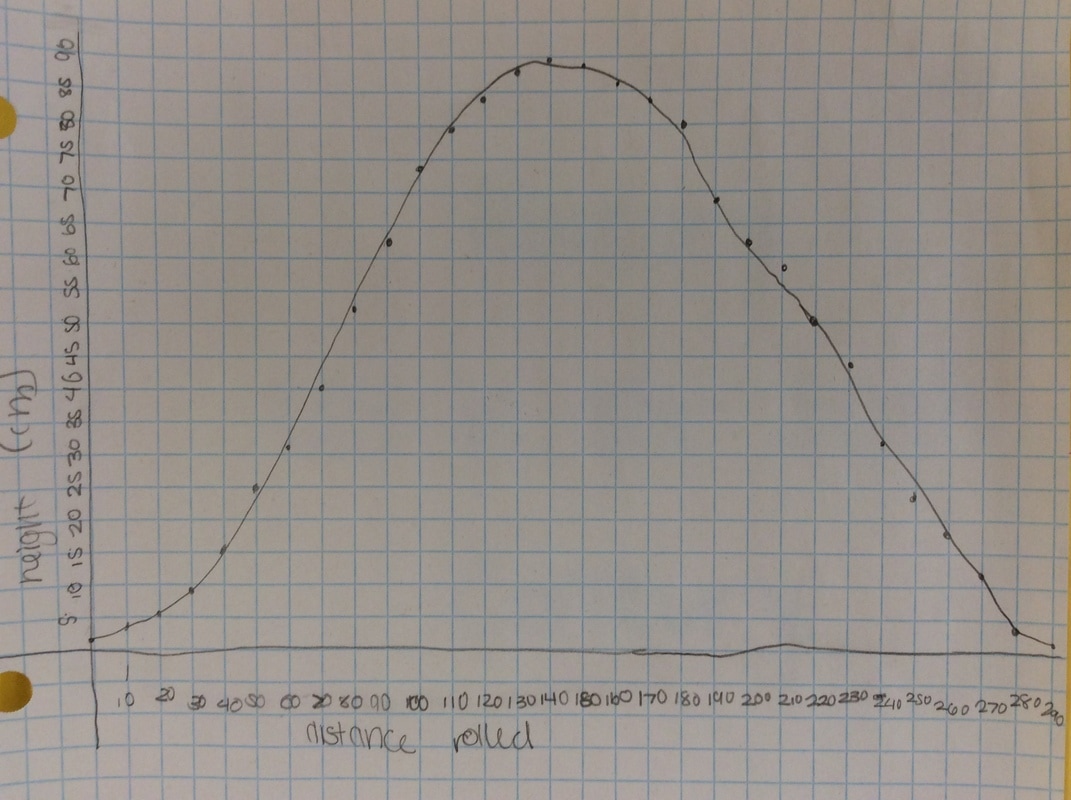 Day 1 usually ends here and students finish their 7 questions on the handout. This year, Day 1 was half eaten by questions over a previous assignment and we gave up half of Day 2 to finish gathering data, graphing, and having this discussion. Day 2 begins with a discussion about the unit circle. The following is the definition of "sine" from Wolphram Alpha. Notice the first part of the definition. 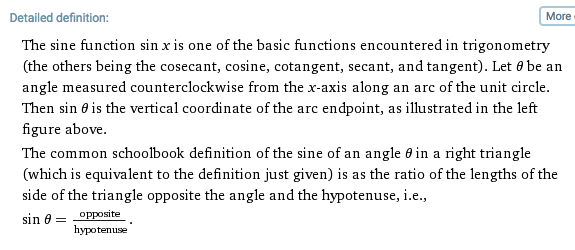 Forget the "common schoolbook definition". As a class, we define 'sine' as the vertical distance of a point on the circle to the x-axis and the 'cosine' as the horizontal distance of a point on the circle to the y-axis. It's *expletive* amazing! We talk about what this distance looks like when we move the point around the circle. Here's some of the web-based visualizations I use: Sine and Cosine as vertical and horizontal distances in the unit circle http://www.analyzemath.com/unitcircle/unit_circle_applet.html https://www.mathsisfun.com/algebra/trig-interactive-unit-circle.html https://www.desmos.com/calculator/v7x6br3w6a A visualization of Sine and Cosine in the Unit Circle: (If you want to moving one, click on the link below) http://i.stack.imgur.com/p8O4P.gif This is THE move that sets up everything! It sets up talking about sine and cosine as functions. It sets up a point on the unit circle being (cos, sin). It sets up the Law of Cosines not being some weird abnormality that's never really understood by students. It sets up that what we commonly refer to as trig ratios are lengths of lines in the unit circle. It also sets up any triangle with a hypotenuse other than 1 being a dilation of a triangle on the unit circle, with a scale factor of the length of the hypotenuse. Of course we end up deriving the shortcut methods for finding sine, cosine and tangent without having to go back to the unit circle every time. However, the fact that these are real lengths and not just abstractions goes a long way with my concrete learners. Sine is a vertical distance. Cosine is a horizontal distance. Tangent is the distance from the tangent to the point on the circle to the x-axis. Which is why tangent of 90 degrees and 270 degrees is undefined. This also helps discuss Cotangent, Secant, and Cosecant when they come up later in the year. They are all actual lengths in the unit circle! 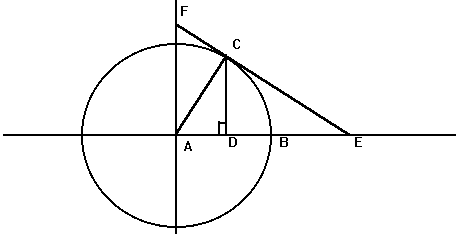 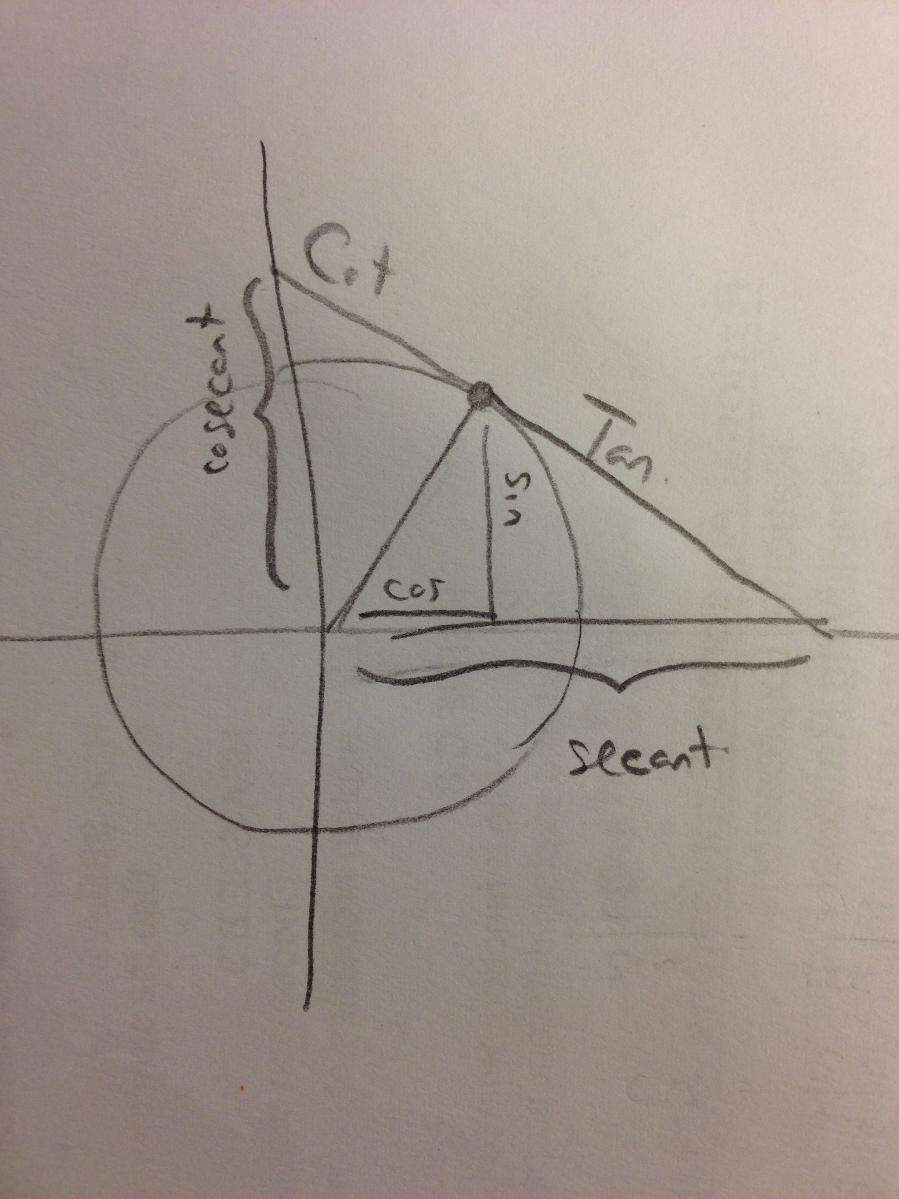
If you're teaching Algebra 2, after this throw in a little Cosine Ferris Wheel from MARS and you've got yourself a decent start to a trig unit.
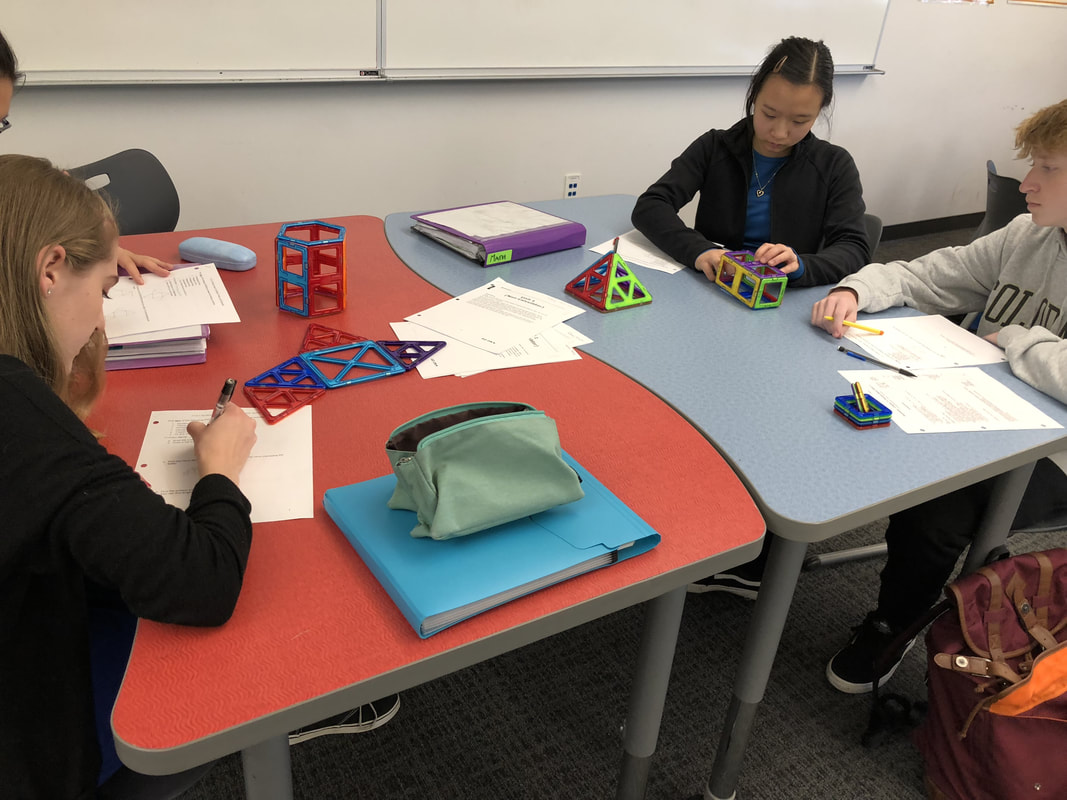
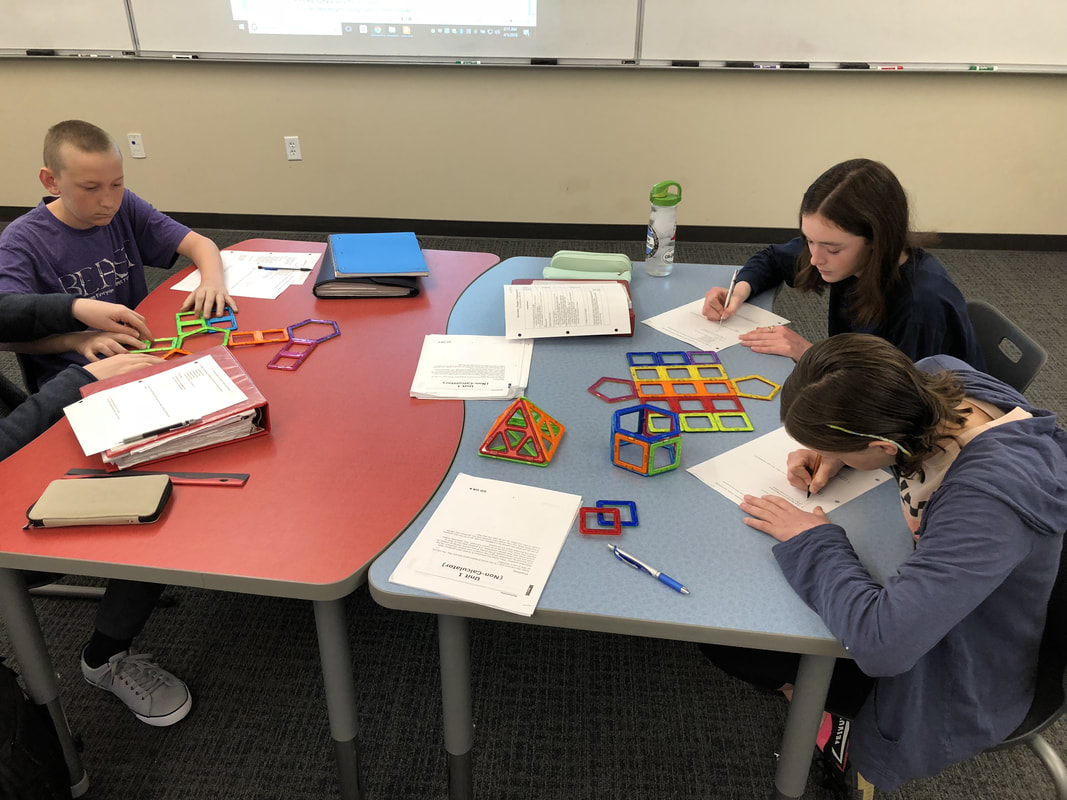
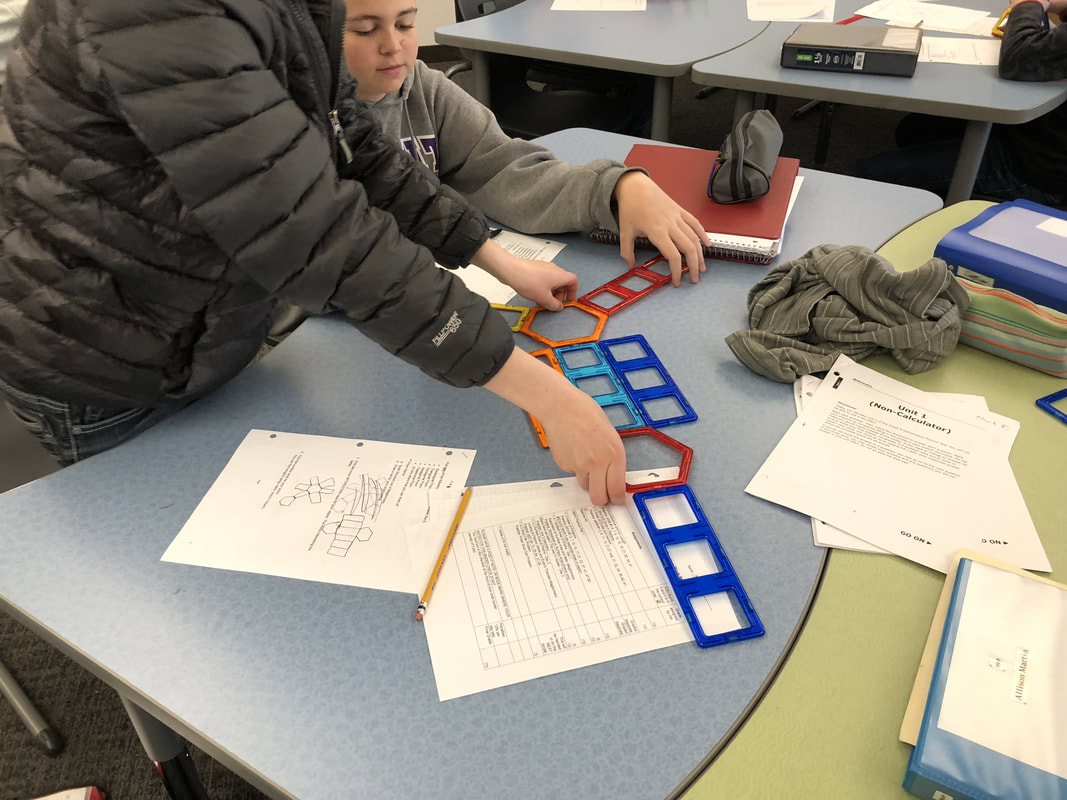
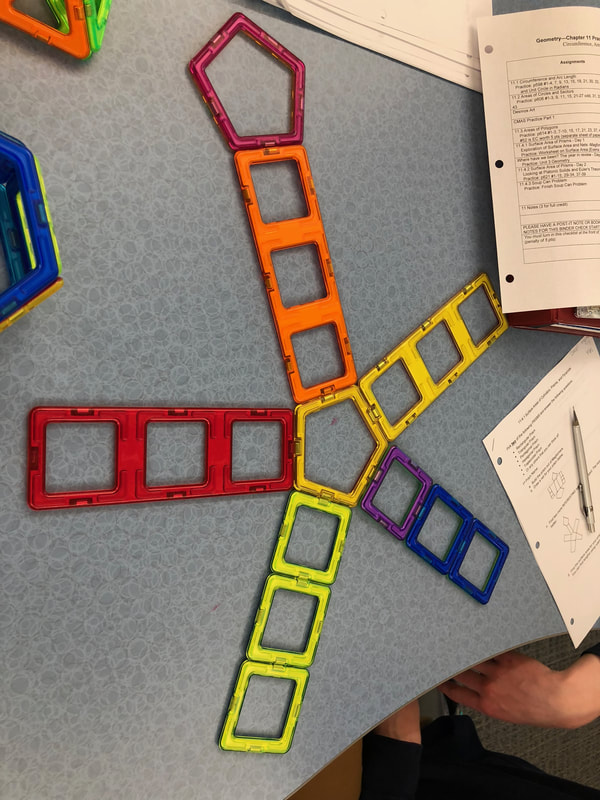
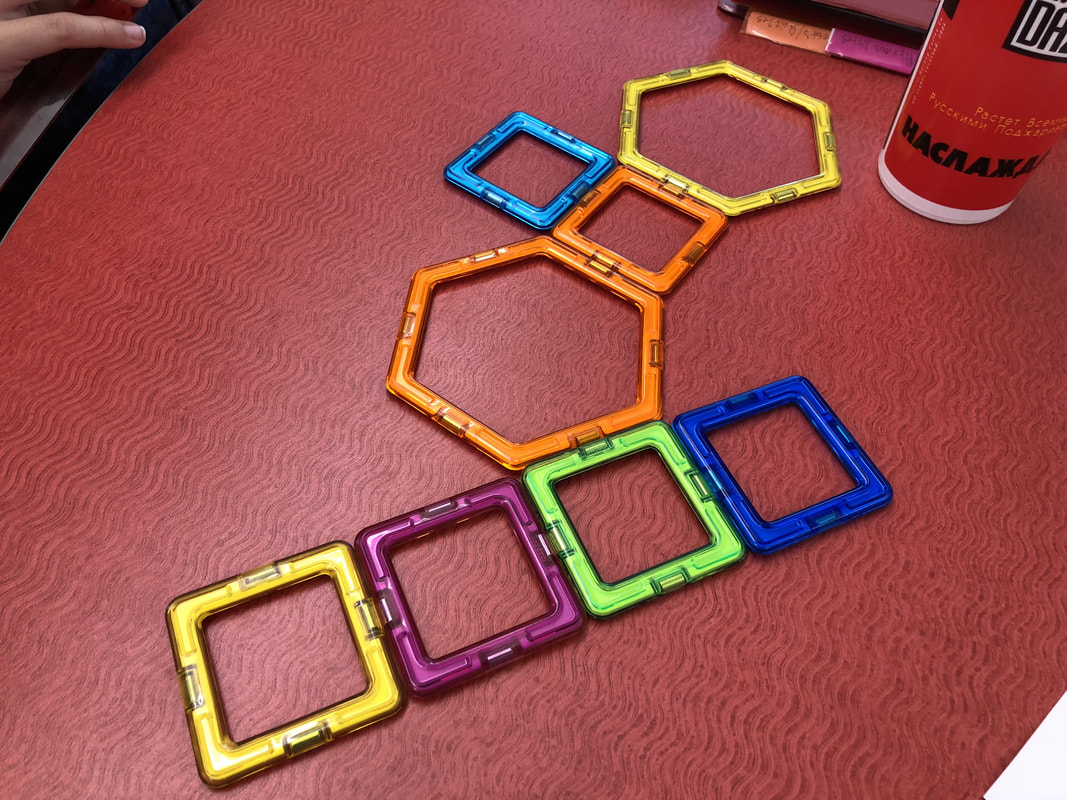
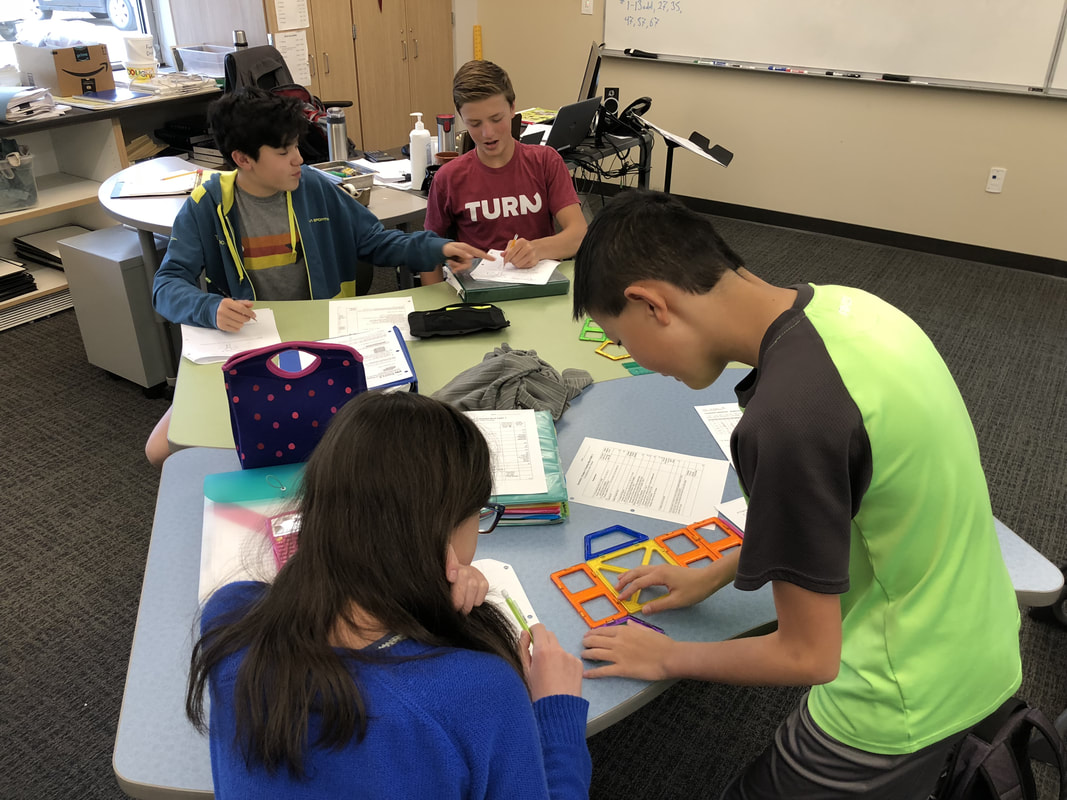
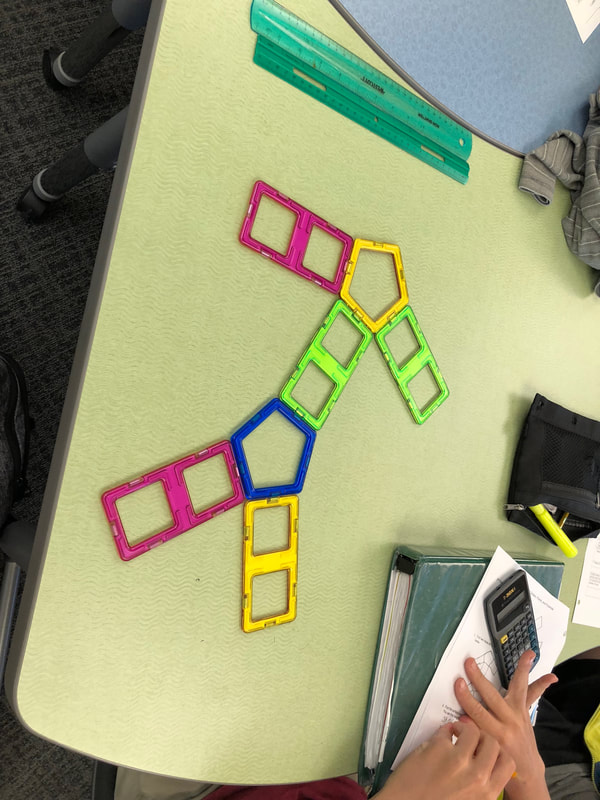
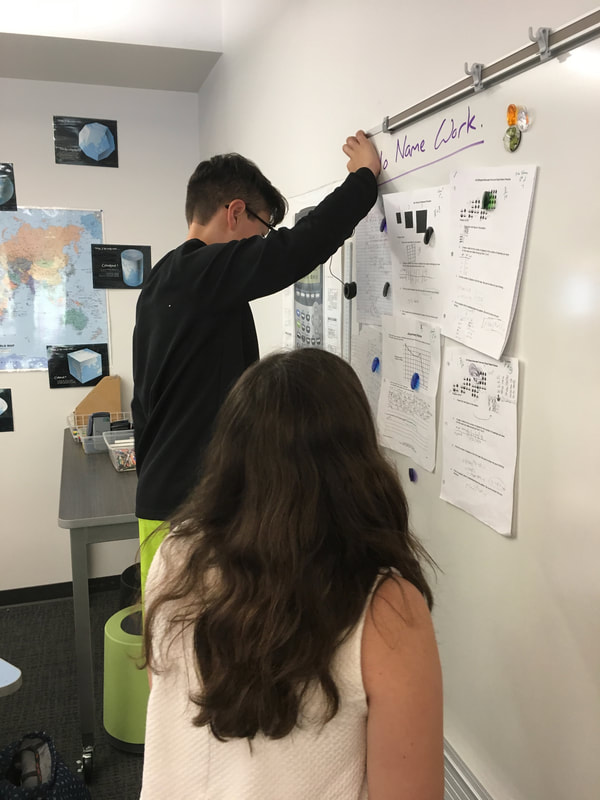
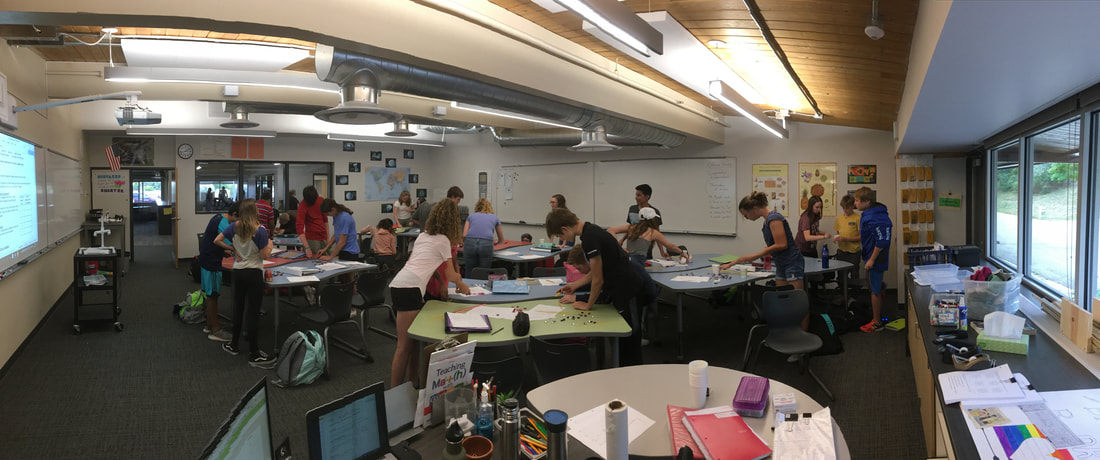
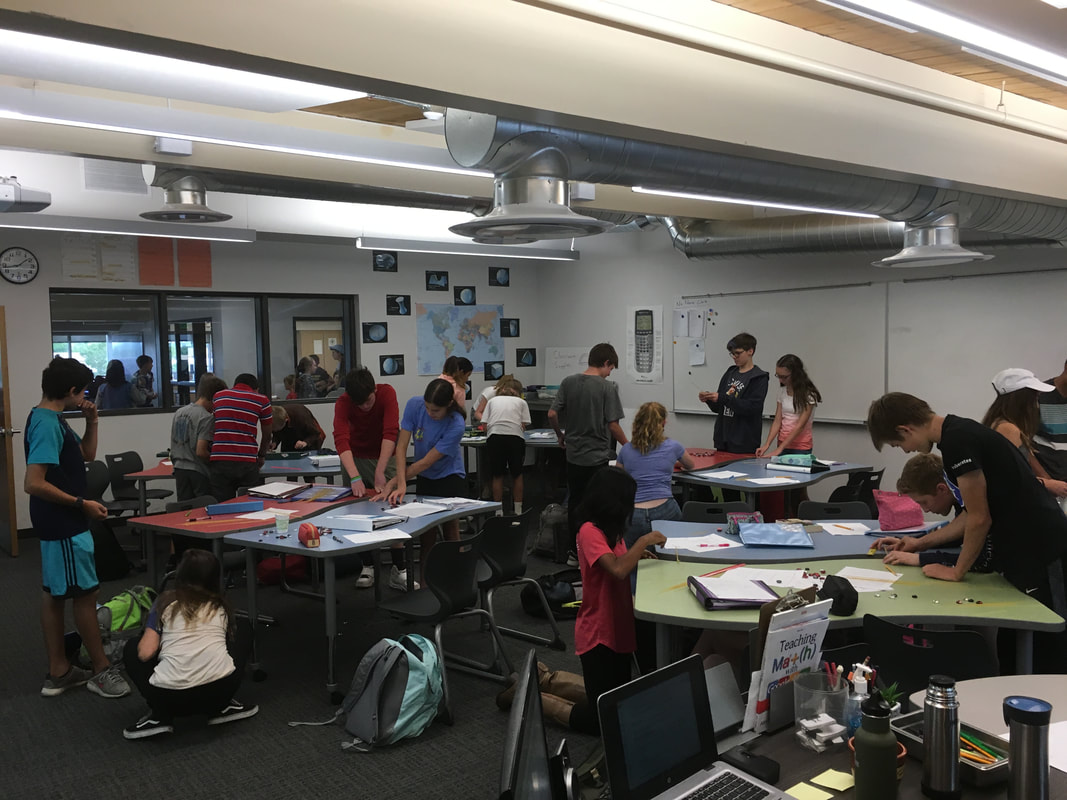
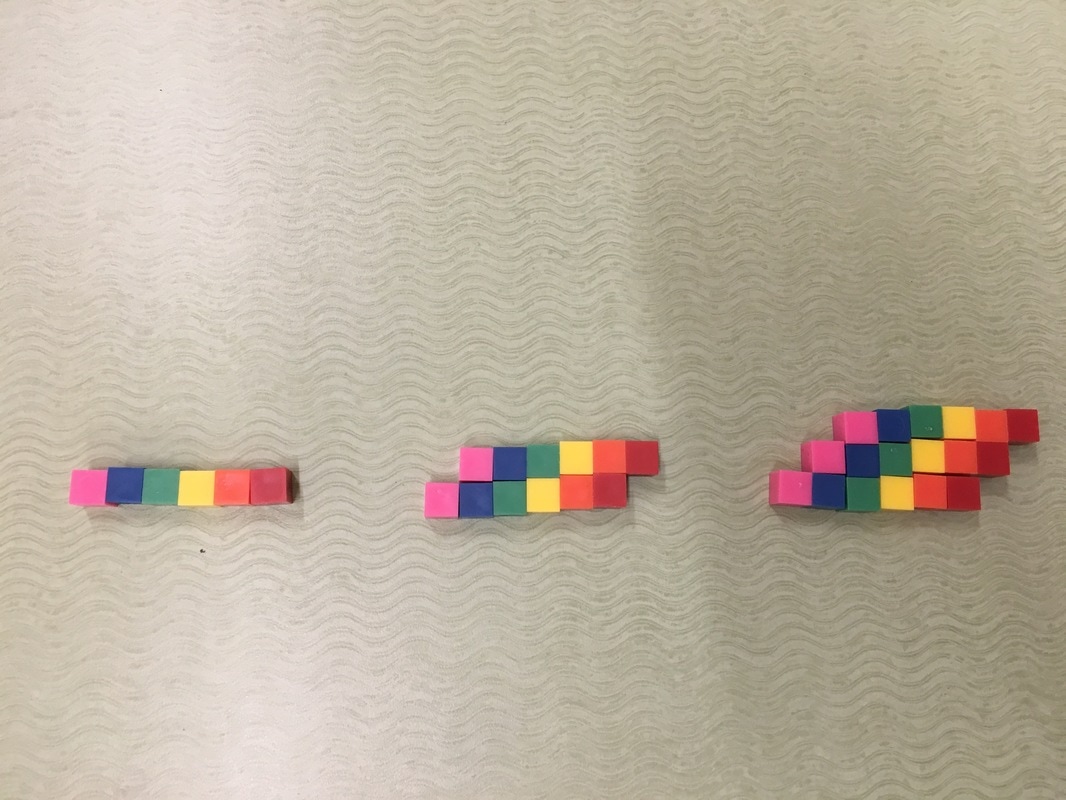
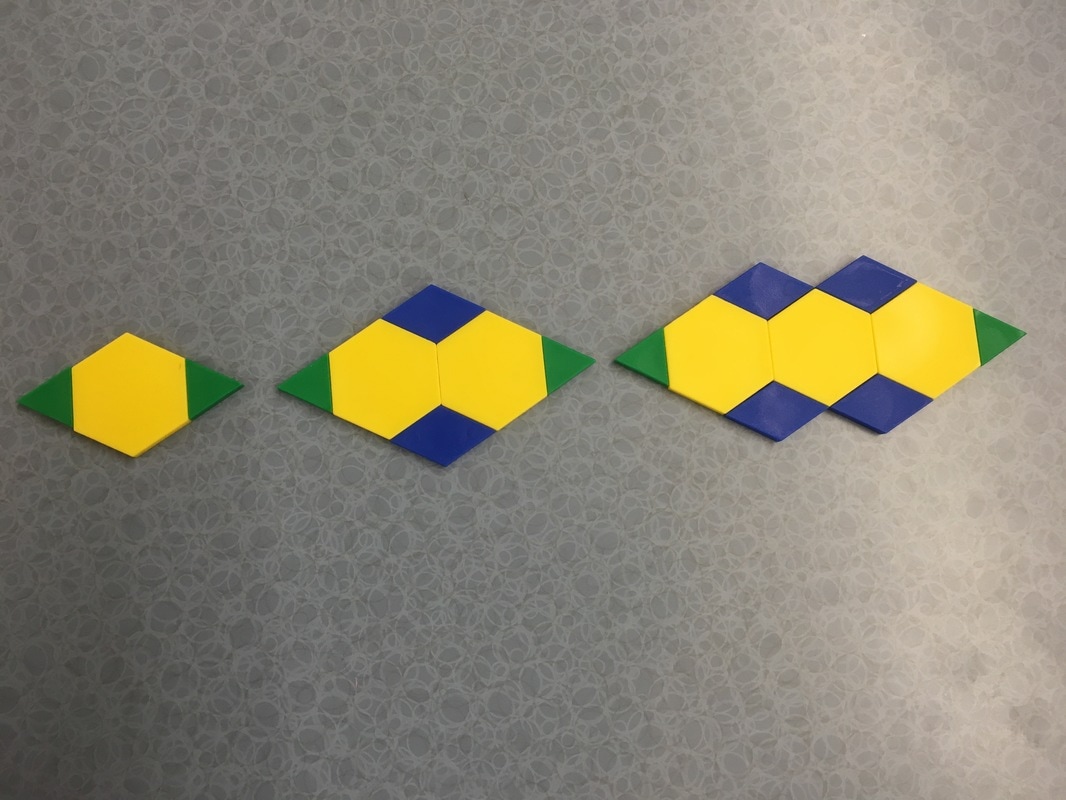
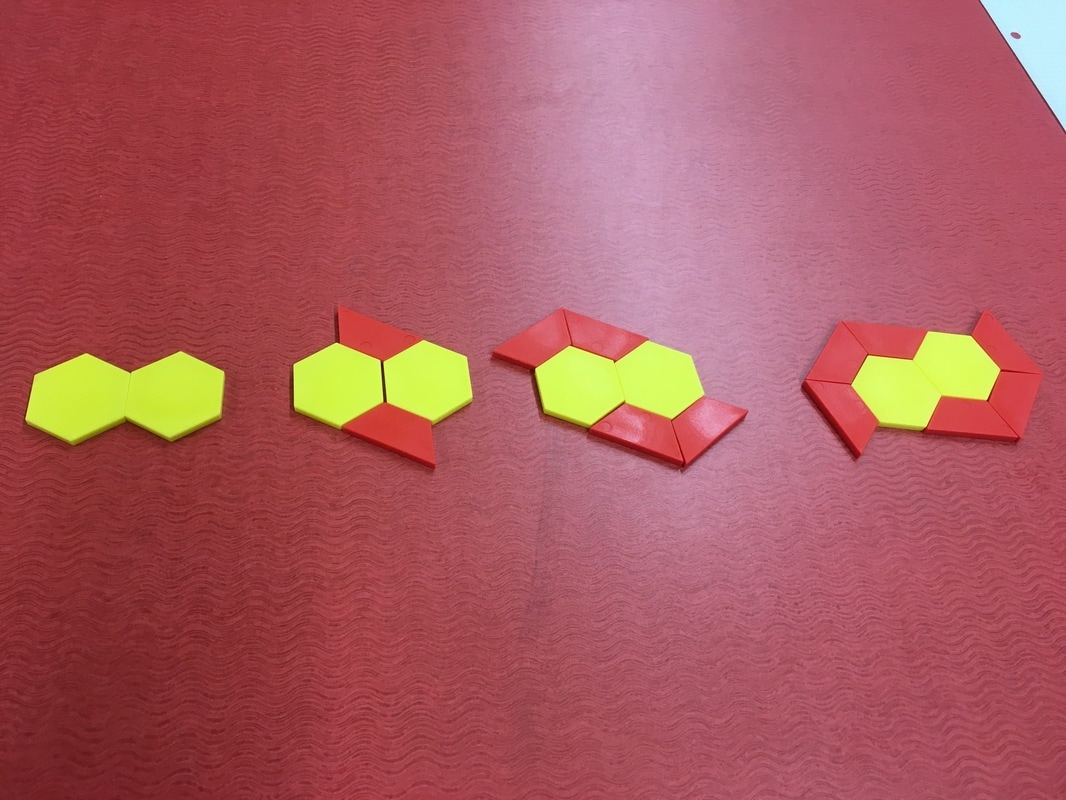
Oh, there's a field trip and this is the only section of Algebra 1 I'm teaching today? Okay kiddos, we're making some visual patterns and inundating Fawn Nguyen's email account? Ready? Go! Sadly, two of the groups weren't able to come up with equations for their patterns during class. Sadly, those groups also weren't interested in completing the equations outside of class if it wasn't an assignment. All in all, not too shabby.
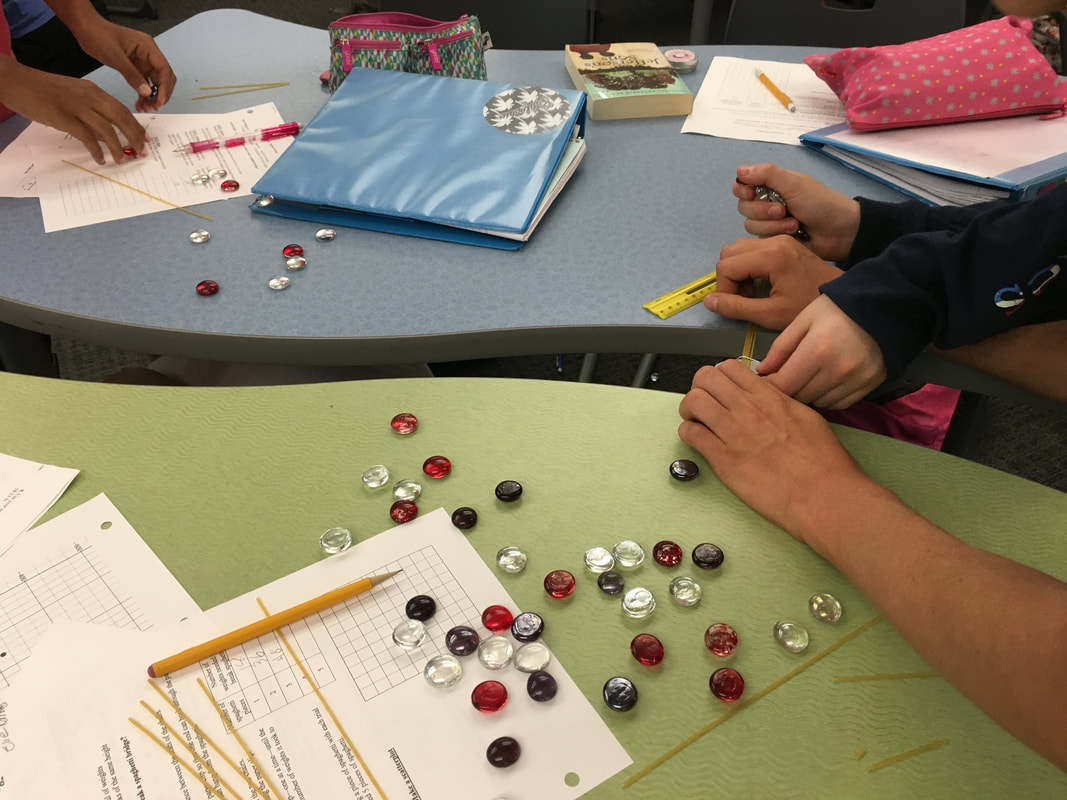
The directions were simple: •Drop a ball from any initial height, measure in cm. •Measure the height for 5 bounces of a ball (I suggest using a table). •Graph the points (graph paper) •Create an equation that models/fits your data. •Do this for two different balls (don’t put both balls on the same graph) 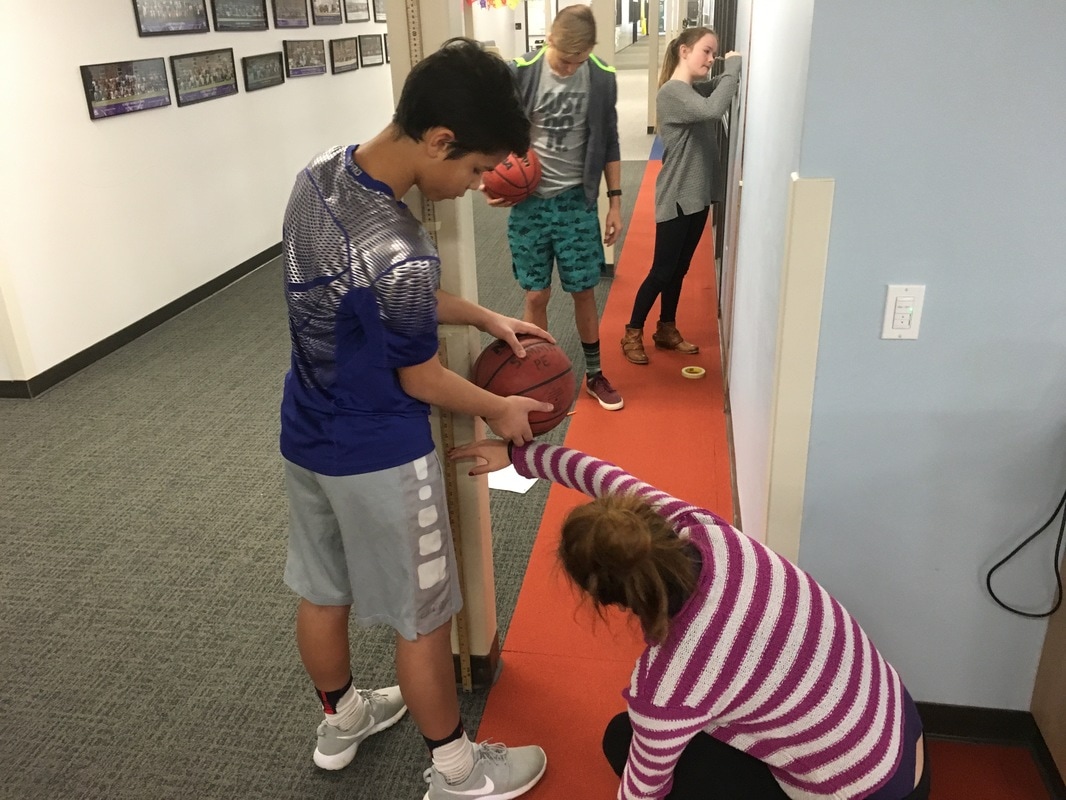 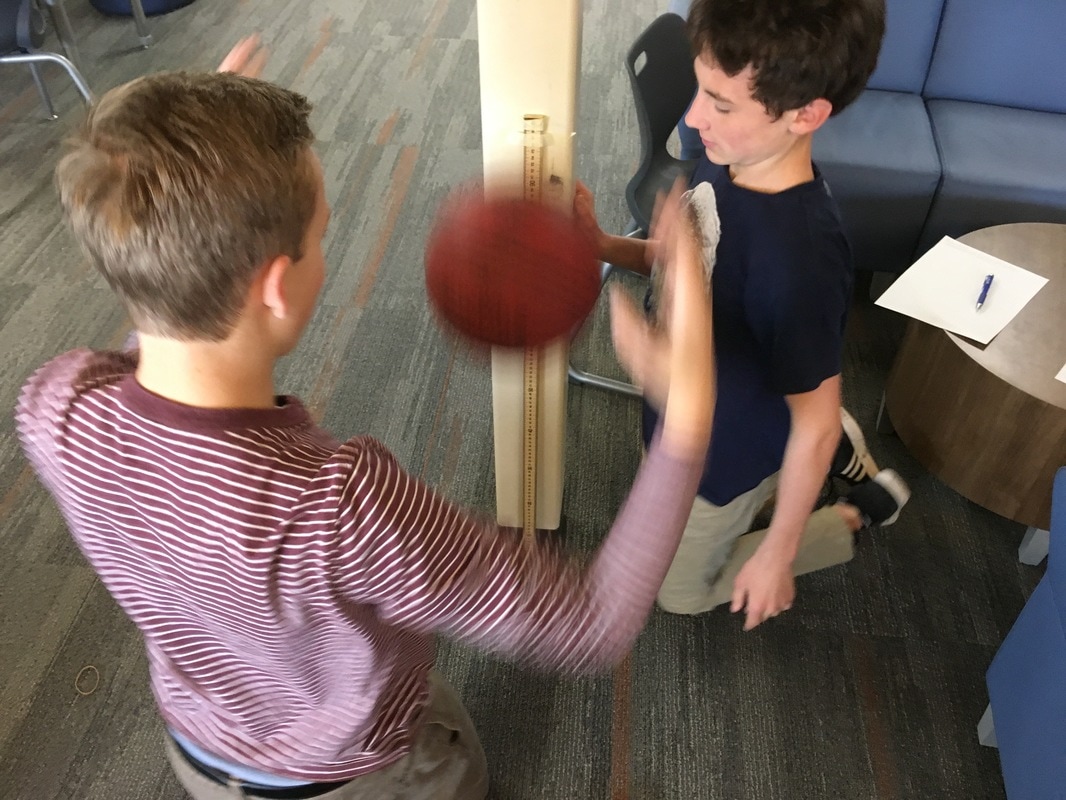 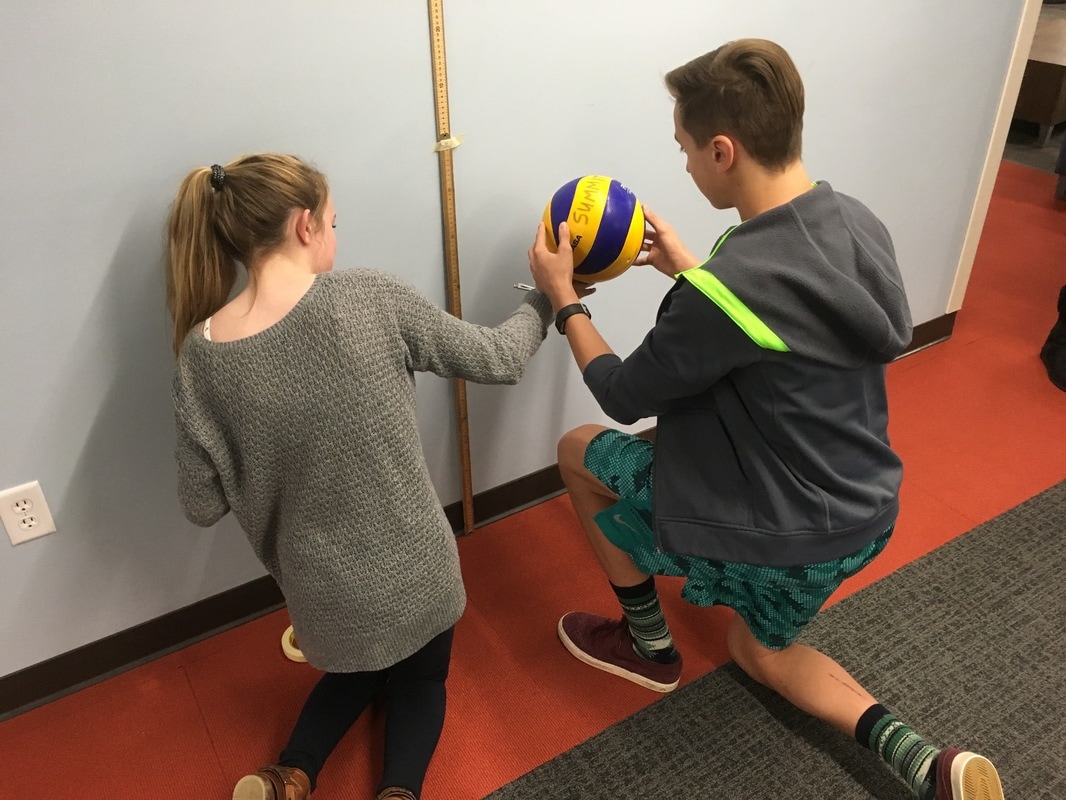 The results were fabulous! Students had great conversations surrounding how to find the constant multiplier if it never ended up being the same between bounces. We also had heated arguments about whether connecting the data points with a curve made sense in the situation. (The students came to the consensus that they did not think the graph would be continuous.) 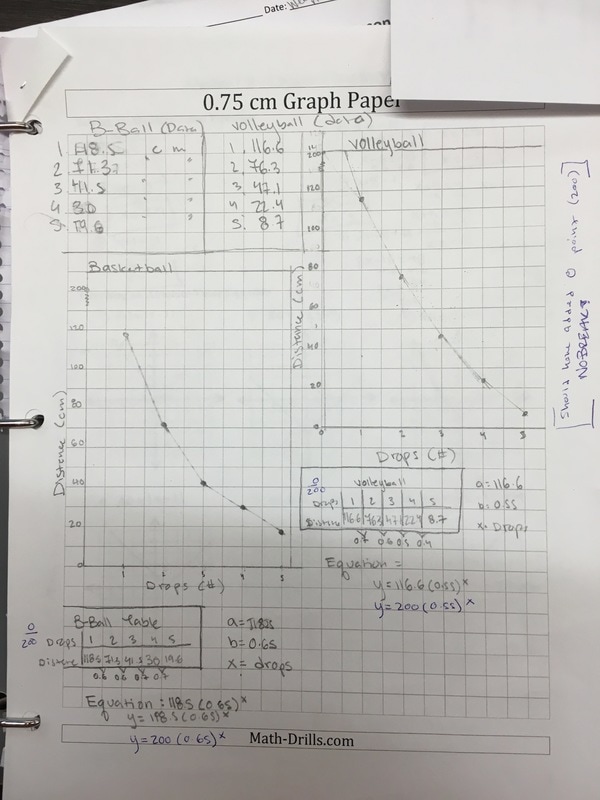 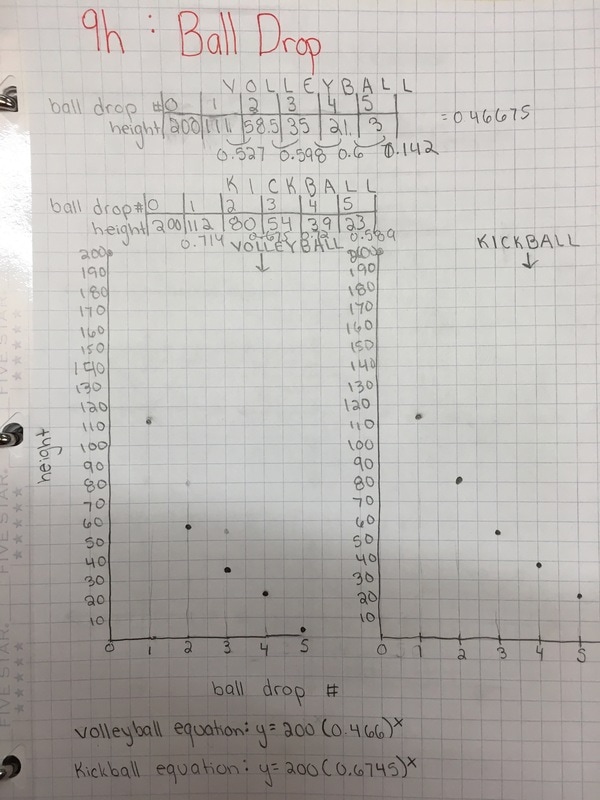 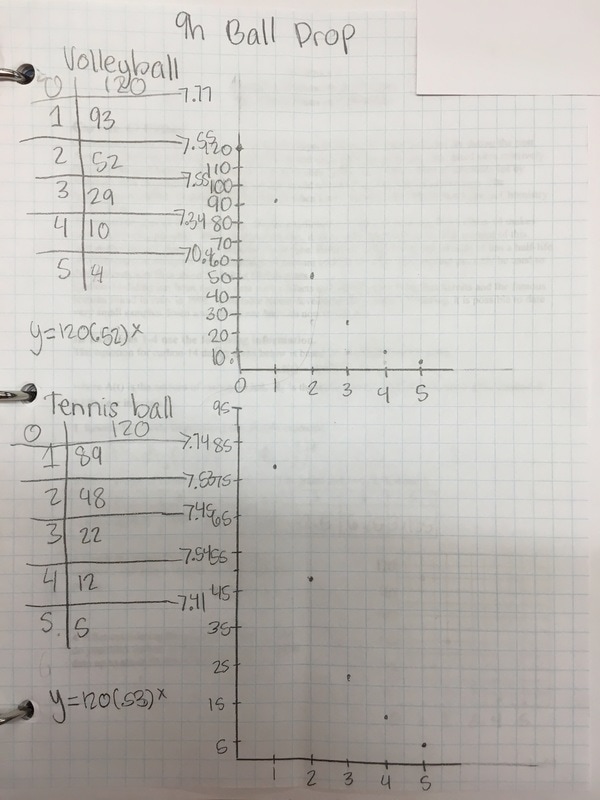 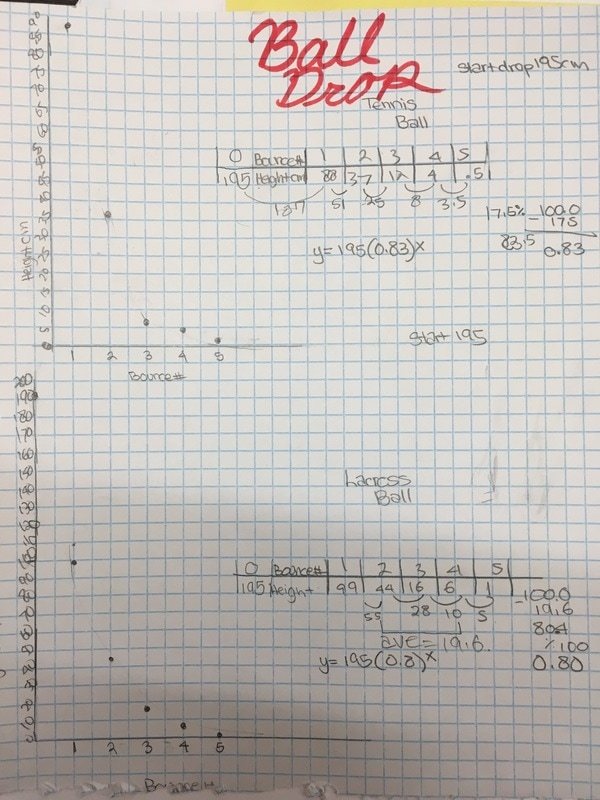 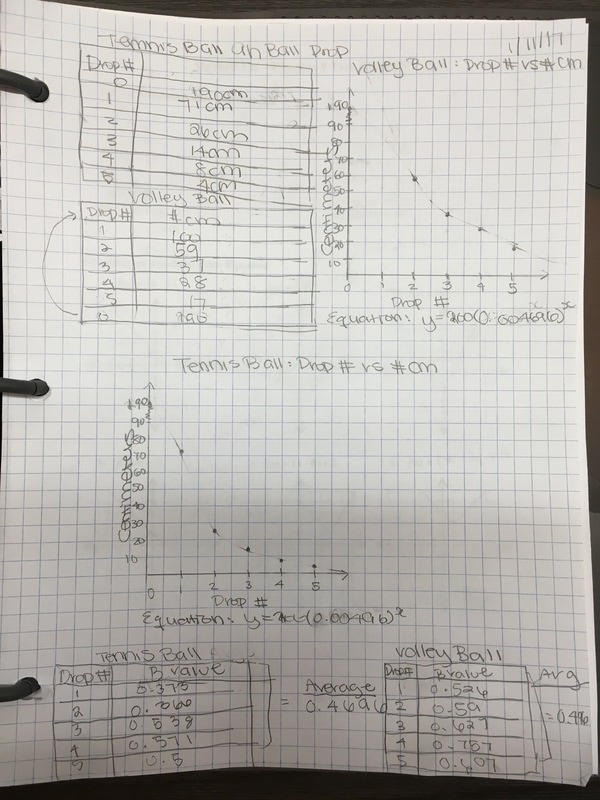 |


Andrew Busch
I teach Math at Ralston Valley High School in Arvada, CO. Categories
All
Archives
March 2019
|
|||||||||||||||||


 RSS Feed

