I overheard multiple conversations between students who noticed the rate of change both sped up and slowed down. They were convinced they were doing it wrong. That's the kind of dissonance I'm looking for!
|
I base all of the trigonometric functions/ratios in the unit circle. We use this activity as an anchor for our future discussions about all sorts of things: the graph of sine and cosine, how we create triangles within the circle, and even sine being the distance from the x-axis and cosine the distance from the y-axis. I overheard multiple conversations between students who noticed the rate of change both sped up and slowed down. They were convinced they were doing it wrong. That's the kind of dissonance I'm looking for! Here is a complete write up of the lesson.
0 Comments
Original problem by Robert Kaplinsky. I use the problem directly after we learn about special right triangles in Geometry (45-45-90 and 30-60-90). Lot's of great overlap between Algebra and Geometry here. Lot's of great opportunities for students to present different solution methods.
A few years ago I started introducing trigonometry using circles. It started in Algebra 2 and moved down into Geometry. By basing all trig off the unit circle, we make an easy transition from Geometry trig (finding missing sides and angles of triangles) to Algebra 2 trig (sine and cosine functions and transformations). After a couple of years, I'm never going back.
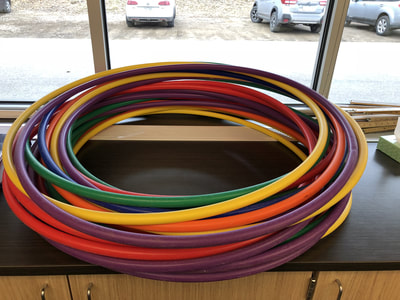
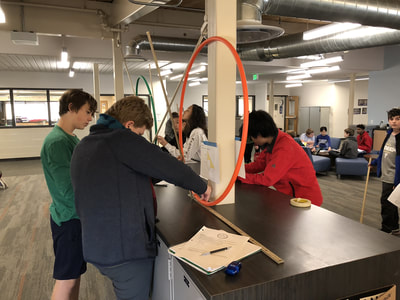
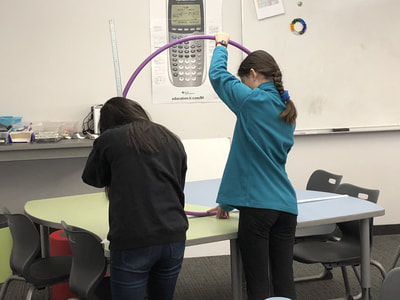
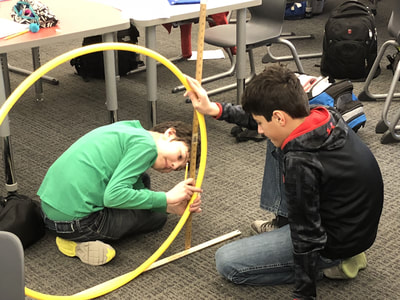
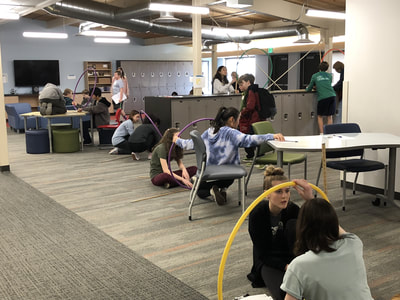
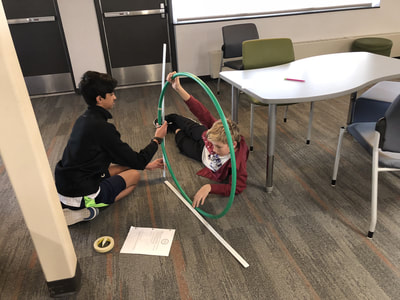
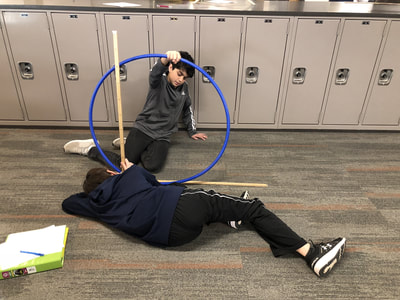
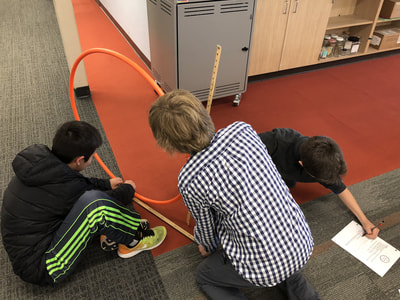
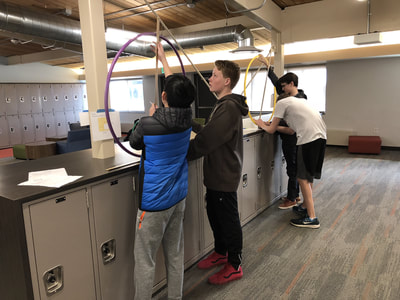
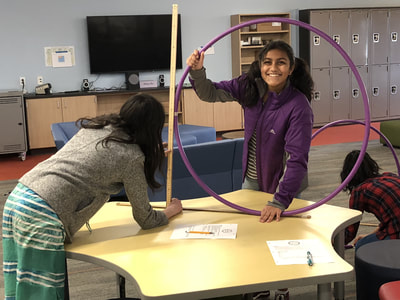
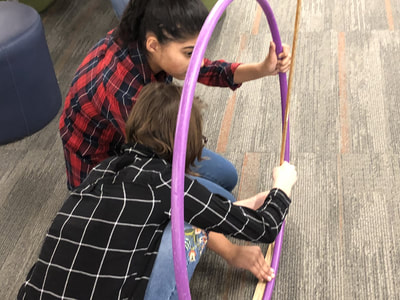
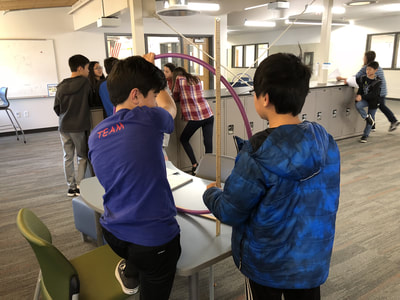
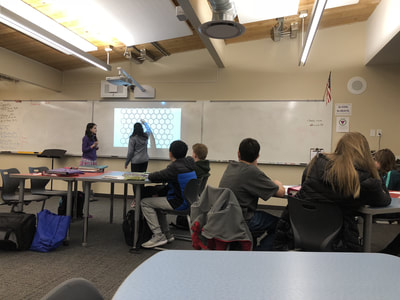
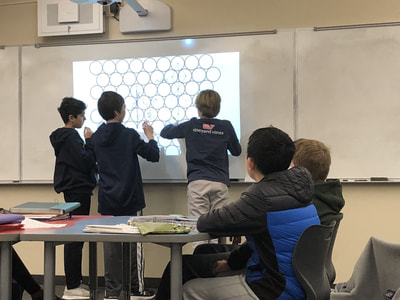
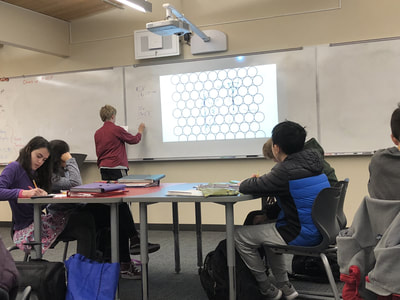
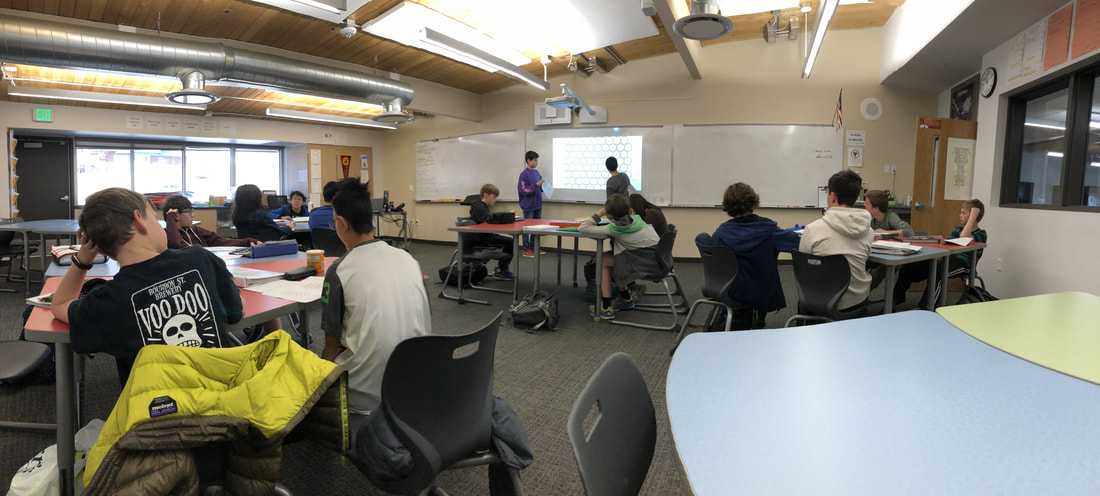
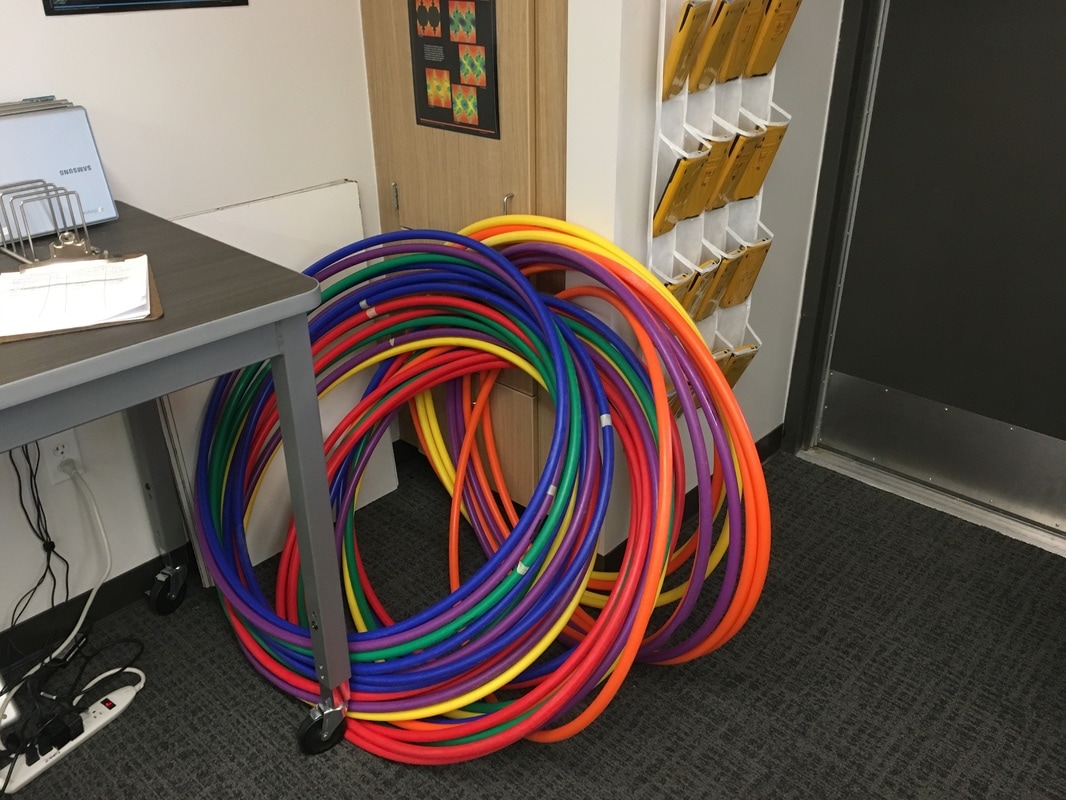
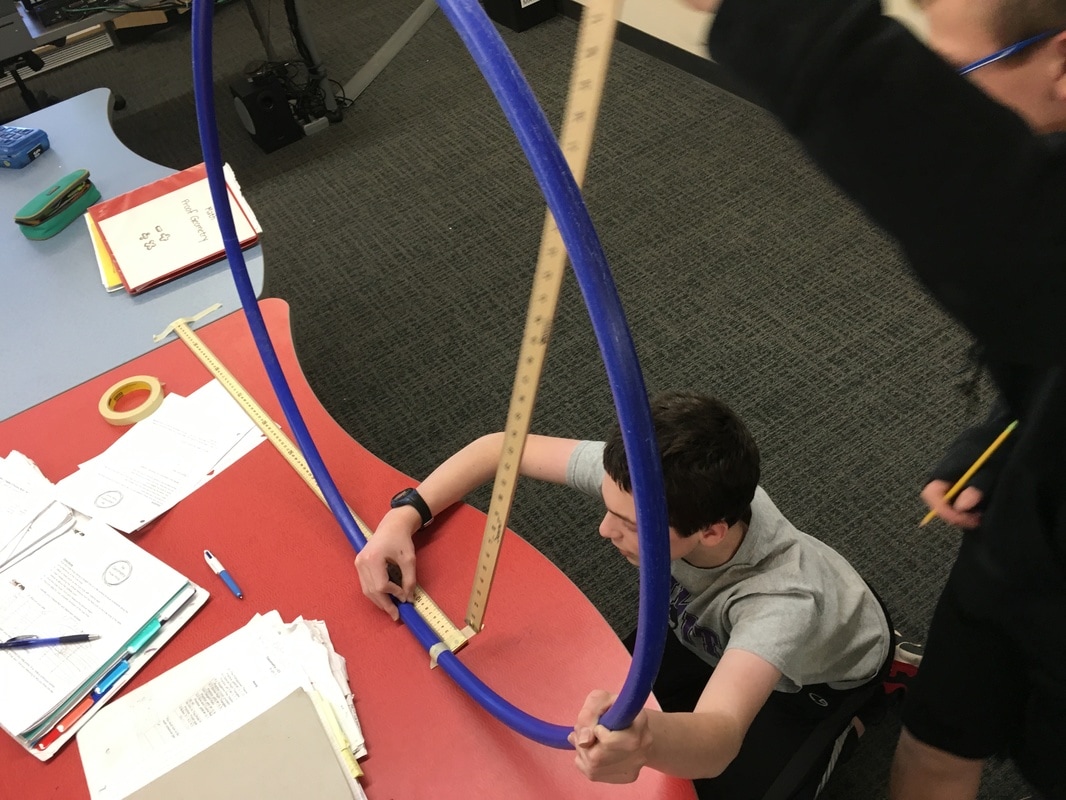
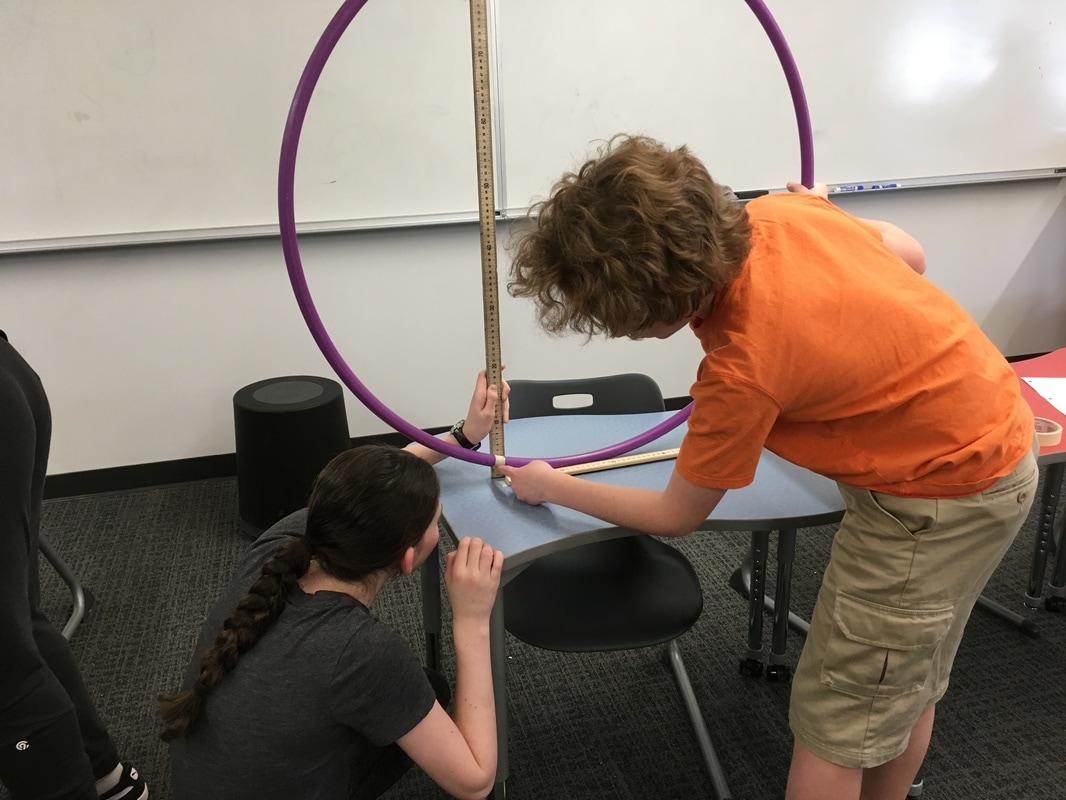
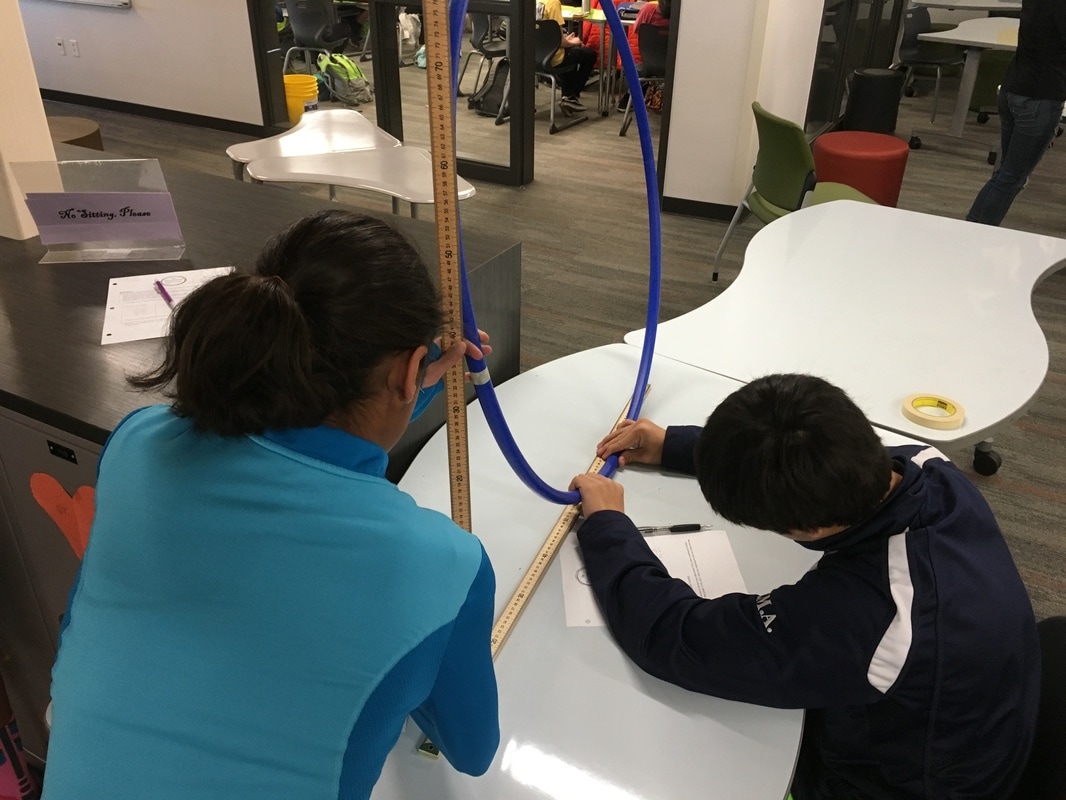
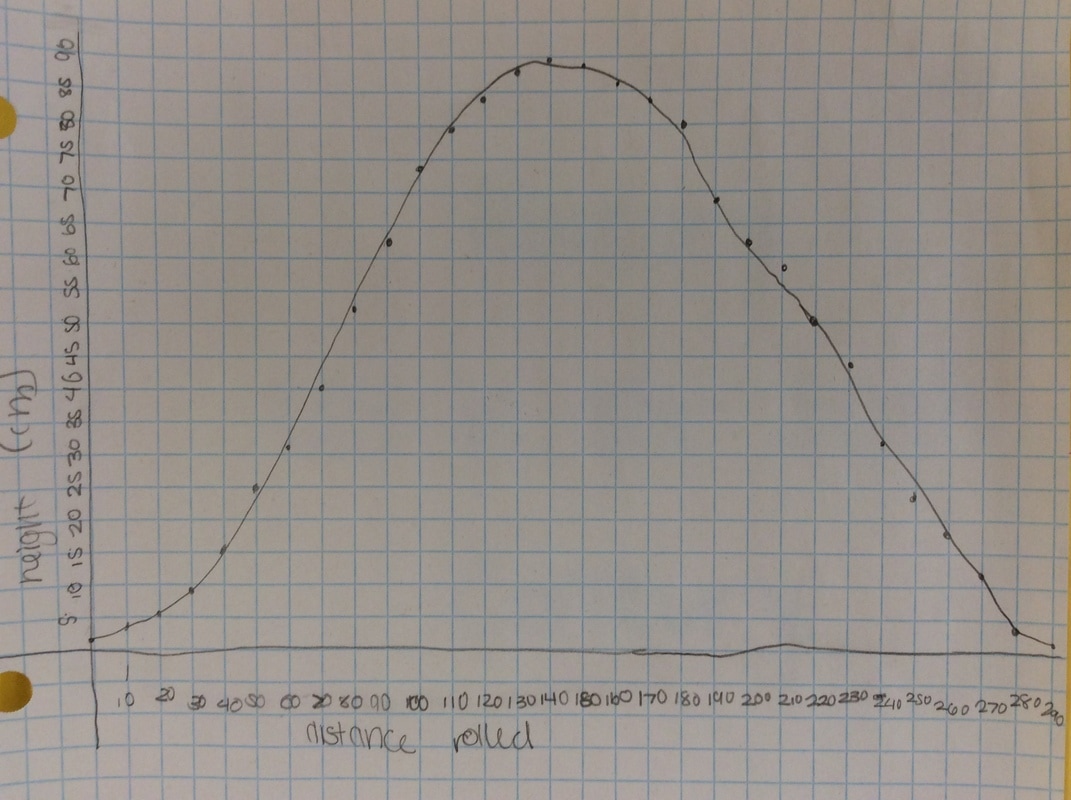
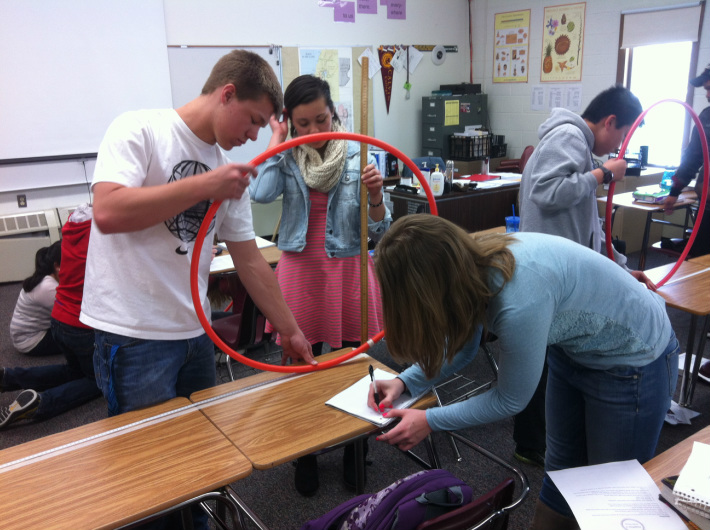
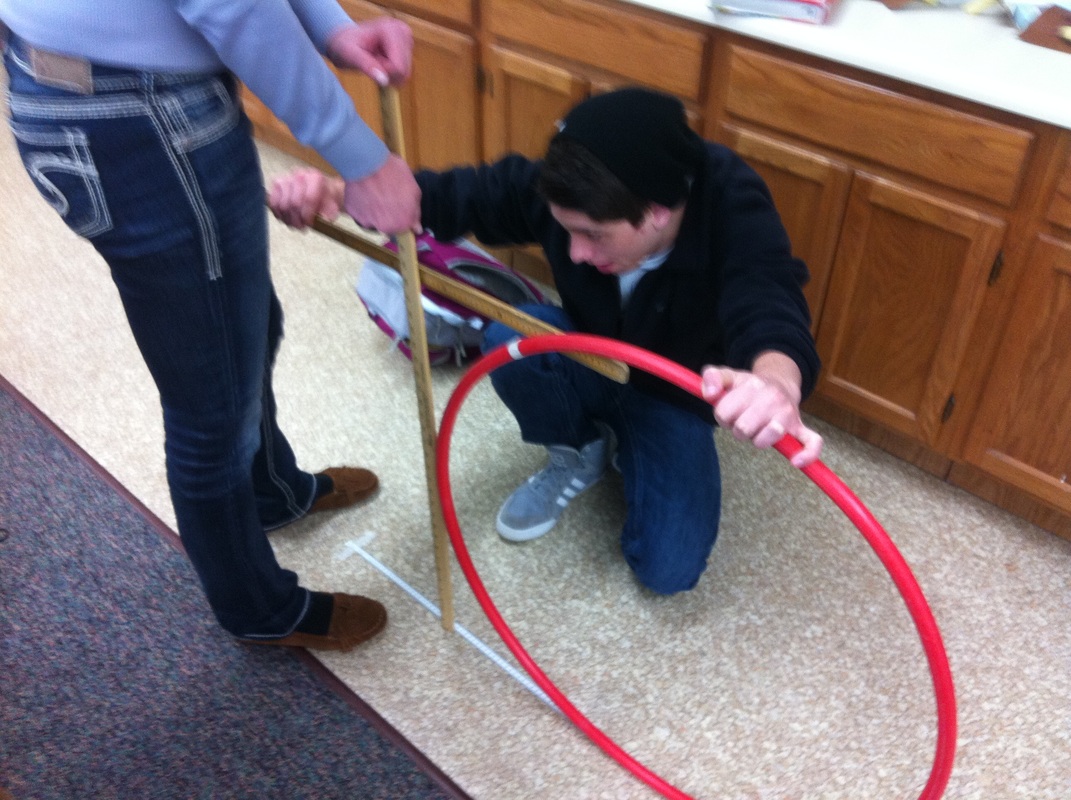
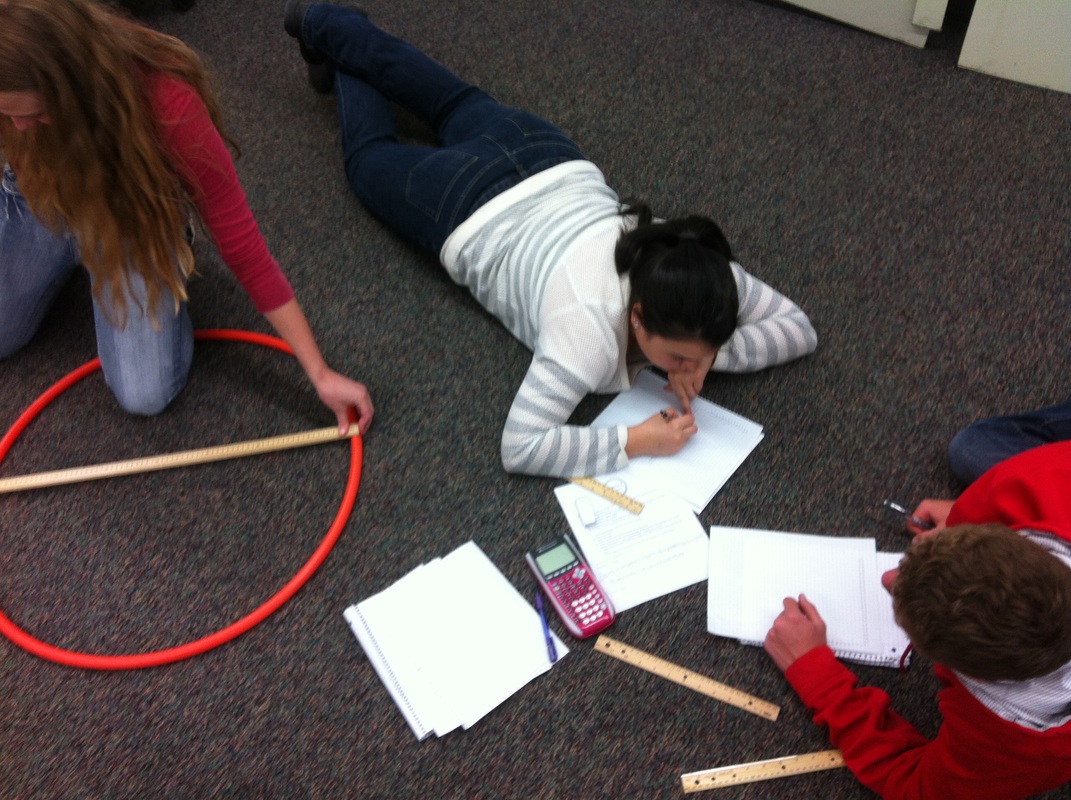
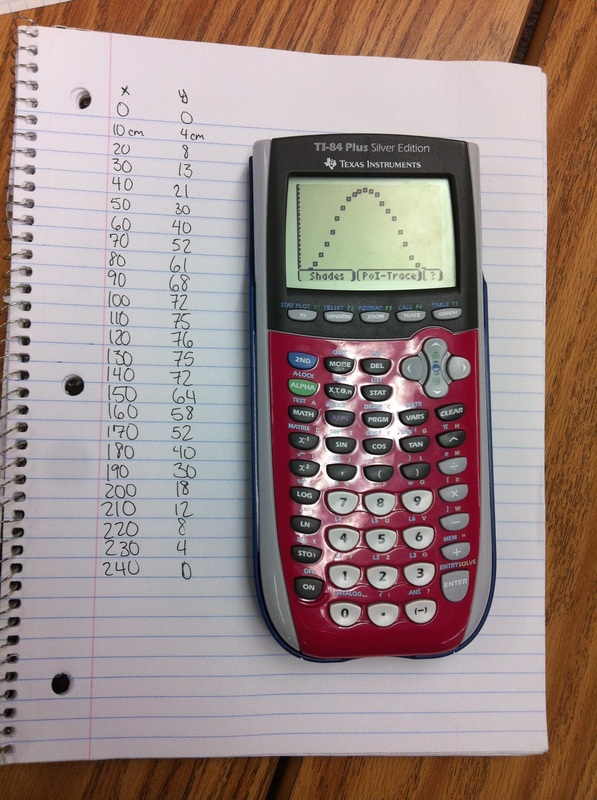
Q: If you were the person taking this video, what would the graph of your height look like? Sketch a graph. I get all sorts of mountain looking graphs or semi-circles. It's what I want. We are now going to get some intellectual dissonance. After students committed to a graph, we break out the hula hoops. I borrow them for a couple of days from our PE teacher. As an aside, I borrow stuff from the PE teacher and the science teachers all the time. Believe it or not, they are excited that your doing fun stuff in math class. They want you to borrow their stuff. Not kidding. We give a two-minute talk through regarding how we are going to collect data. Something like: Put some tape on the hula hoops and put a dot on the side of the hula hoop. This dot is you. Throughout the experiment, you will always measure the height of the dot. You will roll the hula hoop 10 cm and then measure the height of the dot. In cm. When you get to the end of your meter stick, keep your fingers on the bottom point and slide it back to the beginning of the meter stick. Do this for one complete revolution of the hula hoop/ferris wheel. Most groups finish with the data gathering in 30 minutes or less. As another aside, I have students start at the bottom, like they are loading onto a Ferris wheel. Technically, this will look like a cosine function with an a-value of -1. However, we're measuring height, which is a sine function. Whatever. In four years of doing this, I've never had it throw students off the scent of the math we're doing.
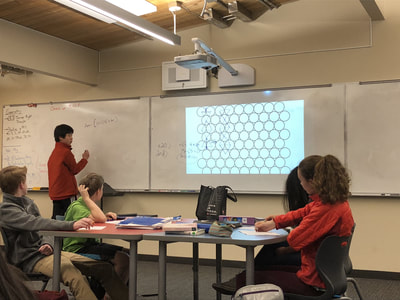
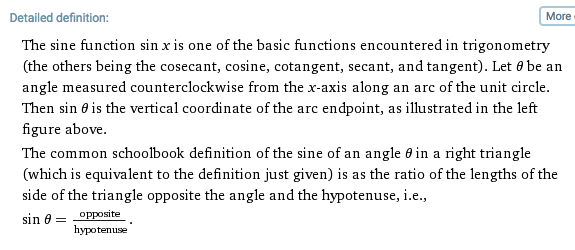
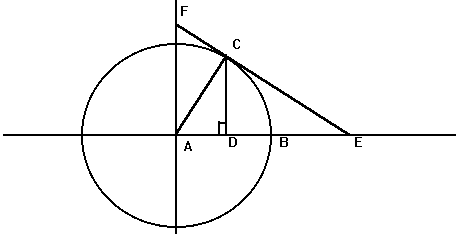
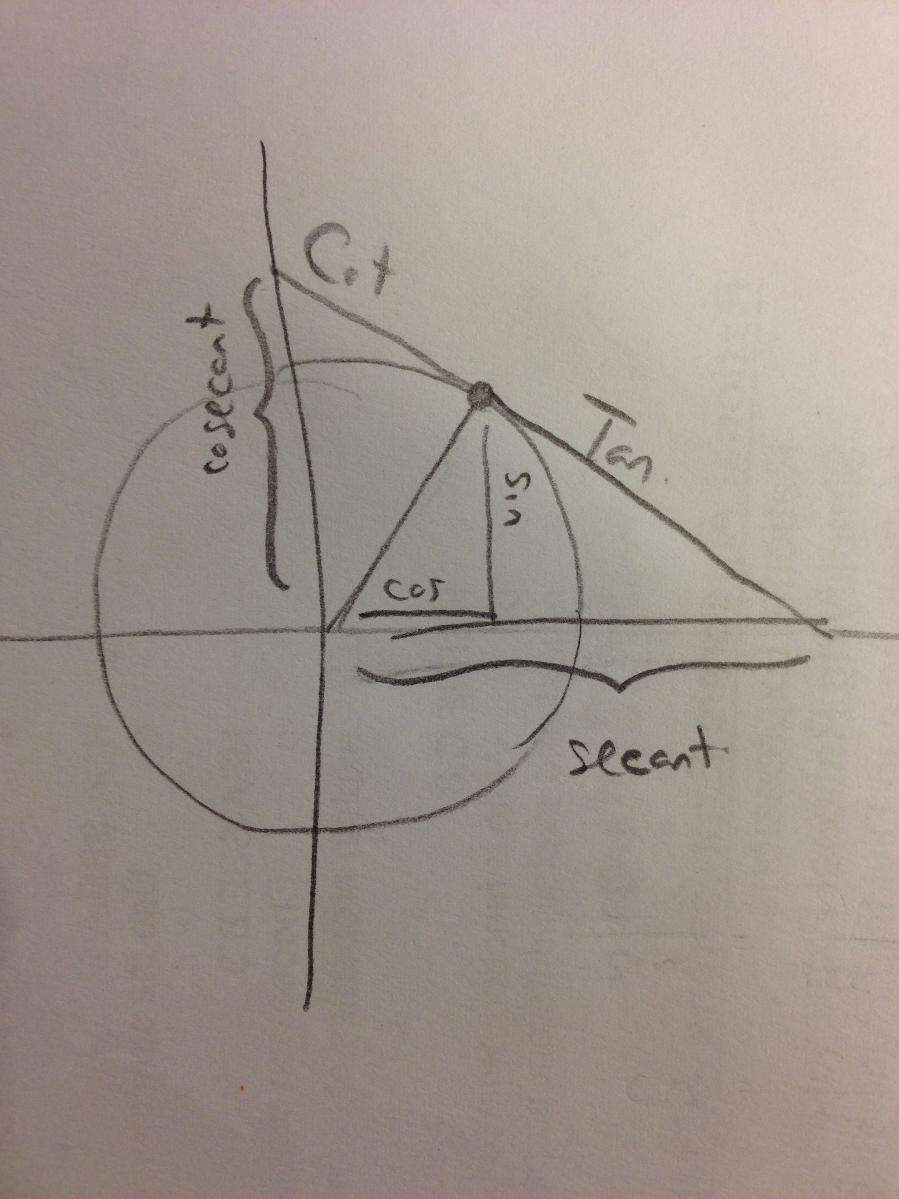
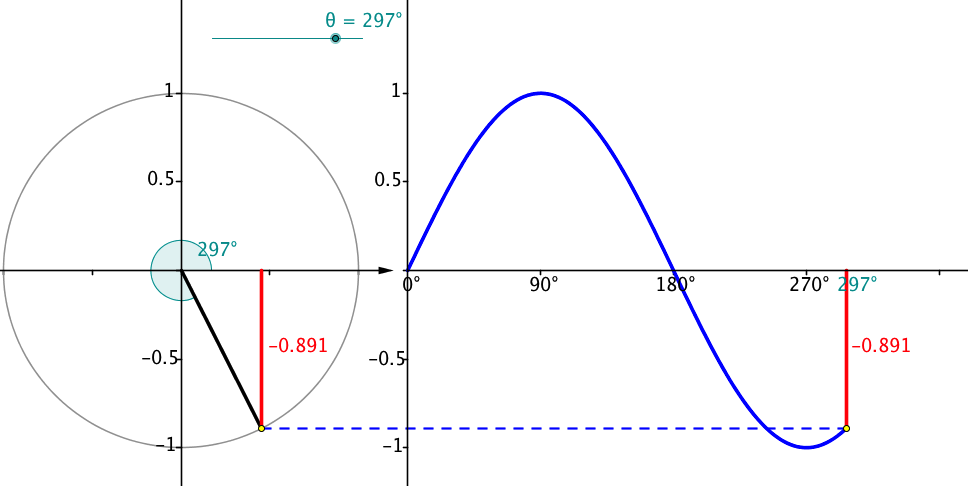
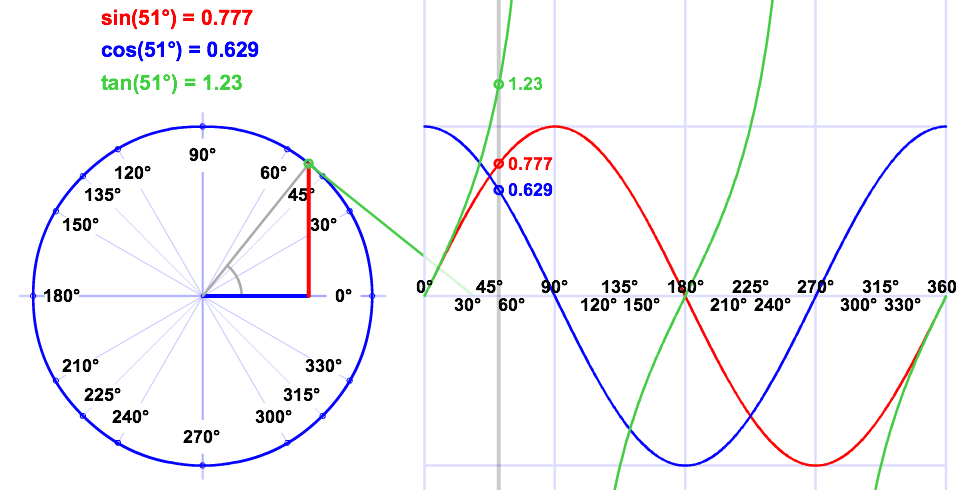
Here's some of the resulting graphs. I take pictures of some of the student work and we have a conversation about it. Q: What do you like or dislike about this graph? 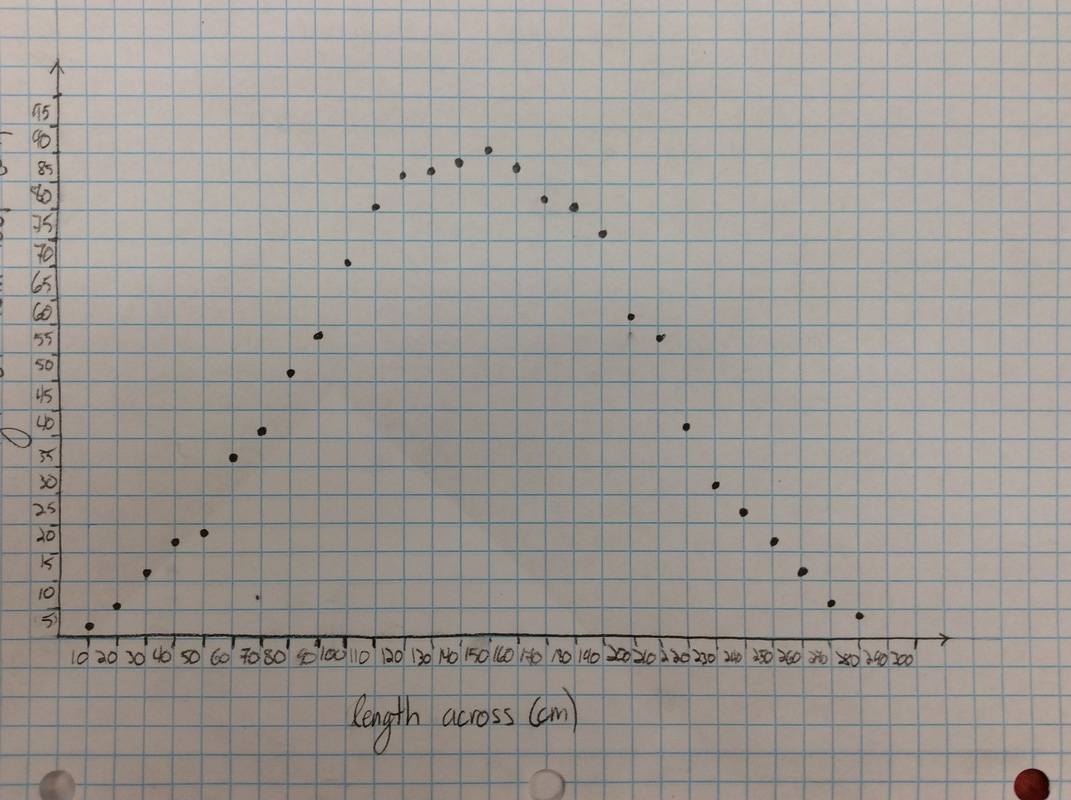 Students tend to not like the "lumpy" portions of the graph. I put the following graph on the screen in response. Students like this one much better. As if almost on cue, some student always says we should connect the points. Then we get to have a good discussion about whether the graph should be continuous or discrete. 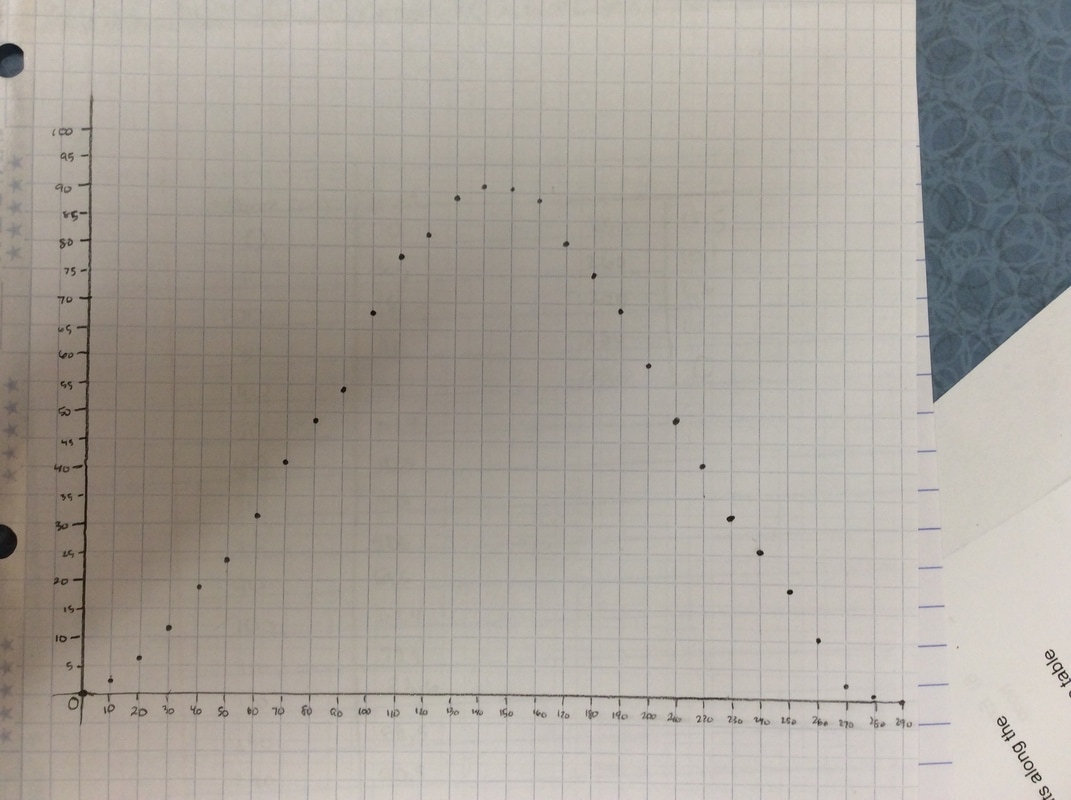 Students generally settle on the following as their "ideal" graph. We then talk about rate of change in table groups. How do you talk about rate of change with this graph? After flailing about wildly, we usually are able to give a decent explanation about whey when the point we are measuring is at the bottom or the top of the circle it doesn't have much vertical change in distance as opposed to when it is on the sides. Day 1 usually ends here and students finish their 7 questions on the handout. This year, Day 1 was half eaten by questions over a previous assignment and we gave up half of Day 2 to finish gathering data, graphing, and having this discussion. Day 2 begins with a discussion about the unit circle. The following is the definition of "sine" from Wolphram Alpha. Notice the first part of the definition. Forget the "common schoolbook definition". As a class, we define 'sine' as the vertical distance of a point on the circle to the x-axis and the 'cosine' as the horizontal distance of a point on the circle to the y-axis. It's *expletive* amazing! We talk about what this distance looks like when we move the point around the circle. Here's some of the web-based visualizations I use: Sine and Cosine as vertical and horizontal distances in the unit circle http://www.analyzemath.com/unitcircle/unit_circle_applet.html https://www.mathsisfun.com/algebra/trig-interactive-unit-circle.html https://www.desmos.com/calculator/v7x6br3w6a A visualization of Sine and Cosine in the Unit Circle: (If you want to moving one, click on the link below) http://i.stack.imgur.com/p8O4P.gif This is THE move that sets up everything! It sets up talking about sine and cosine as functions. It sets up a point on the unit circle being (cos, sin). It sets up the Law of Cosines not being some weird abnormality that's never really understood by students. It sets up that what we commonly refer to as trig ratios are lengths of lines in the unit circle. It also sets up any triangle with a hypotenuse other than 1 being a dilation of a triangle on the unit circle, with a scale factor of the length of the hypotenuse. Of course we end up deriving the shortcut methods for finding sine, cosine and tangent without having to go back to the unit circle every time. However, the fact that these are real lengths and not just abstractions goes a long way with my concrete learners. Sine is a vertical distance. Cosine is a horizontal distance. Tangent is the distance from the tangent to the point on the circle to the x-axis. Which is why tangent of 90 degrees and 270 degrees is undefined. This also helps discuss Cotangent, Secant, and Cosecant when they come up later in the year. They are all actual lengths in the unit circle!
If you're teaching Algebra 2, after this throw in a little Cosine Ferris Wheel from MARS and you've got yourself a decent start to a trig unit.
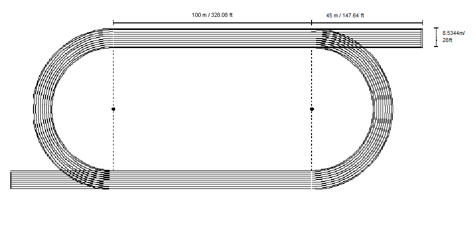
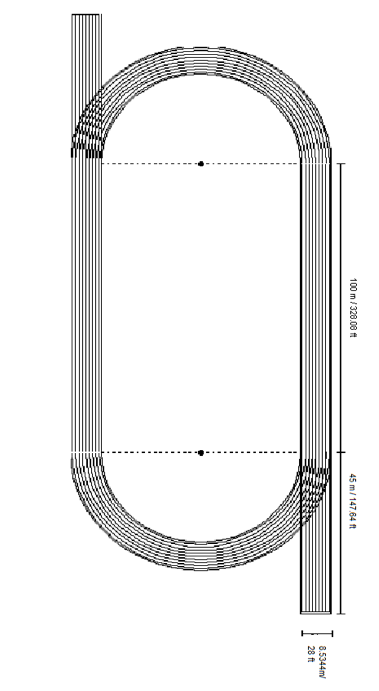
Okay, here's an example where "real life" math needs a little help. I was thinking about a problem I assigned last year during track season. I really really like the problem (adapted from emaths). The task: Fielding Nair International (FNI), the company renovating our school, is also contracted to build new tracks at several of the Boulder Valley area schools. BVSD wants FNI to plan and construct new tracks that meets the criteria of the NCAA. The track will consist of two straight sections and two semicircle curves. Although FNI’s blueprints contain the dimensions of the track, they are still in need of assistance on some crucial aspects of the track design. I've got a bigger picture of the track at the end of this post.
I don't know if you can see the numbers in the picture very well--they're not regulation track size. The straightaways are 100 meters each and the straight extensions past the curve are 45m. Definitely not regulation. The whole time, I'm not kidding here--the ENTIRE time we do this problem students ask me whether these are the real track dimensions. I don't know what to say. Do I just lie to them? Do I tell them we're doing a problem similar to the one the builders will do just with easier numbers? Here's the real difficulty for me. Kids struggled with this. They persevered. They figured out how to use trig and sections of circles in order to not have any overlap when figuring out the track surface area. I. Love. It. After finishing, the students were happy the numbers were easier. But during the process, they wanted the work to mean something. Would the problem work better if I went completely "real world" or do I leave it in its current "sudo real world" state?
Right off the bat, let me say that I like trig. Or at least I like all the triangles and the easy applications for finding all sorts of lengths. Students in my classes generally like that too. What they find difficult, however, is translation of trigonometric functions. I mean, who looks at y = a*sin([p/(2pi][x-h])+k and says "ooooh I want to do that"? My students initially look at that and panic. You think I'm kidding. This year I hope to change that--I'm stressing transformations for every family of functions we look at rather than limiting it to the chapter dealing with transformations of functions. Those of you with access to Desmos think that's easy. Without student devices I can tell you it's not. I'm also introducing trigonometry by embedding it in the unit circle. If all of the triangles we look at are always brought back to the circle, then all of a sudden the Law of Cosines isn't such a big deal. Shifting functions up, down, left, and right is less scary (I hope). Anyway, that's all to say we starting looking at trigonometry today by playing with hula hoops. We started the class talking about what students remembered about trigonometry--just to get the proverbial wheels turning. They started off slow but then started picking up steam. Then I threw a stick into the spokes: we're going to start talking about trigonometry by looking at circles. We watched the following video: Me: If you were the person recording this video, what would the graph of your experience look like? Guess. Try to sketch it. Student1: How do we graph that? Student2: What are the variables? Me: So you have to identify your independent and dependent variables? (I probably gave too much away there). Student3: Time! Student4: Height? Student2: Are we assuming constant speed? Me: Sure, I think we can make that assumption. Students gave a lot of triangle-looking mountains as graphs. Brilliant. Me: We're going to refine our ideas by making our own Ferris Wheel out of a hula hoop. *cue student rejoicing*
We ran out of time to formalize what I wanted to talk about with them. Finishing the questions on the lab/worksheet was homework. The next day we started class by having students show their graphs. Some student had graphs looking kind of like a bell curve and others had graphs looking like a sine curve. They quickly came to the conclusion that this difference was due to where people started measuring from--either halfway up or from the bottom. Me: So if trigonometry is about triangles, where are the triangles in our circle? Enter Geogebra and interactive websites:
These led to some great conversations about the geometric nature of sine, cosine, and tangent (not to mention cosecant, secant, and cotangent). Sine is the vertical distance of a point on the circle above the x-axis. Cosine is the horizontal distance of a point on the circle from the y-axis. Tangent is the length of the tangent through the point on the circle to the x-axis. Then we talk about ratios, SohCahToa, and solving triangles using neat stuff like: Introducing trig this way adds extra day to the crazy end of the year I-can't-believe-we-had-more-than-10-snow-days blitz to try to cover all the standards. What I hope is that it deepens student understanding and cuts down on the number of days we need to review these concepts.
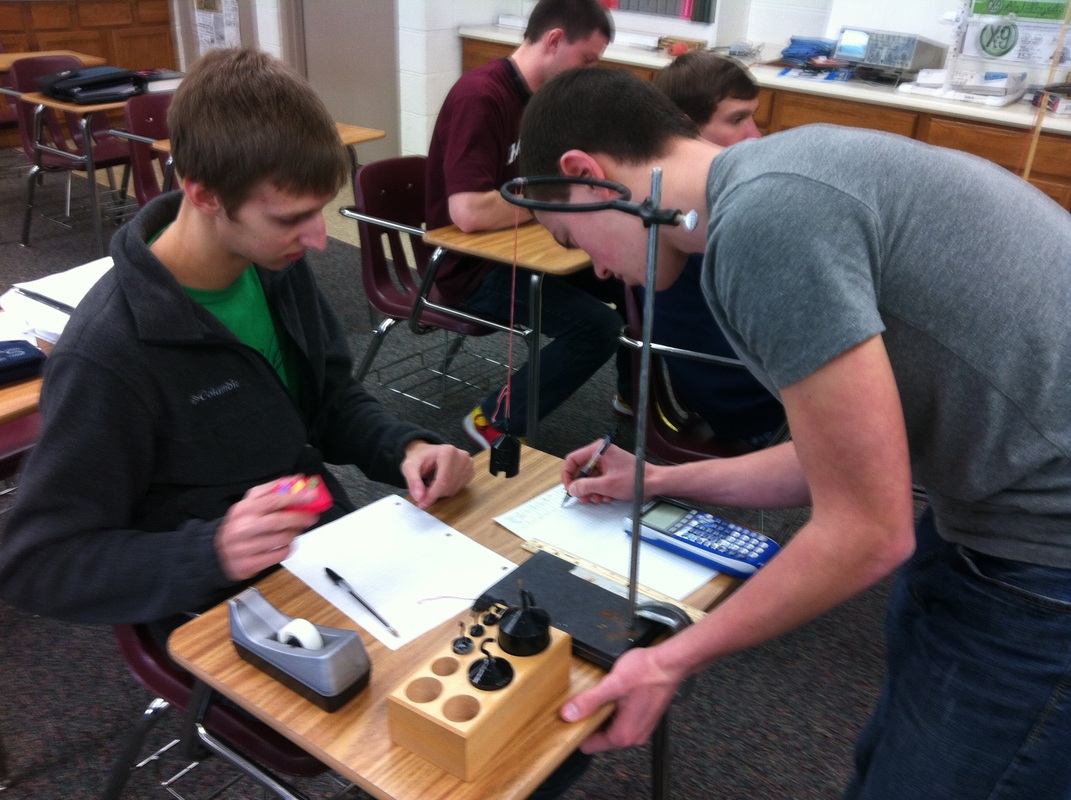
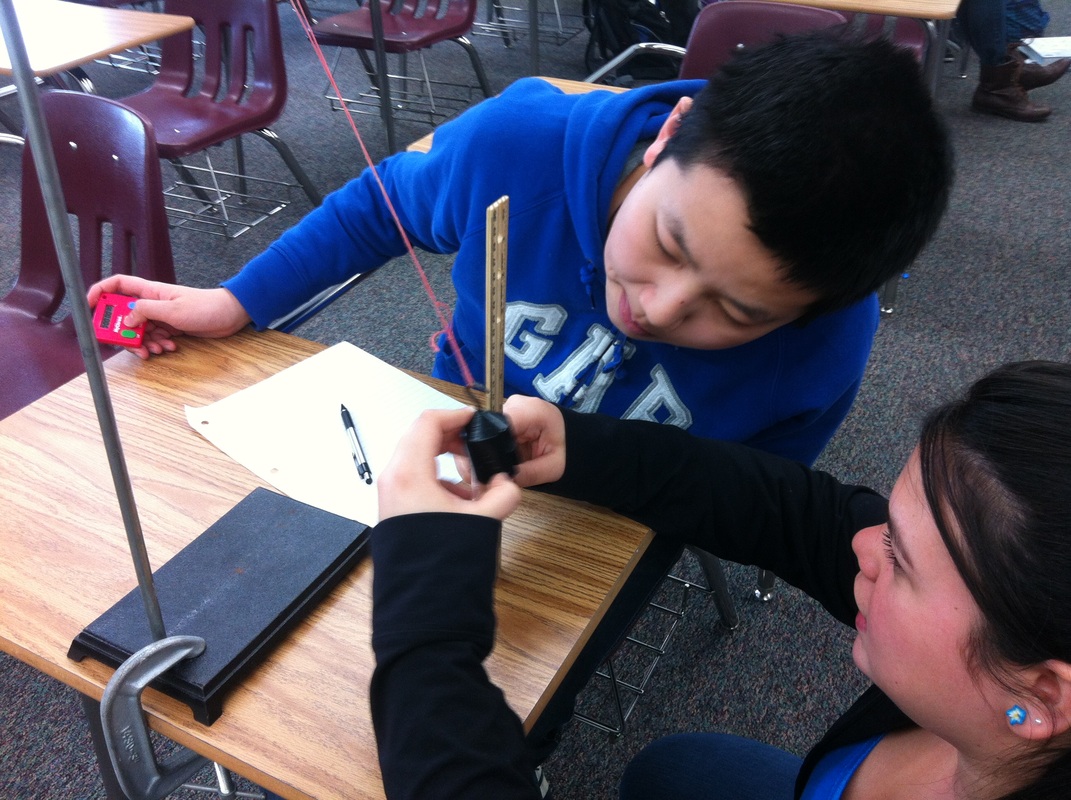
We just finished looking at wave motion. To start, we looked at pendulums and the relationship between the period, the amount of weight, and string length. A couple of stop watches, ring stands from the chemistry lab and weights borrowed from physics and we were good to go. It adds an extra day on the front end but I think it helps my students get a better understanding of what's going on, plus it's fun/interesting. Fun/interesting is an core objective in my class. While I was shopping for supplies in the physics lab I stumbled upon a spring weight set. I couldn't help myself. I set up some demo videos of pendulums and springs for the students to model. Since my students aren't equipped with laptops, tablets, or the like, I needed some other way to get them the data. I ended up using and Physics Video Tracker to get a data file. Then I imported the data into a Geogebra spreadsheet in order to plot the points and create a data file for the students. I only have 42 minute classes, so any time wasted means multiple days on the same concept. I only have two days budget for the modeling aspect of this exploration of trigonometric transformations. The first two files have sliders for all the variables. The last several do not. I required each student to come up with 4 equations. Two from the easy column and two from the not-so-easy column. We were able to complete the modeling portion lesson and a summary classroom discussion within two class periods. Not bad. Not bad at all. Trig Transformations--Pendulums and Spring Weights
|
Andrew Busch
I teach Math at Ralston Valley High School in Arvada, CO. Categories
All
Archives
March 2019
|
||||||||||||||||||||||||||||||||||||||||||||||||||||||||||||||||||||||||||||||||||



 RSS Feed


