|
The good folks at Kent Innovation High @innovationhigh posted a video challenge on #MichEd to highlight what we do in our classrooms. This year I've been intentional about incorporating experiments and rich tasks. It's been a lot of work and a lot of fun. Here's my submission:
0 Comments
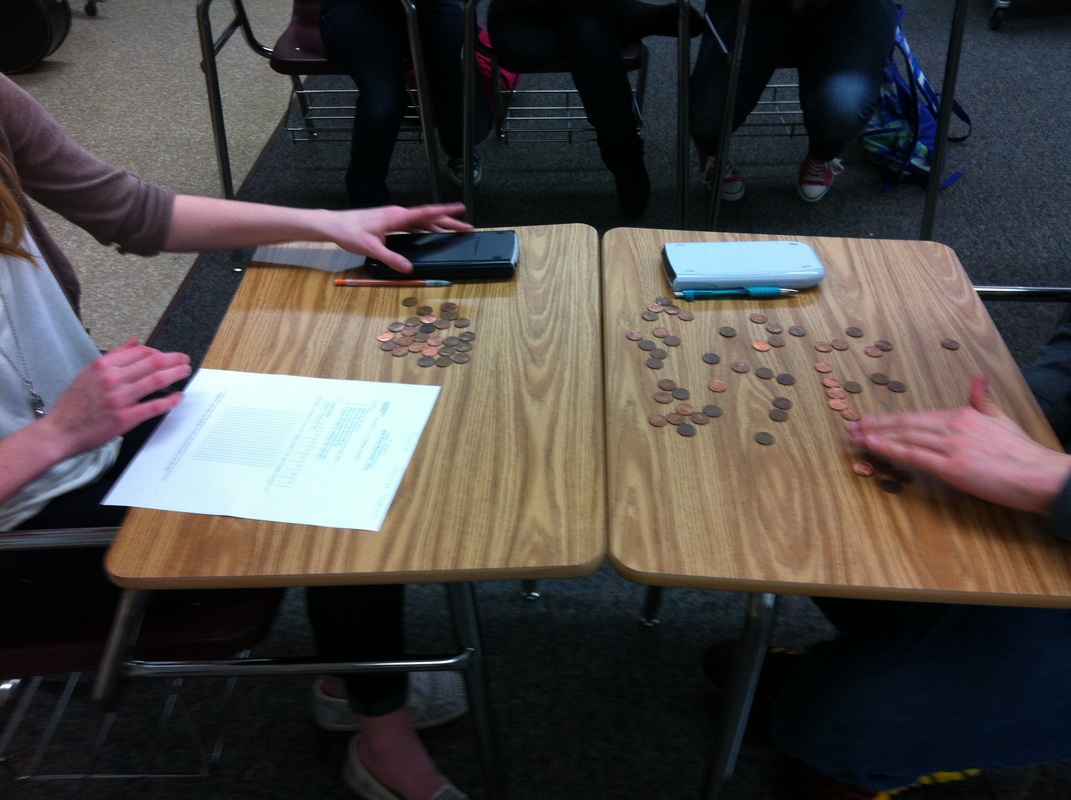
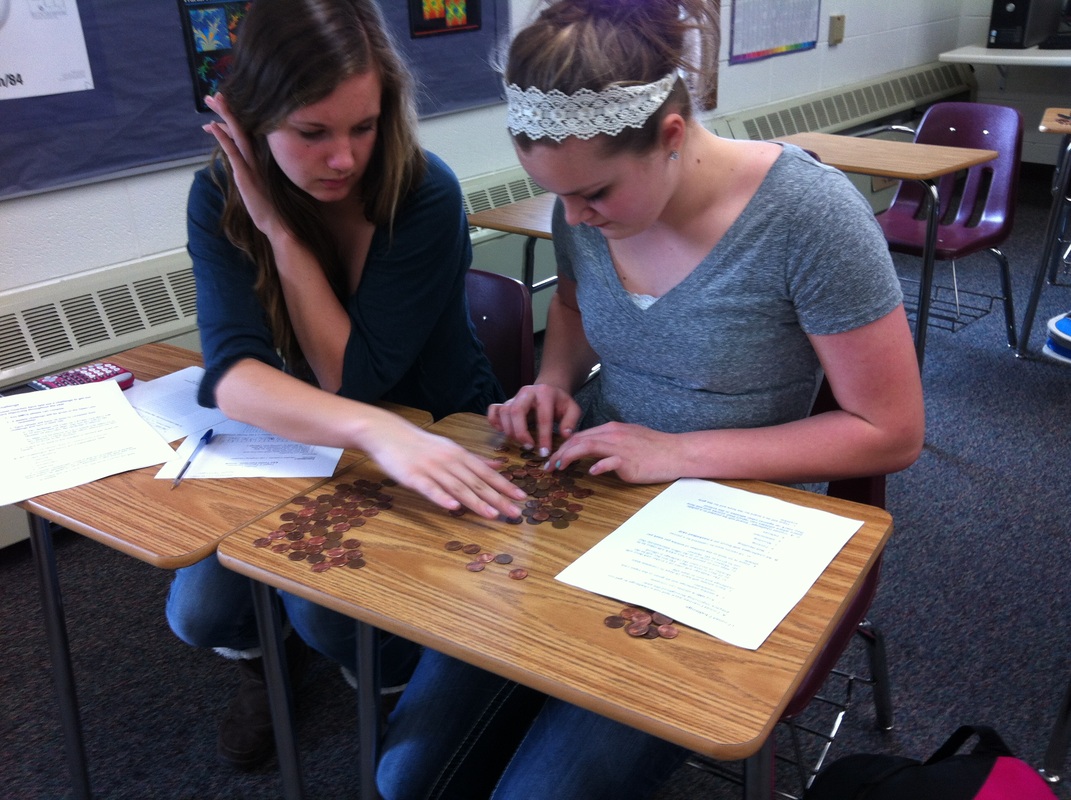
After students get somewhat used to exponential functions and nice neat numbers, I like using this activity. It helps students use what they know about a situation to come up with an ideal equation but then to fiddle with it in order to find a better fit. The process begins by pairing up and playing with pennies (my handouts are at the bottom of this post). I need to be up front with you--you need a lot of pennies. I have a large yogurt container full of pennies and I normally run out. Because I don't have an infinite supply of pennies I have groups alternate whether they start with the growth or decay portion of the activity. To model growth, each group starts with 10 pennies and then drops them on the desk. Students count the number of pennies heads up and then add that many pennies to the next drop. This process happens a total of 7 times and by the end groups have a desk full of pennies. Think of a lot of pennies, then think bigger. My highest group had something like 220 pennies by the end. To model decay, each group starts with 100 pennies and then drops them on the desk. Students count the number of pennies heads up and then takes away that many pennies for the next drop. Again, the process happens 7 times. This one is a whole lot more manageable. By the end it's not unusual for groups to have a 0 as the last value in the table. After collecting the data, students come up with an ideal equation to model the situation. We have to talk through this one. Students should not use the information in their tables to find this equation. I want them to think of the situation and tell me what the equation should look like: growth, y=10(1.5)^x and decay, y=100(.5)^x. Then I have students use their calculators to create a scatterplot of the data and graph the equation at the same time (step-by-step instructions on the handout). This is where we talk about needing to find a better equation. Some students use their tables to find and average growth factor. Some students just tweak the equation on the graphing calculator. Either way leads to a good discussion of the process of modeling and the messiness of real data. The kids have fun. I have fun. And it all happens in 42 minutes.
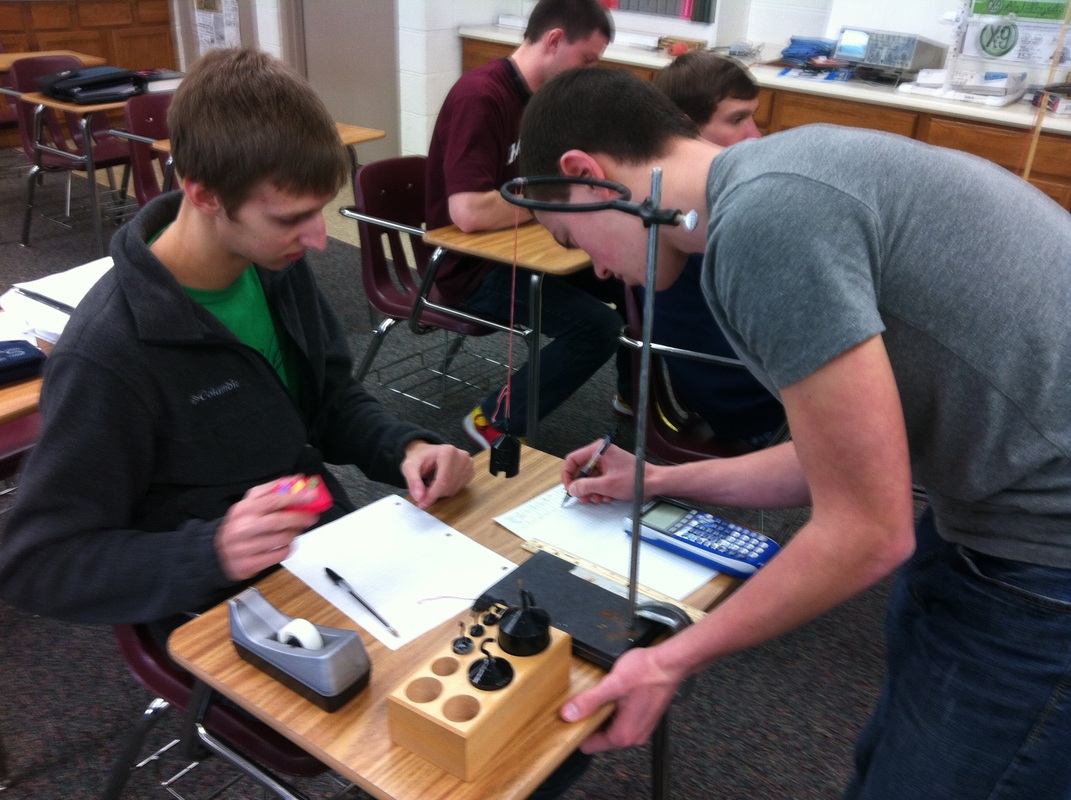
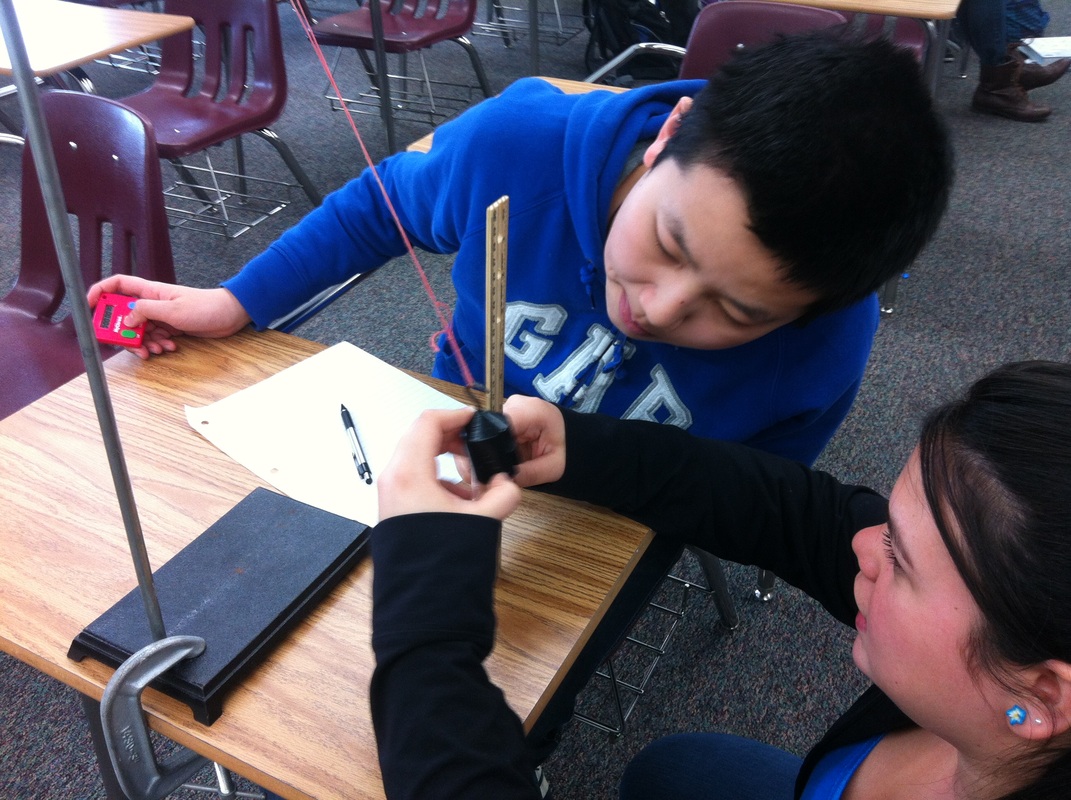
We just finished looking at wave motion. To start, we looked at pendulums and the relationship between the period, the amount of weight, and string length. A couple of stop watches, ring stands from the chemistry lab and weights borrowed from physics and we were good to go. It adds an extra day on the front end but I think it helps my students get a better understanding of what's going on, plus it's fun/interesting. Fun/interesting is an core objective in my class. While I was shopping for supplies in the physics lab I stumbled upon a spring weight set. I couldn't help myself. I set up some demo videos of pendulums and springs for the students to model. Since my students aren't equipped with laptops, tablets, or the like, I needed some other way to get them the data. I ended up using and Physics Video Tracker to get a data file. Then I imported the data into a Geogebra spreadsheet in order to plot the points and create a data file for the students. I only have 42 minute classes, so any time wasted means multiple days on the same concept. I only have two days budget for the modeling aspect of this exploration of trigonometric transformations. The first two files have sliders for all the variables. The last several do not. I required each student to come up with 4 equations. Two from the easy column and two from the not-so-easy column. We were able to complete the modeling portion lesson and a summary classroom discussion within two class periods. Not bad. Not bad at all. Trig Transformations--Pendulums and Spring Weights
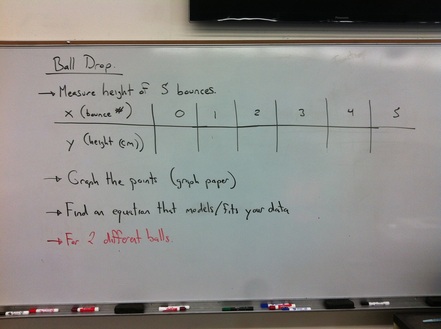
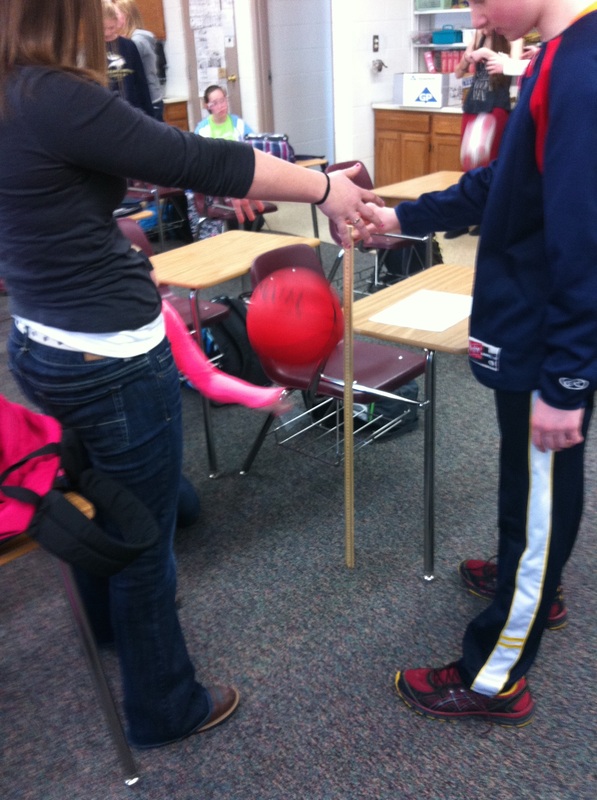
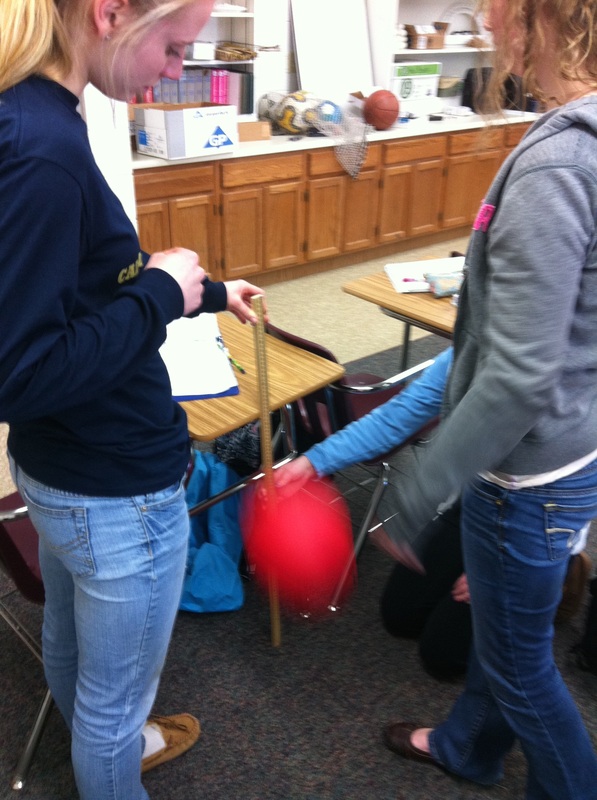
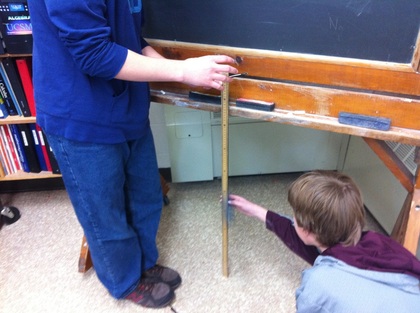
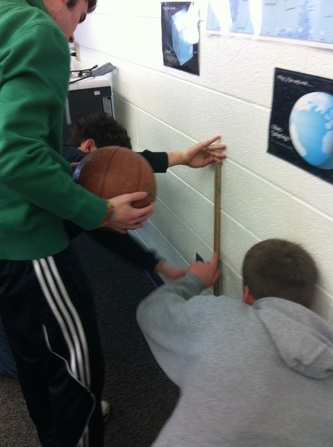
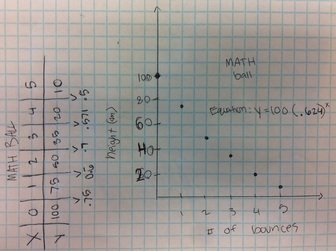
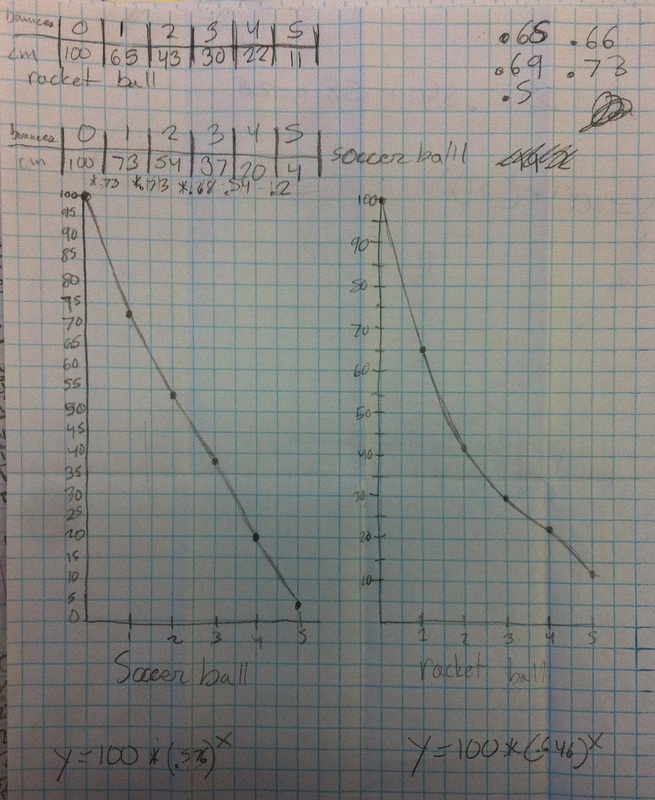
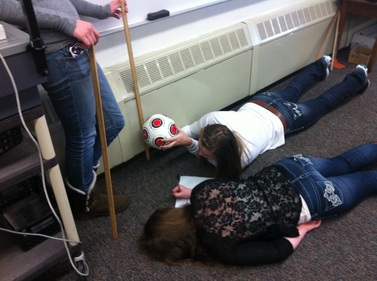 I absolutely love it when kids are out of their seats in my class... and on task. There was a point in class today where almost all my students were laying on the floor trying to figure out the height of the ball bounce. How cool is that? The lesson is pretty basic. I wrote up the lesson requirements on the board (see picture below). I'm not proud of it but it's all I had today. Note: even though we've been doing experiments all year, Algebra 1 still needs the suggestion to make a table; thankfully Algebra 2 does not. Gathering Data: For the record, I would like to say that Freshman are awful at measurement. No matter how much we talk about precision, these kids coudn't get a correct height if their grade depended on it (it doesn't by the way). For all of our experiments/activities we measure in centimeters. Some of their measurements were at least 15 cm off. Really? When analyzing the data, groups were pretty quick to realize that picking two random points to find the multiplier wasn't all that accurate. Several students suggested finding the multiplier between each successive bounce and averaging them; I felt like a proud parent. Then they proceeded to make linear equations using the multiplier like it was the slope; I no longer felt proud. We've still got work to do but at least we're having fun doing it. Things have been more than a bit busy up in my neck of the woods. I feel like I'm doing good just to keep getting the kids out of their seats. Deep in my heart I know there must be a good question I can ask at the beginning which will elicit curiosity; I just didn't have the time to think of one. I'm all ears to those of you who have done this before. Luckily for me, playing with balls during math class was enough of a motivator for the students.
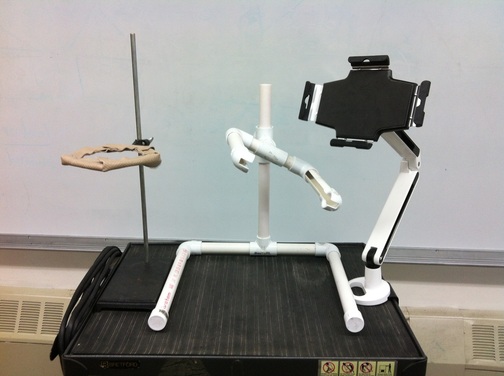
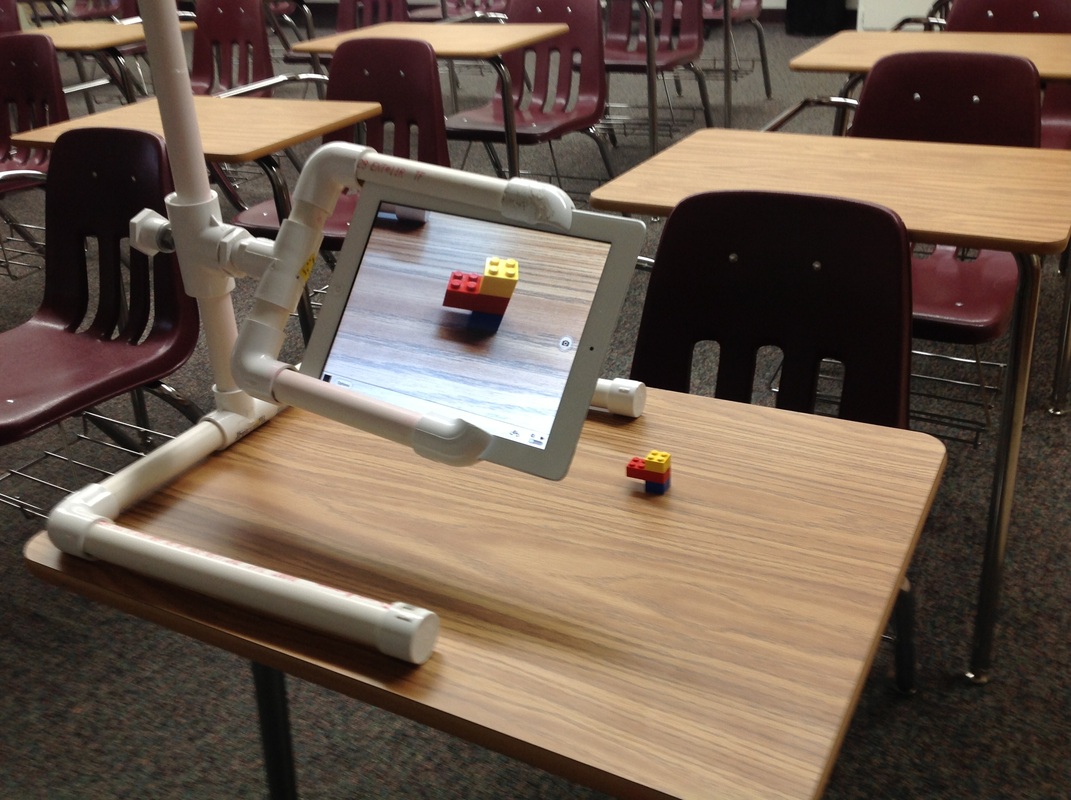
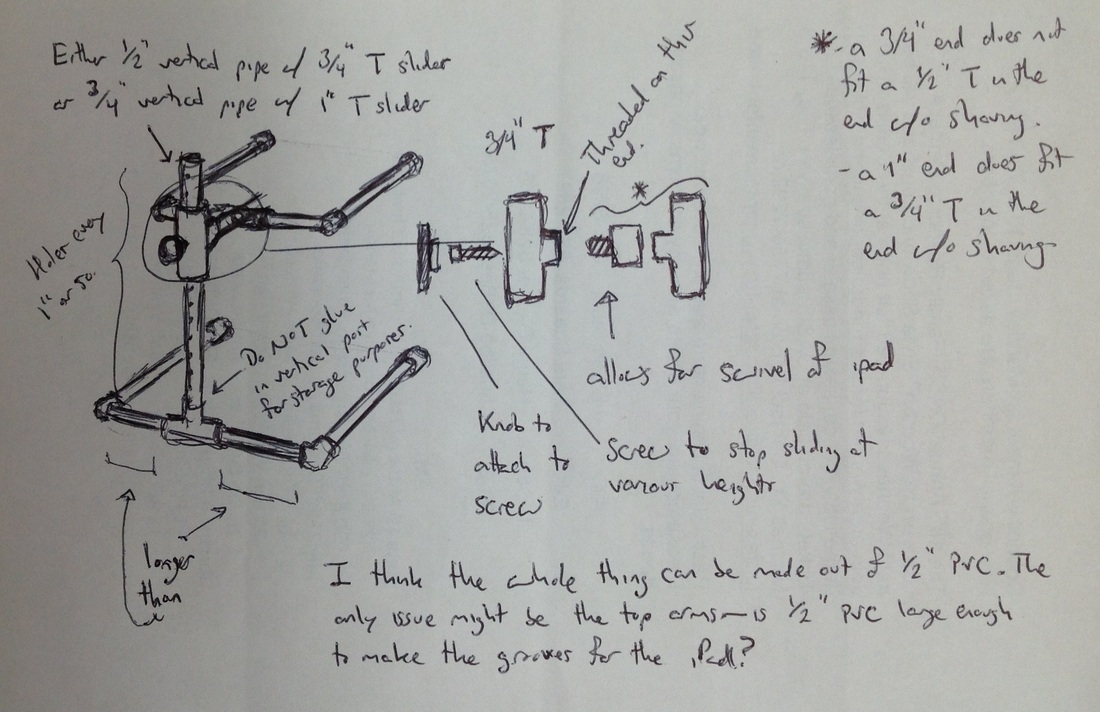
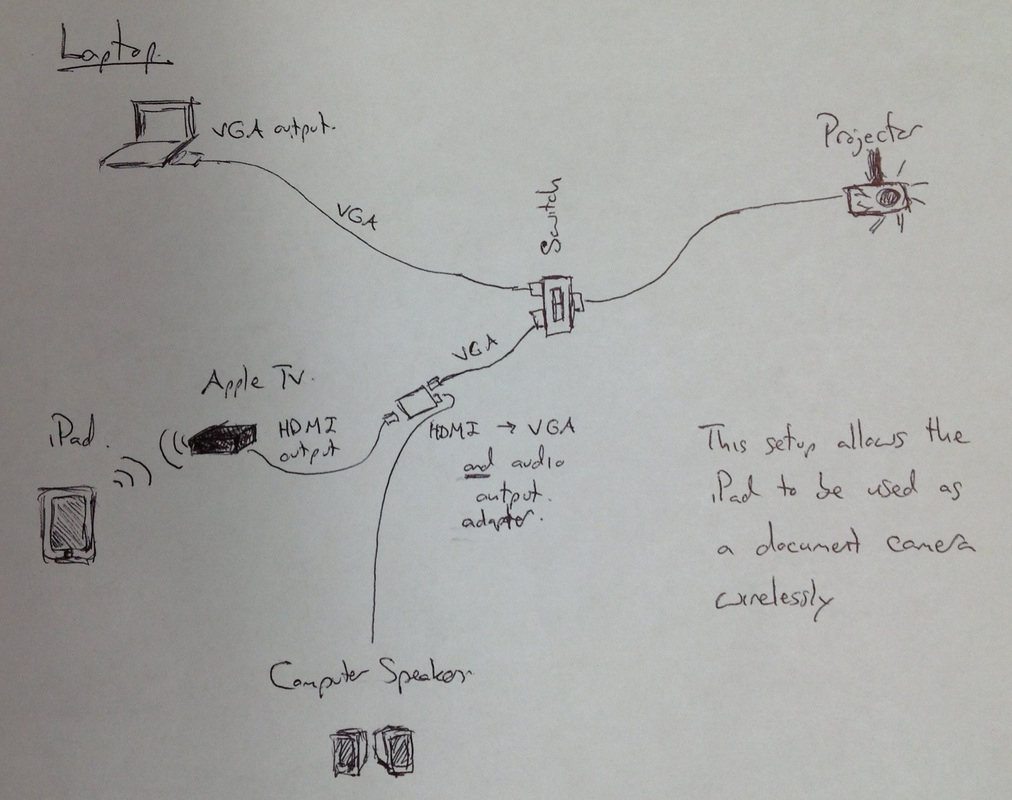
"We all want students to see relationships between the world around them and the math they learn in school. We want them to become curious—seeing math as a tool to aid in their explorations. As my classroom incorporates rich contexts and experiments, I’ve found even a single iPad to be an indispensable tool both in mathematical modeling and classroom discussions." I presented at MACUL 2014 on how I use technology in my math class. For those of you who don't have access to the conference app, I thought I'd post my materials online as well. Presentation as pdf Along with incorporating technology into my classroom there has been a process of working out the kinks. You can see the process pretty well in the evolution of my classroom iPad stand. Here are more detailed instructions for the DIY iPad stand. L: Ring stand, M: D.I.Y. PVC version, R: MaxCases Handstand DX
|
Andrew Busch
I teach Math at Ralston Valley High School in Arvada, CO. Categories
All
Archives
March 2019
|
||||||||||||||||||||||||||||||||||||||||||||||||||||||
 RSS Feed


