|
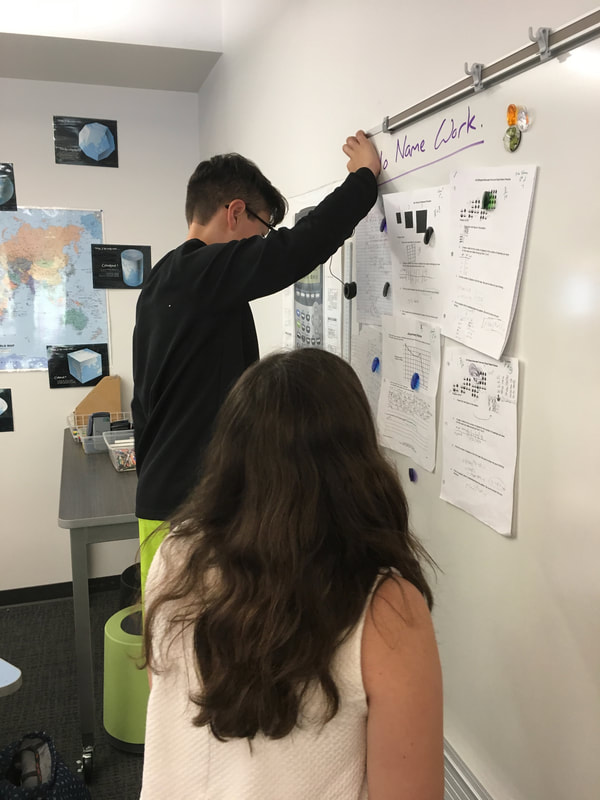
I'm struggling to find time to write thoughtful posts. But I am taking pictures. Here's some fun shots of our Ball Drop experiment in Algebra 1. Let's be real for a second--alternative assessments are really hard in secondary math. I have like 87 objectives and you want my kids to make a poster? For real? I've tried doing them a couple of times over the years, but they were usually such bad initial experiences I've stuffed all memories of them deep into my mental closet. This project is the exception to the burn-the-lesson-plan-to-get-rid-of-all-evidence I've come to expect from my attempts at alternative assessments. This is my 3rd year doing this project. Apparently, the 3rd time is the charm. I posted about my experience last year here. You can smell the fear in that post. At this point in quadratics, we've covered: graphing, factoring, the quadratic equation, vertex form, and transformations. What I really want is for students to see the connections between multiple representations. I want students to see that you can find the roots from the graph in Desmos. Those roots are the same as the roots in the factored form of the equation. Those roots are also the solutions to the quadratic formula. Slowly, we're making progress. Here's the rough outline of the project: 1) Find a "real-world" example which you can fit a parabola to. If you want to fit a parabola to Payton Manning's forehead, or Donald Trump's smile, or some other hilarious thing, that's fine with me--you'll just lose the "real-world" point. 2) Fit a parabola to the image using vertex form. 3) Show all points of interest on the Desmos graph (roots, y-intercept, vertex, axis of symmetry) 4) Demonstrate you know how to calculate the a-value for the vertex form of the equation using the vertex and a point. 5) Show me you know how to find the factored form of the equation from your Desmos graph. 6) From either vertex or factored form, calculate standard form of the equation. 7) From the standard form, show me you know how to calculate the vertex of the parabola. It should be the same vertex as your graph. 8) From the standard form, use the quadratic formula to calculate the roots of the equation. These should be the same roots as your graph. 9) Put your name on the back of the poster so I can take pictures of your work and put them online without worrying about student identities (that's one of the reasons at least). Let's talk pacing for a moment. I give two work days in class for this project. On the first day, we intro the project, work on finding a super cool picture, and fit a curve to it (#1-3 above). On the second day, we work on doing the math and I hand out poster board to students. I have the project due several days after our second work day. There is no time to work on the project on the due date. Students waltz into class, I collect the posters, and we delve into radical functions. Next time, I will strongly suggest to students that it's worth it to do the work before starting on the poster board. I made a template for next year (below this paragraph). I'll probably import it into a Google Doc to encourage students to type out their work. Typed posters are usually much nicer to look at than the scrawl of most of my students.
If you're interested, here's my files for the project. The directions on the left are what I hand out to students. The checklist, which is included in the directions, gets paper clipped to the front of the poster so I can evaluate student understanding without writing all over their beautiful projects.
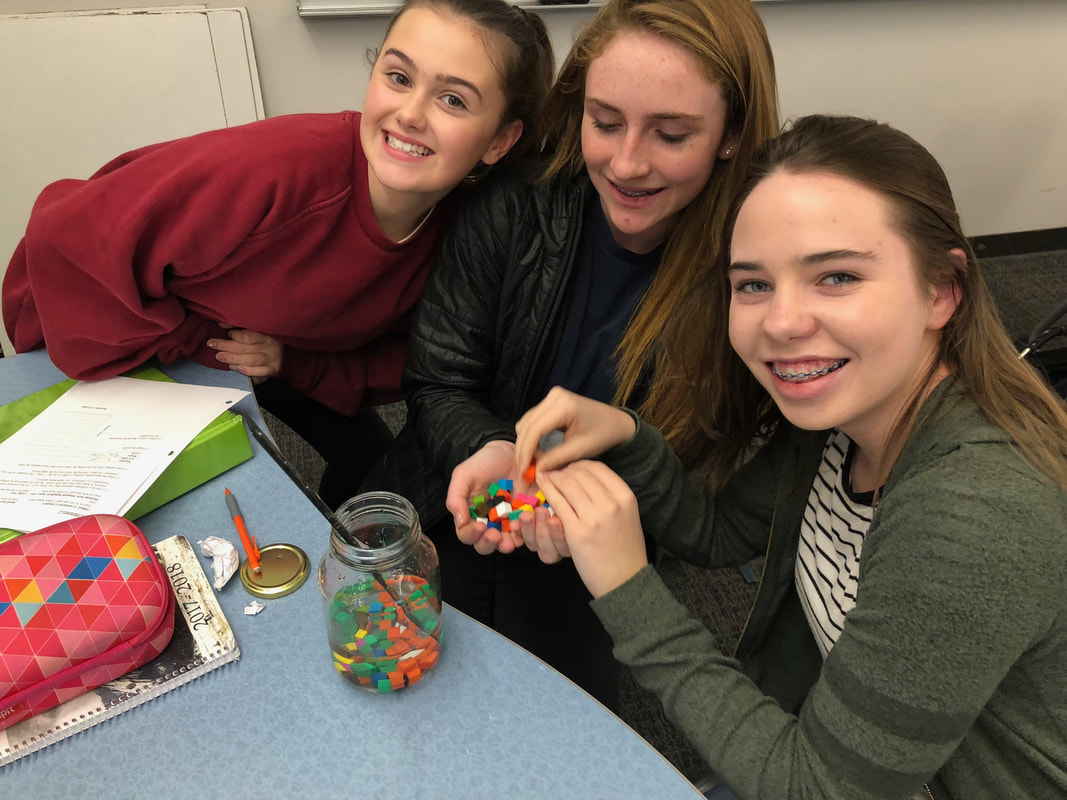
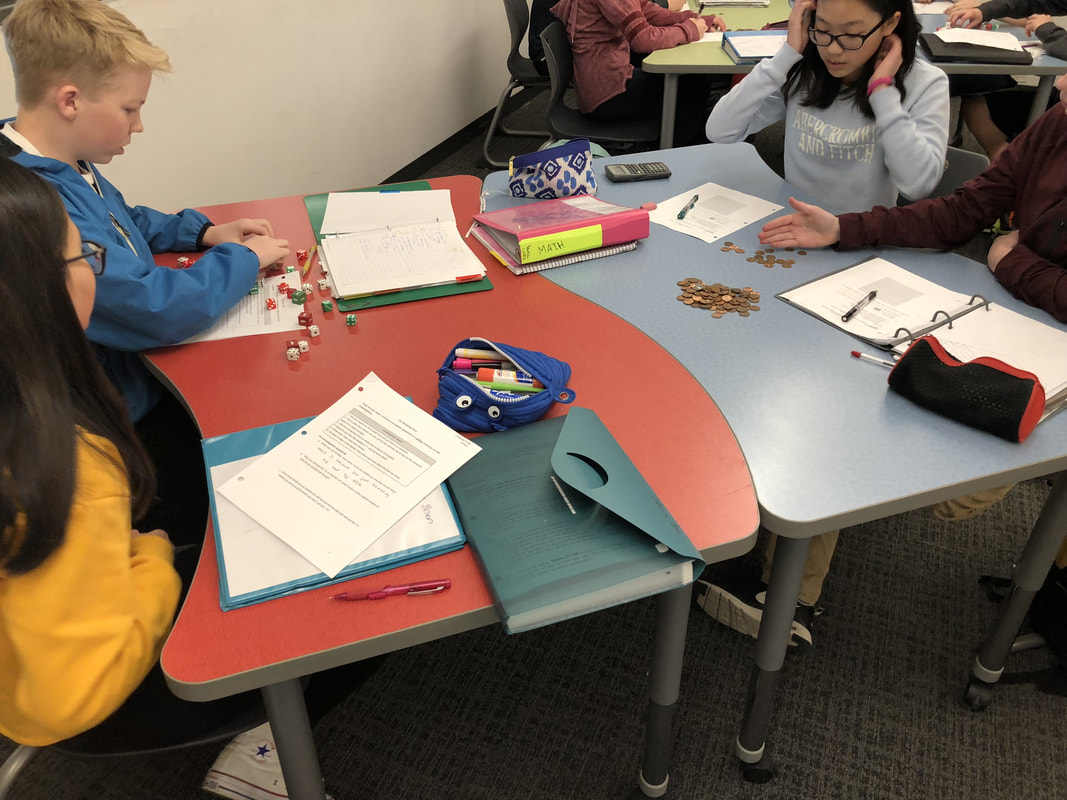
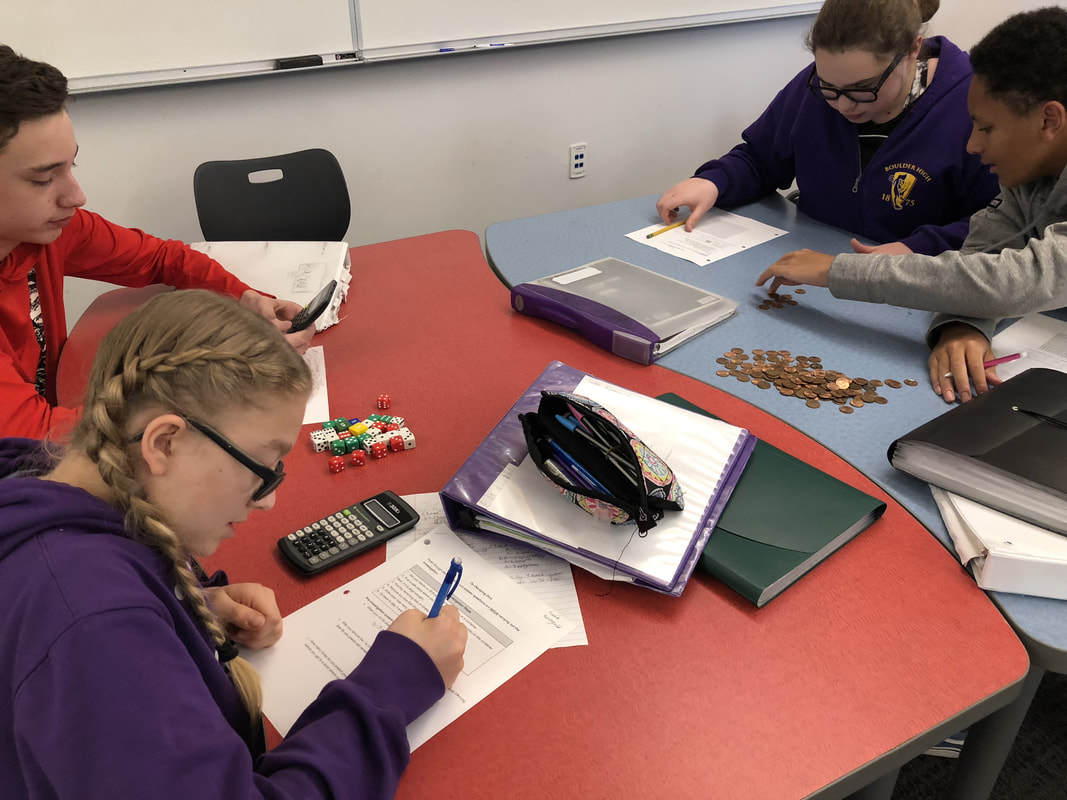
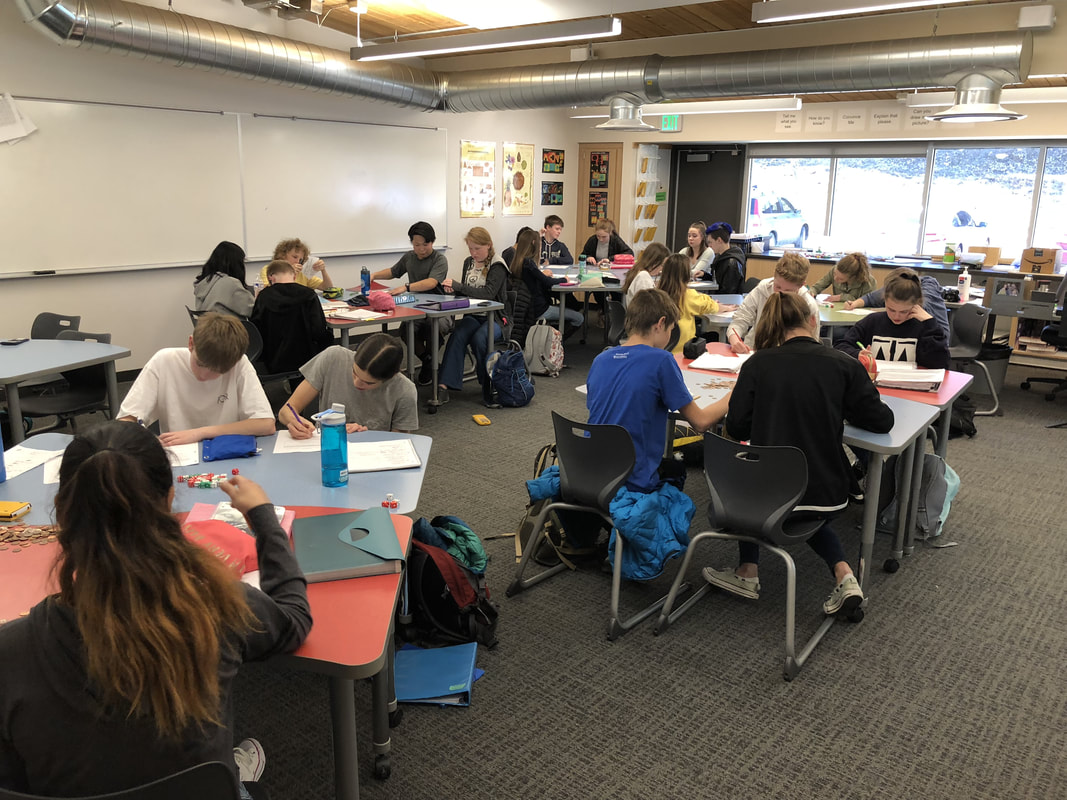
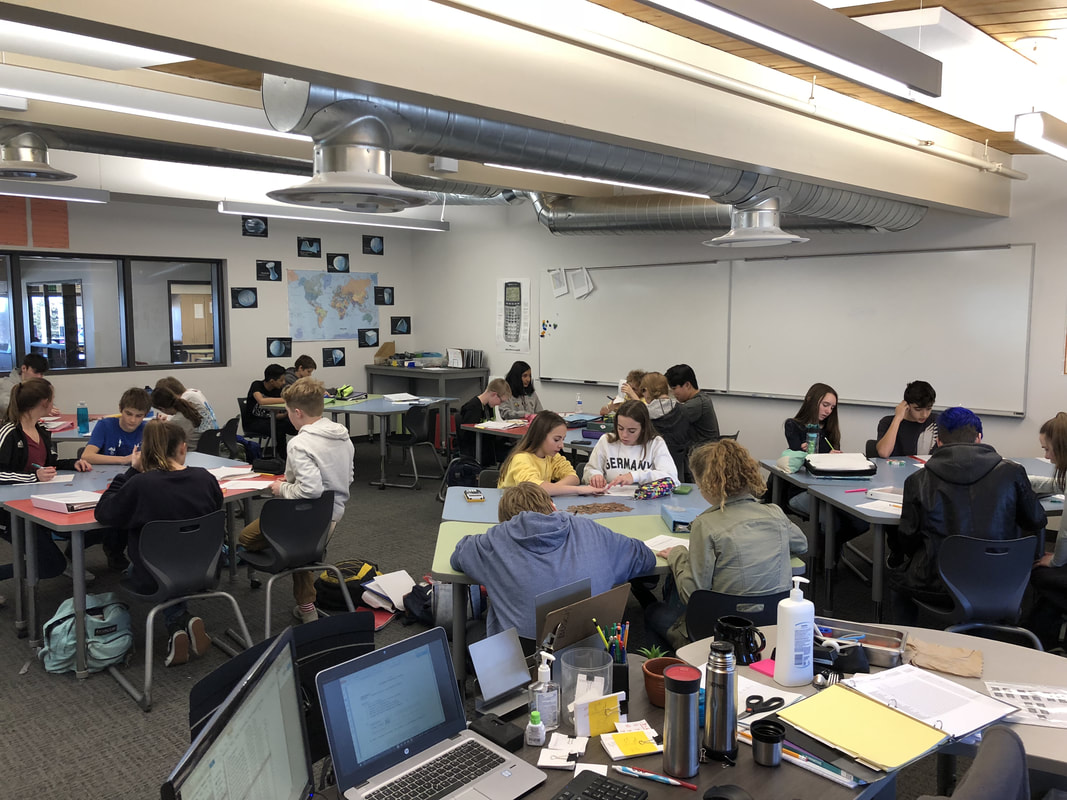
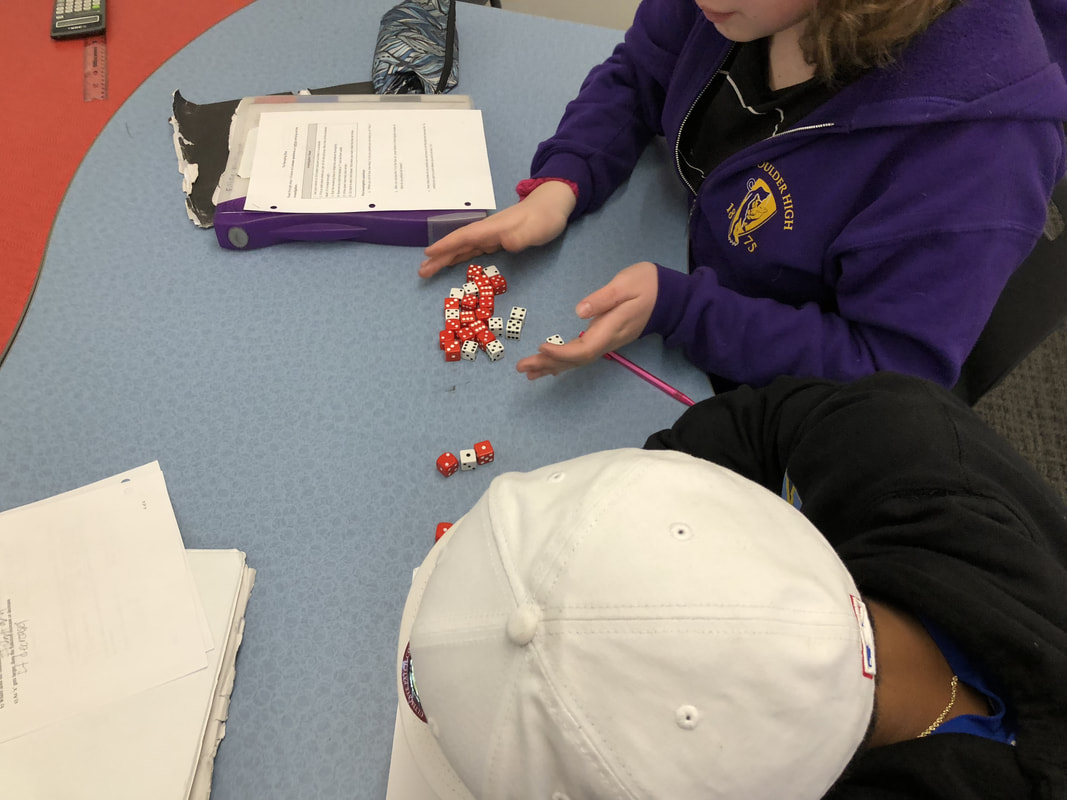
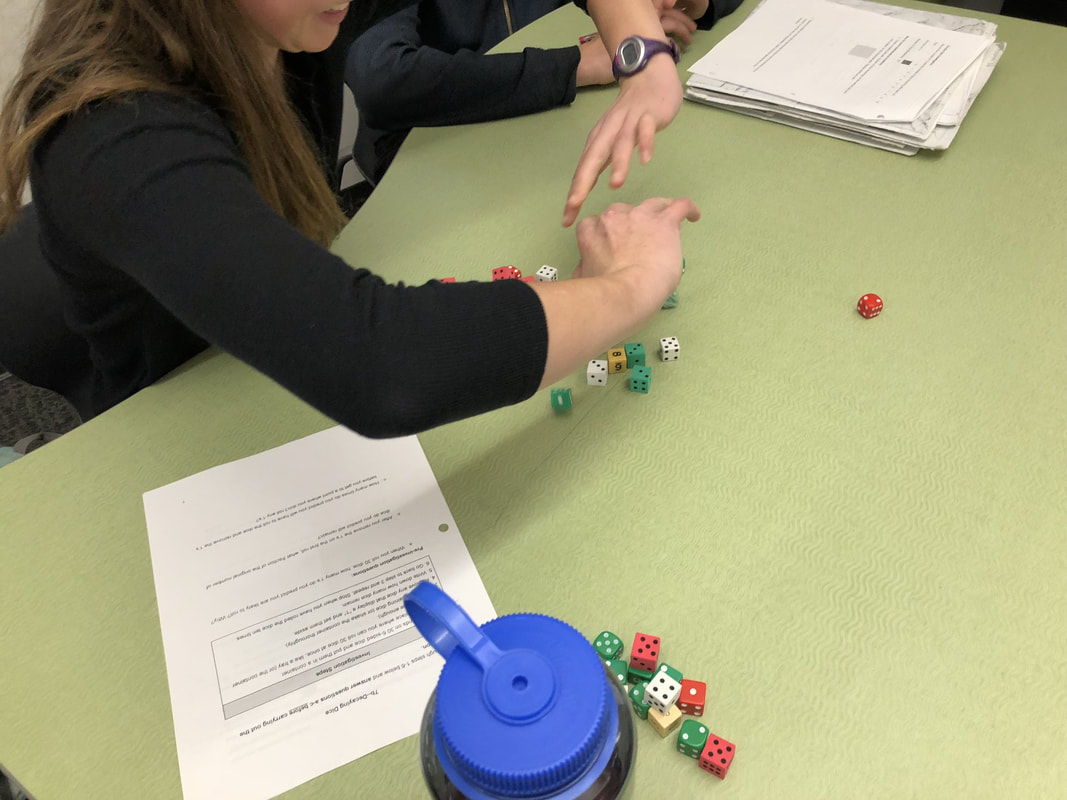
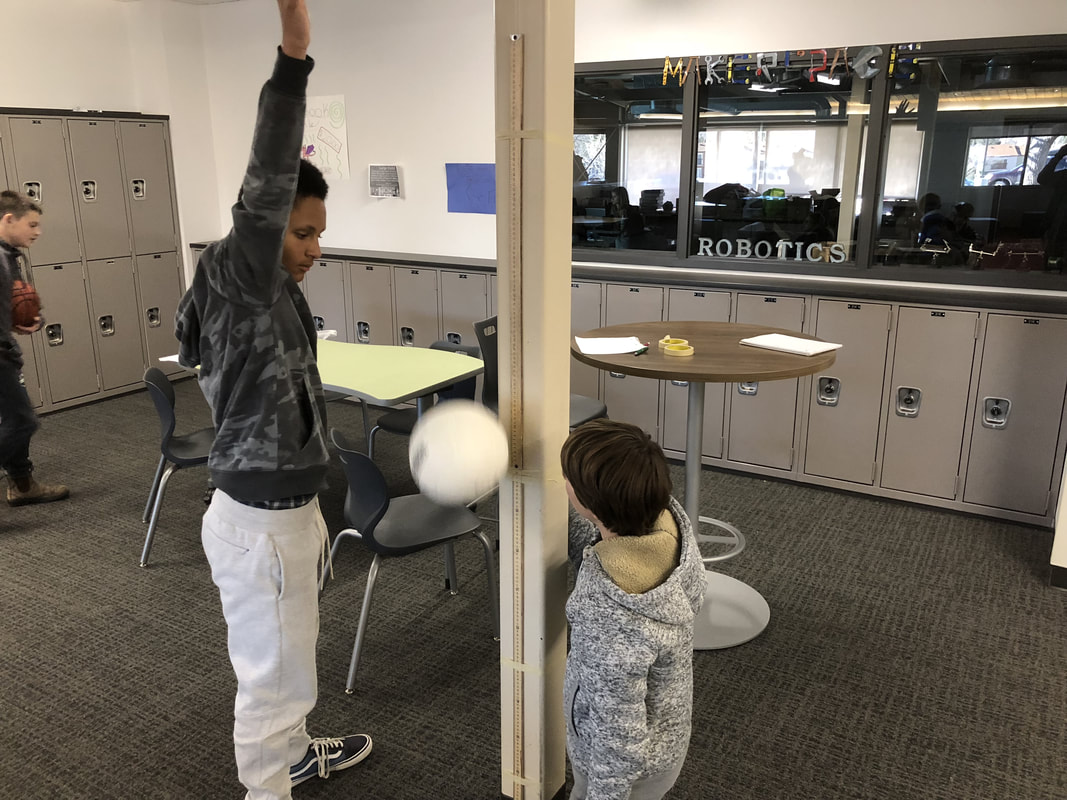
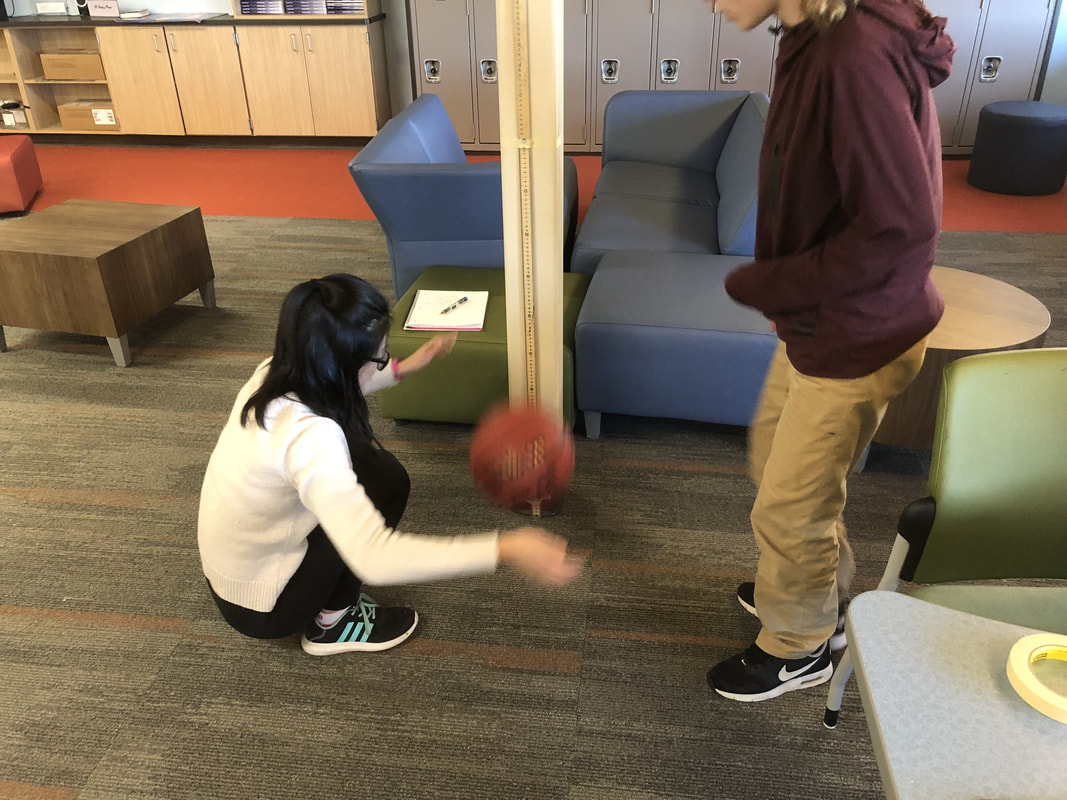
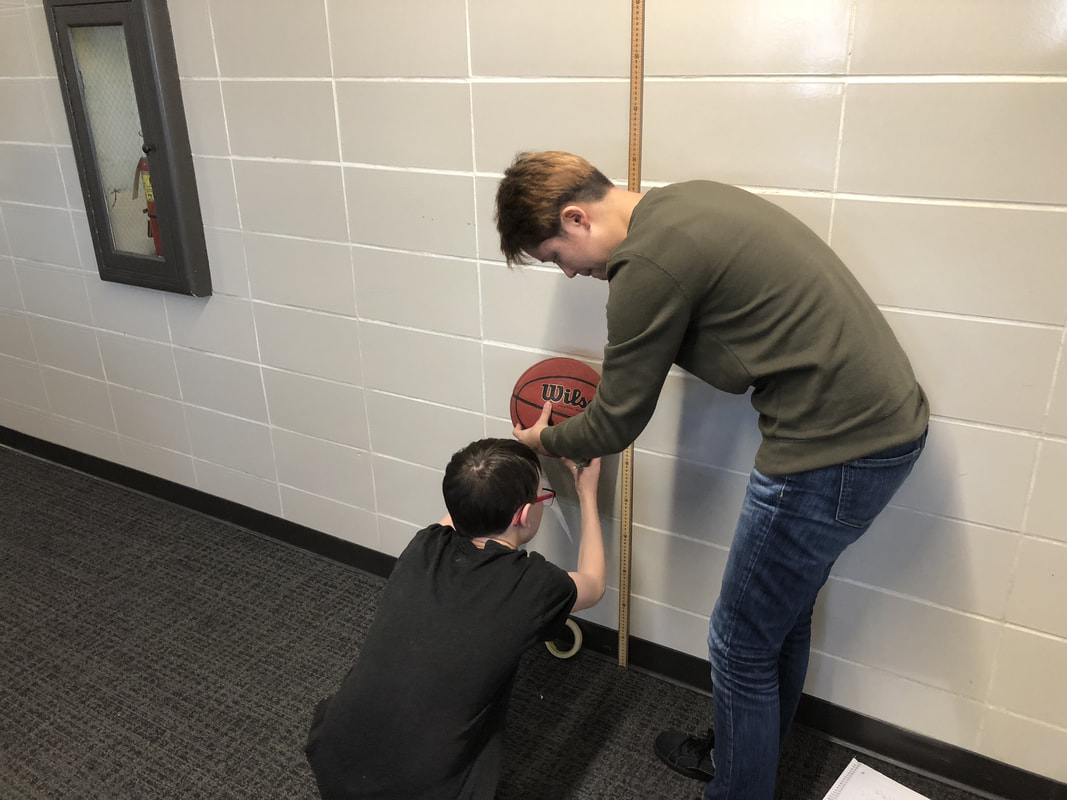
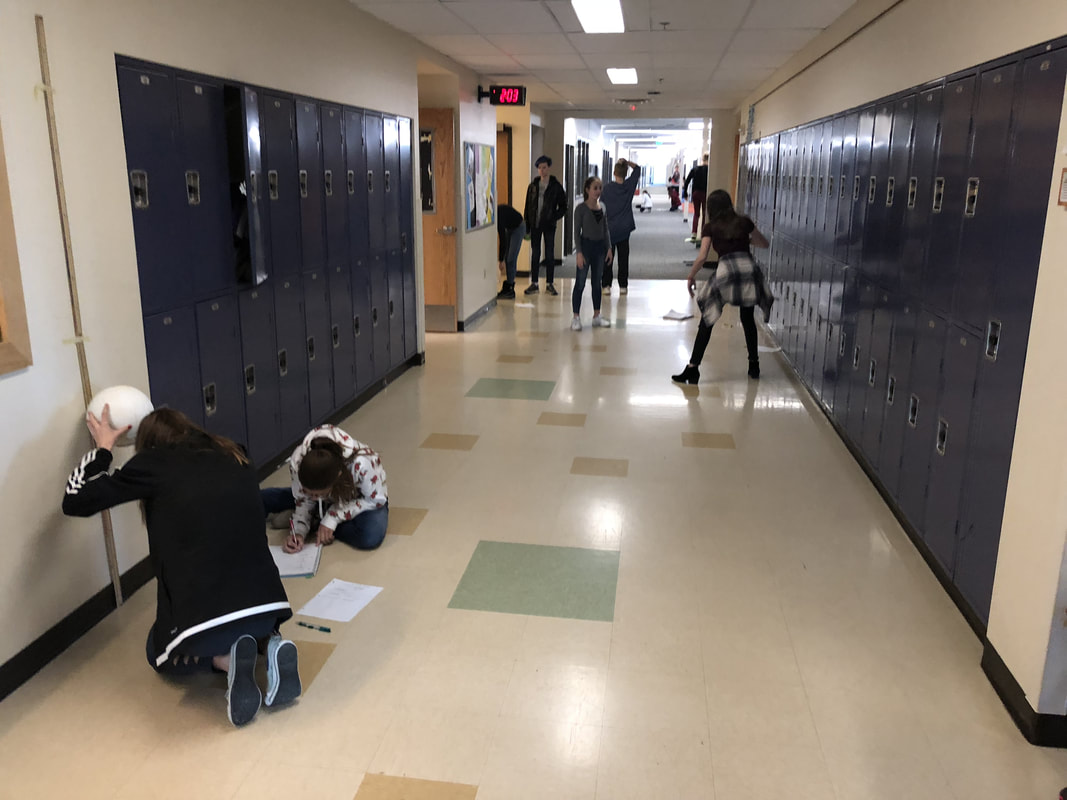
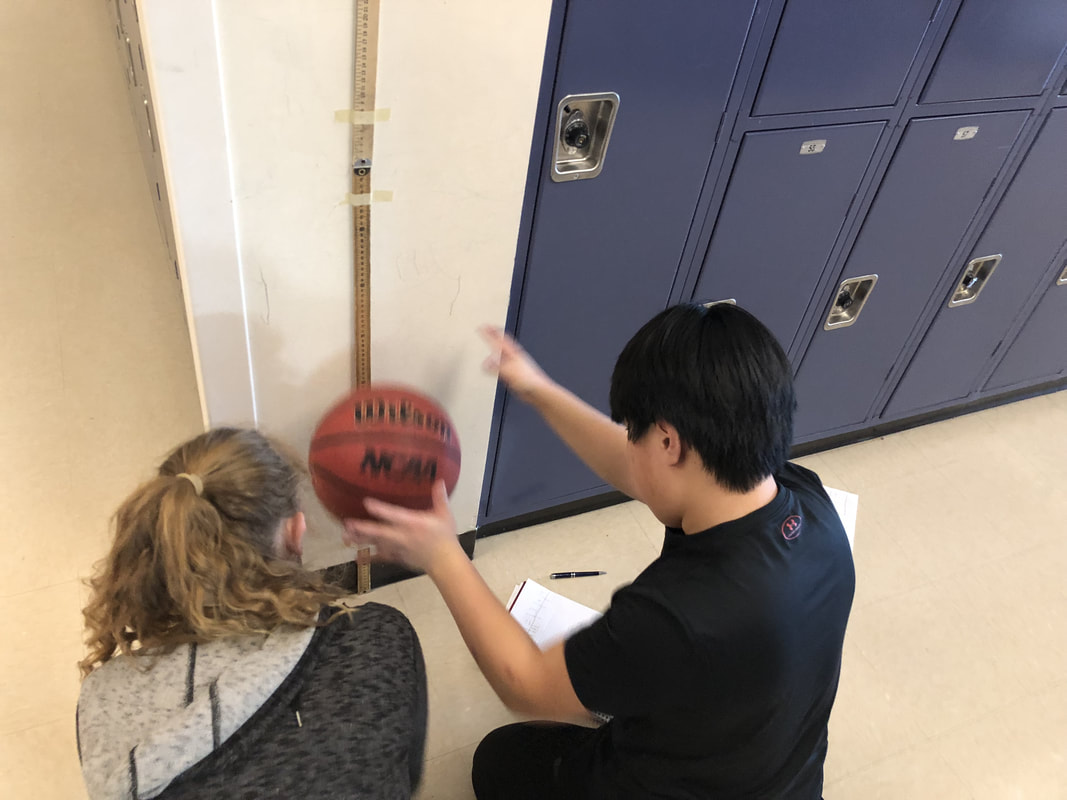
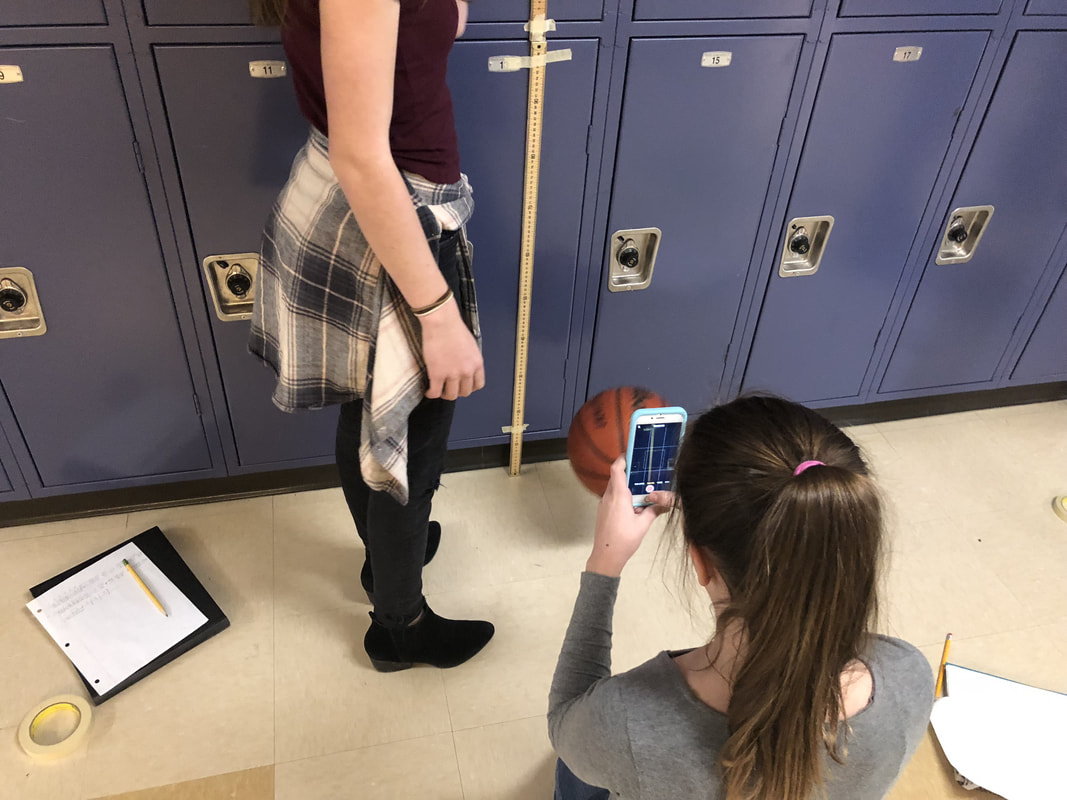
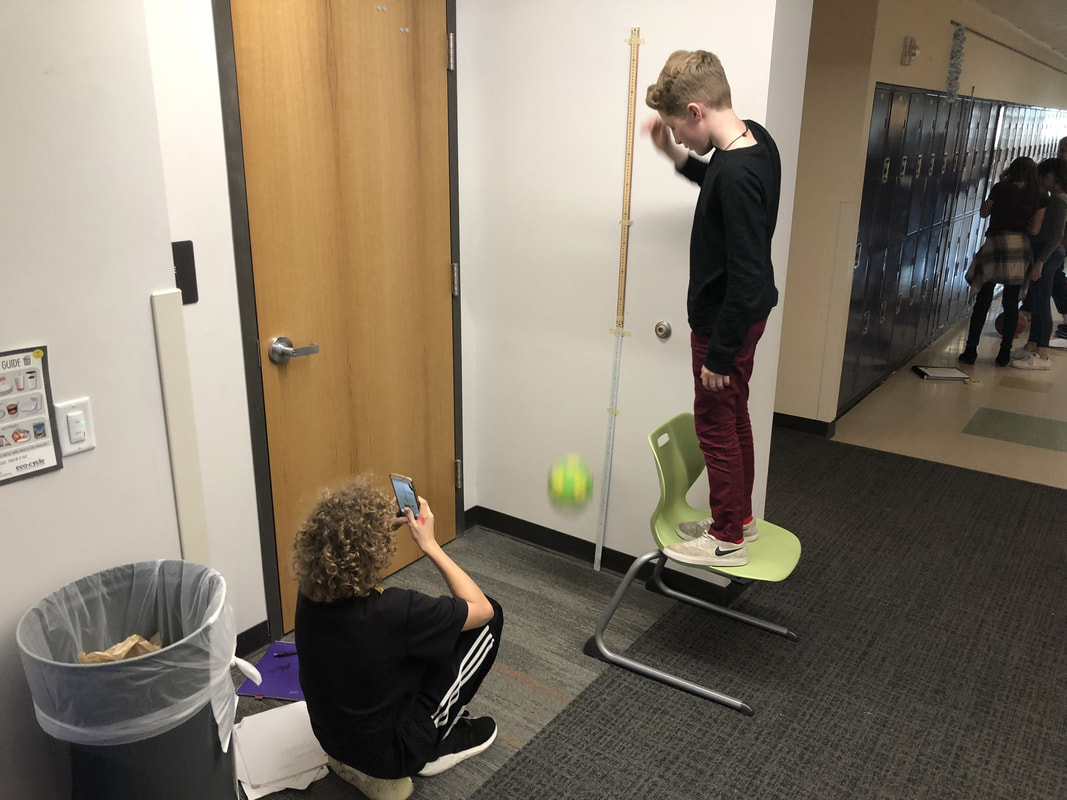
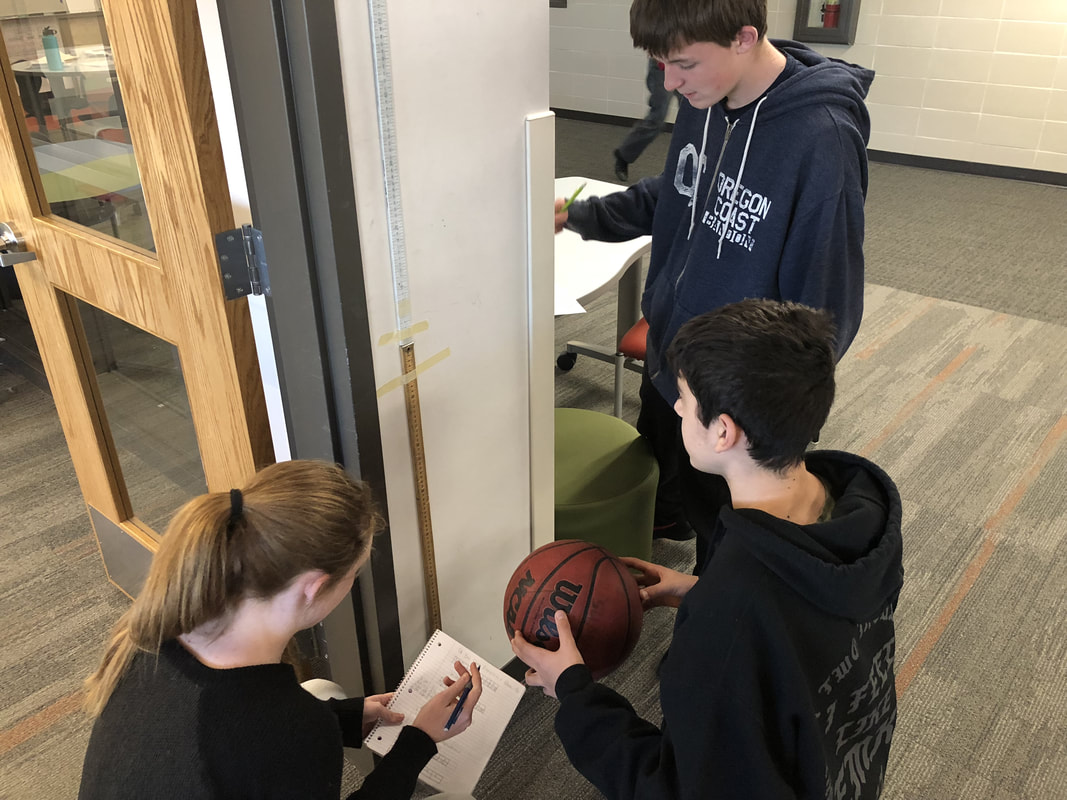
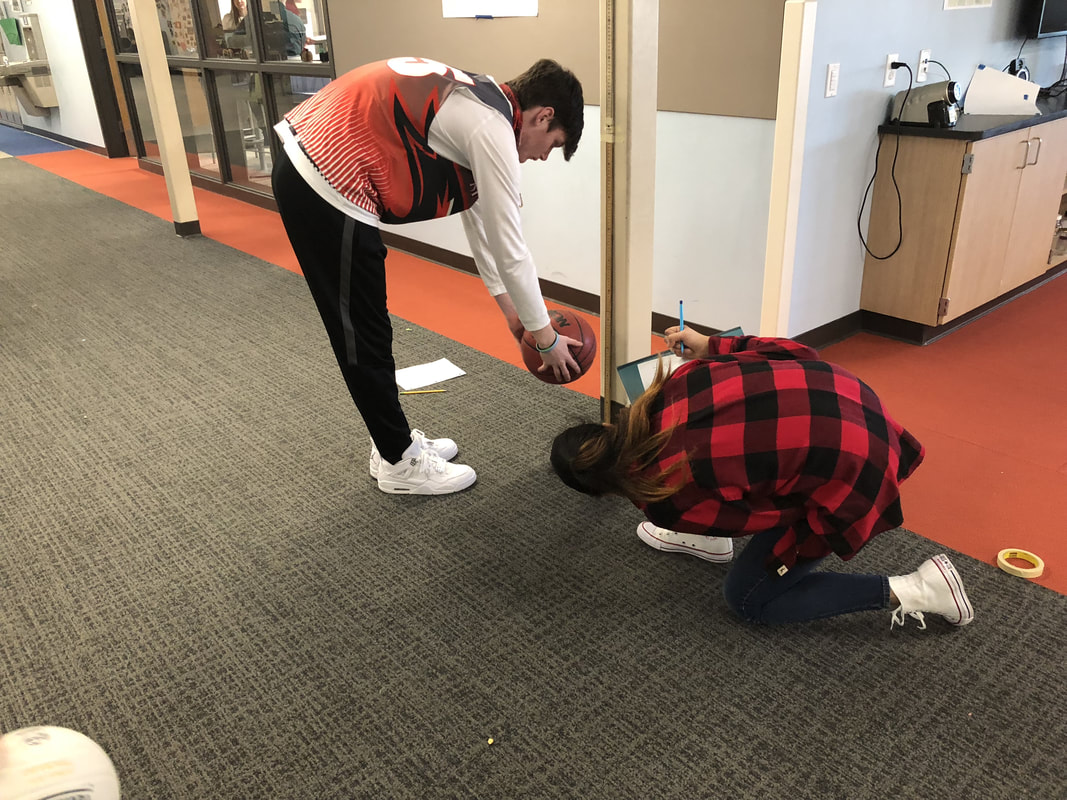
And now for the gallery. I'm going to include the good, the bad, and the ugly so you get a realistic picture of what to expect. I make it very clear to students that it is possible to get full credit without making these display worthy. I'm most interested in the math. However, I do offer bonus points for making things pretty. First, a couple of pretty ones. The math isn't perfect, but I'm not going to highlight the mistakes for you. 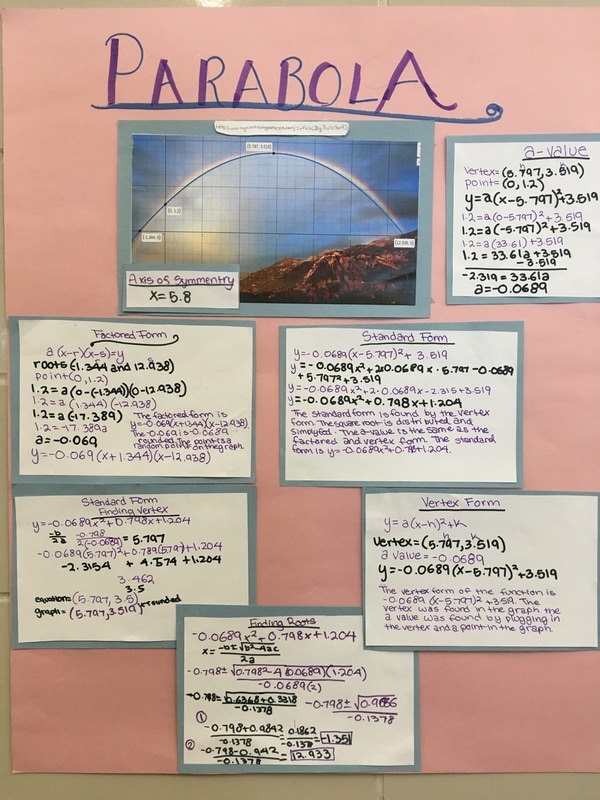 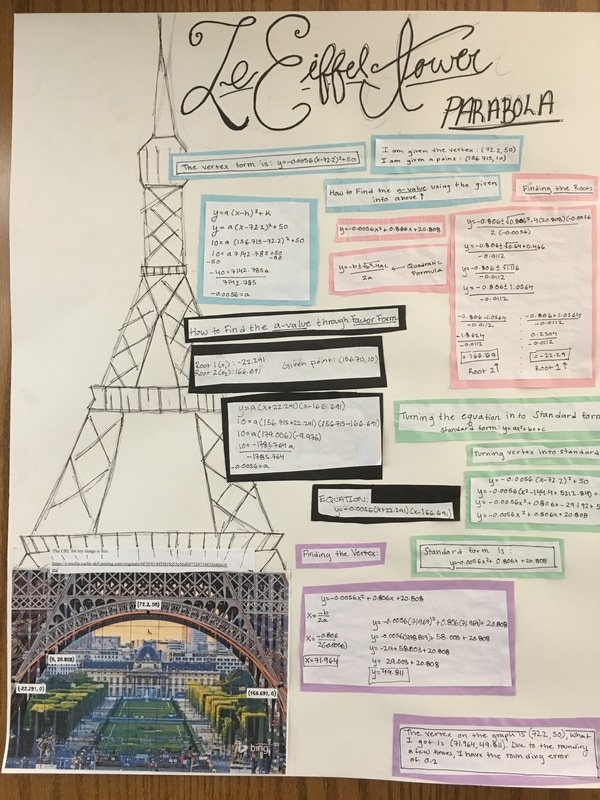 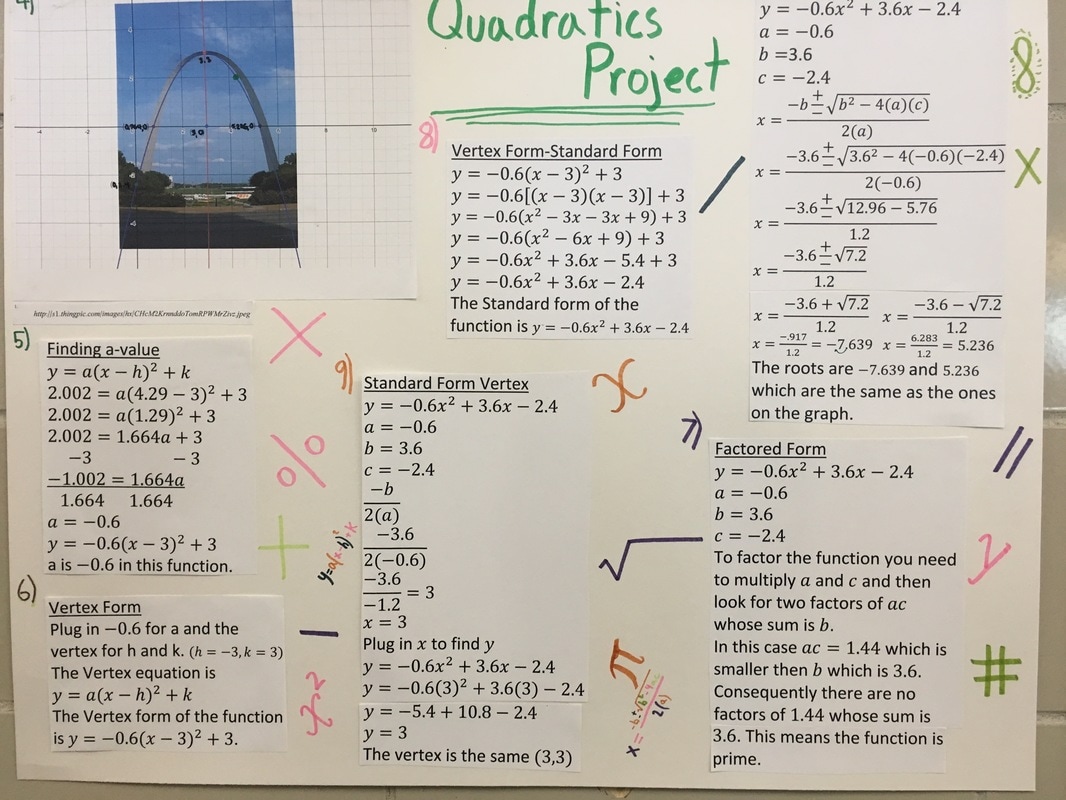 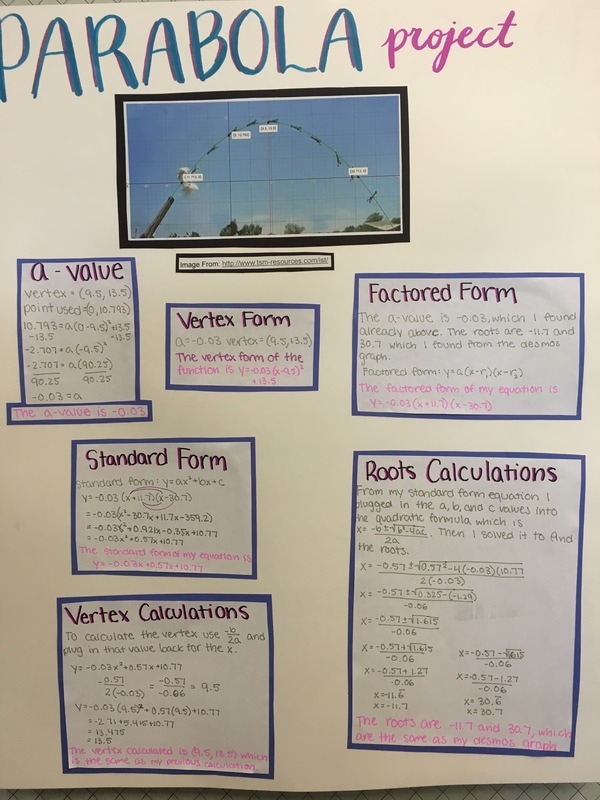 Here are some more student examples to give you an idea of the range of quality to expect. Not everything is super pretty all of the time. The directions were simple: •Drop a ball from any initial height, measure in cm. •Measure the height for 5 bounces of a ball (I suggest using a table). •Graph the points (graph paper) •Create an equation that models/fits your data. •Do this for two different balls (don’t put both balls on the same graph) 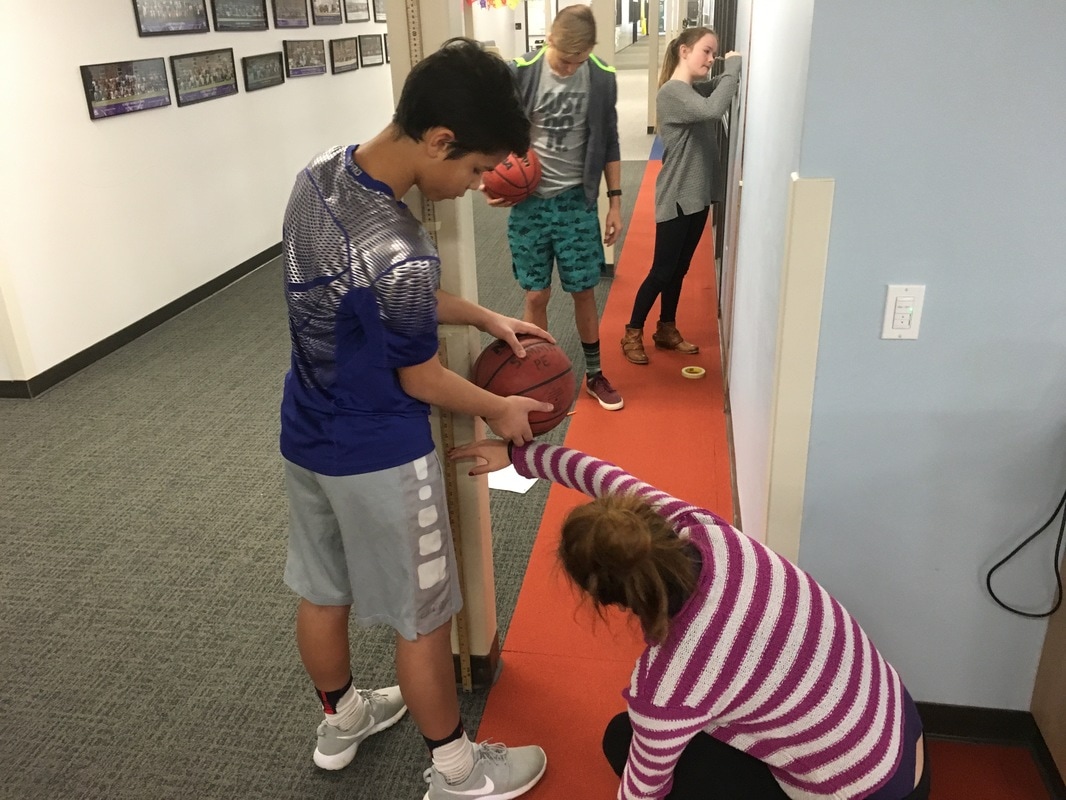 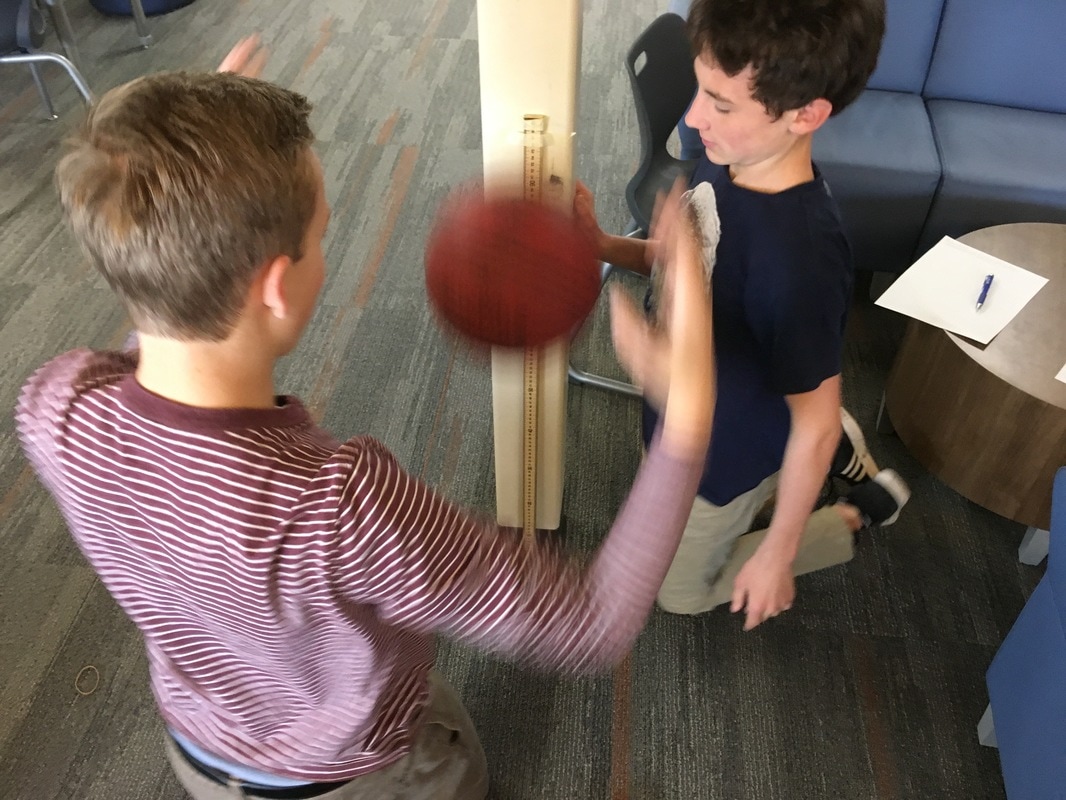 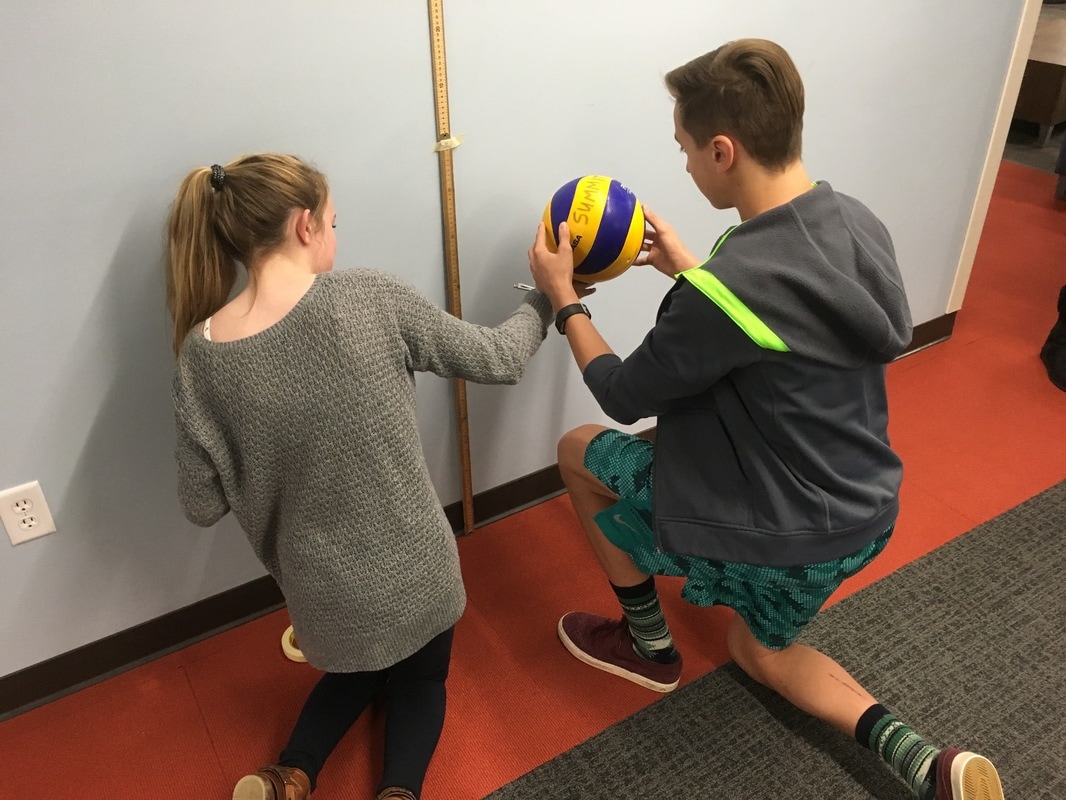 The results were fabulous! Students had great conversations surrounding how to find the constant multiplier if it never ended up being the same between bounces. We also had heated arguments about whether connecting the data points with a curve made sense in the situation. (The students came to the consensus that they did not think the graph would be continuous.) 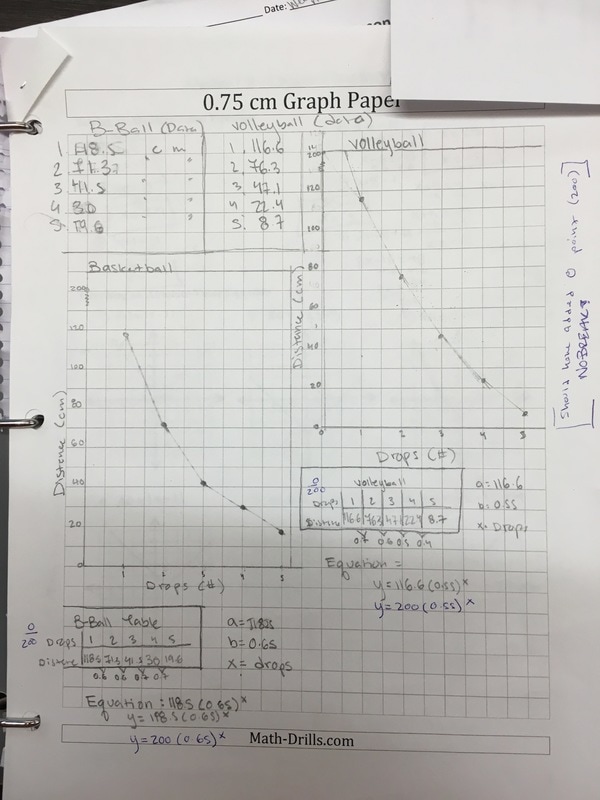 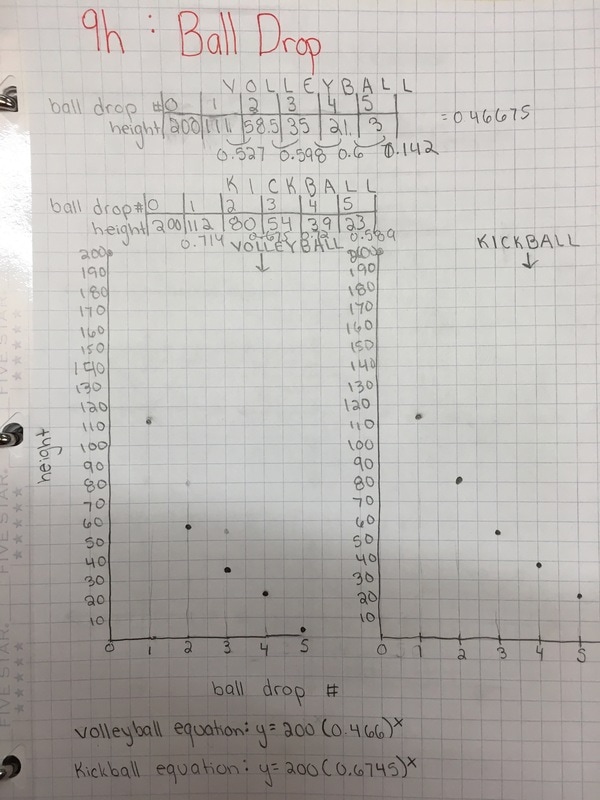 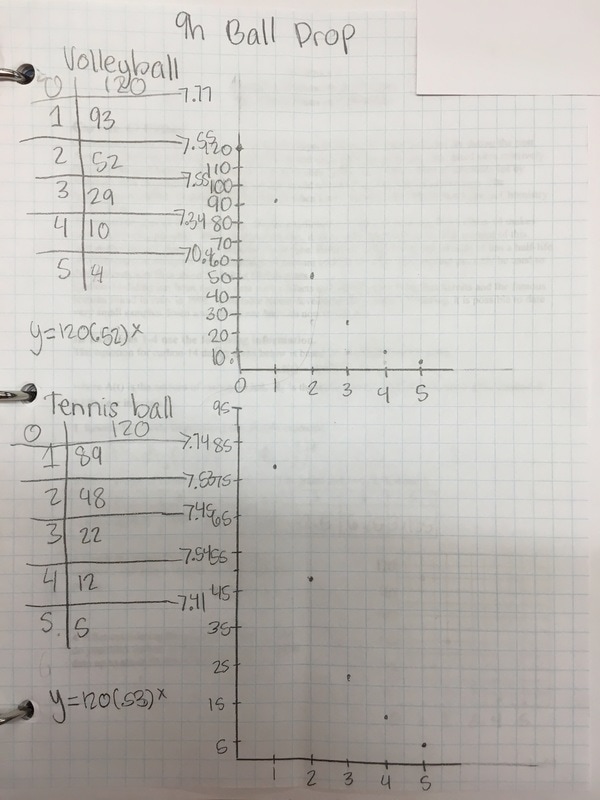 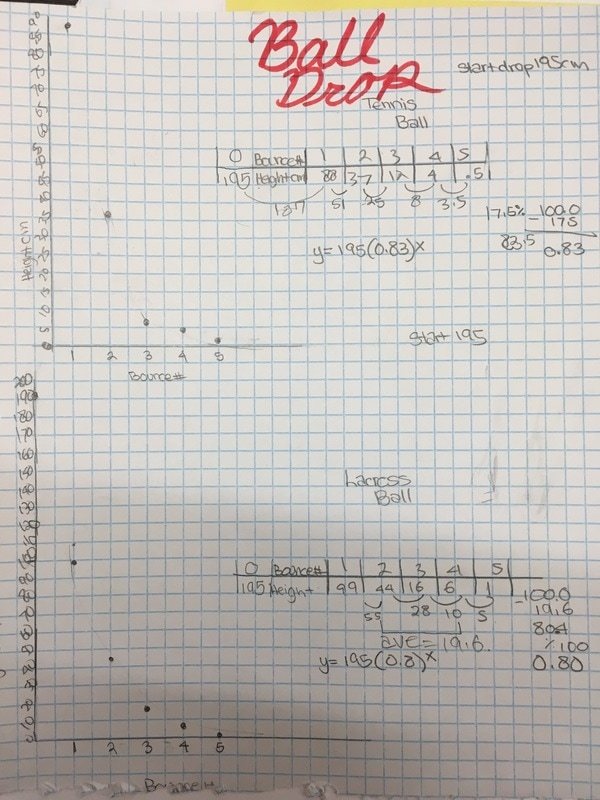 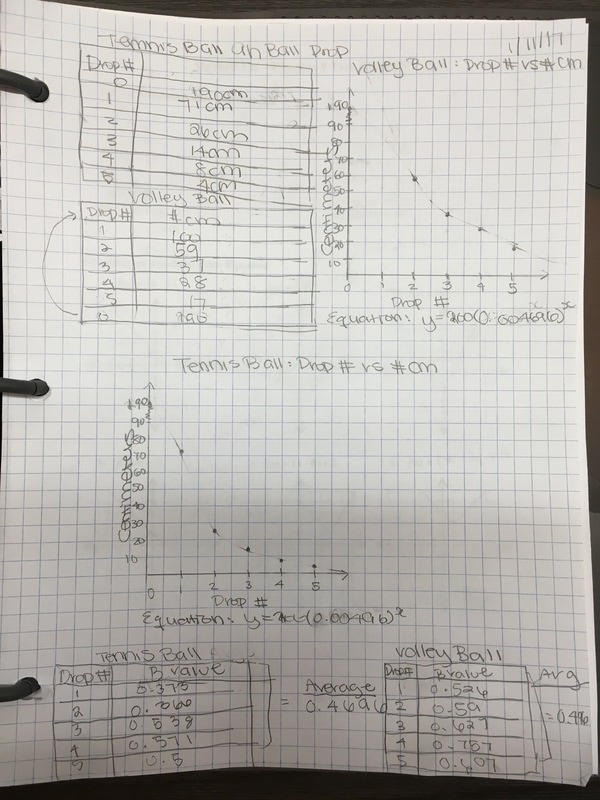 Experiments with pennies and dice exploring exponential growth and decay. 2 days. 500 dice. More pennies than you care to think about. High engagement. Excellent modeling. 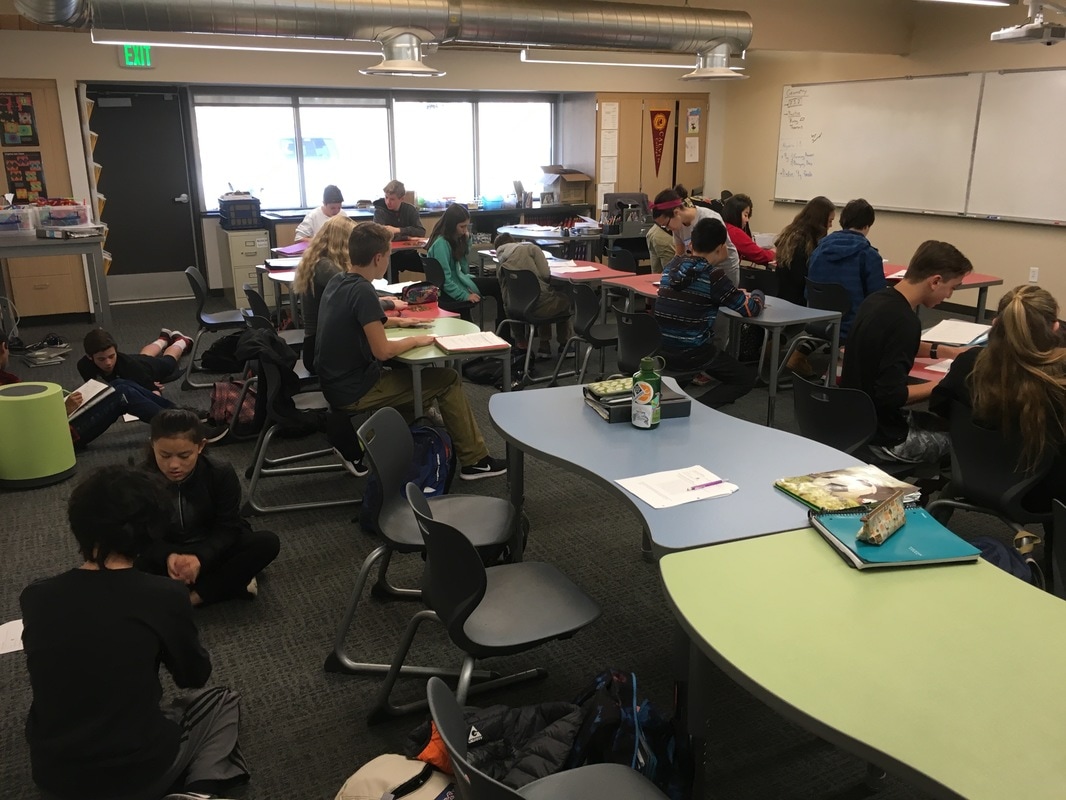 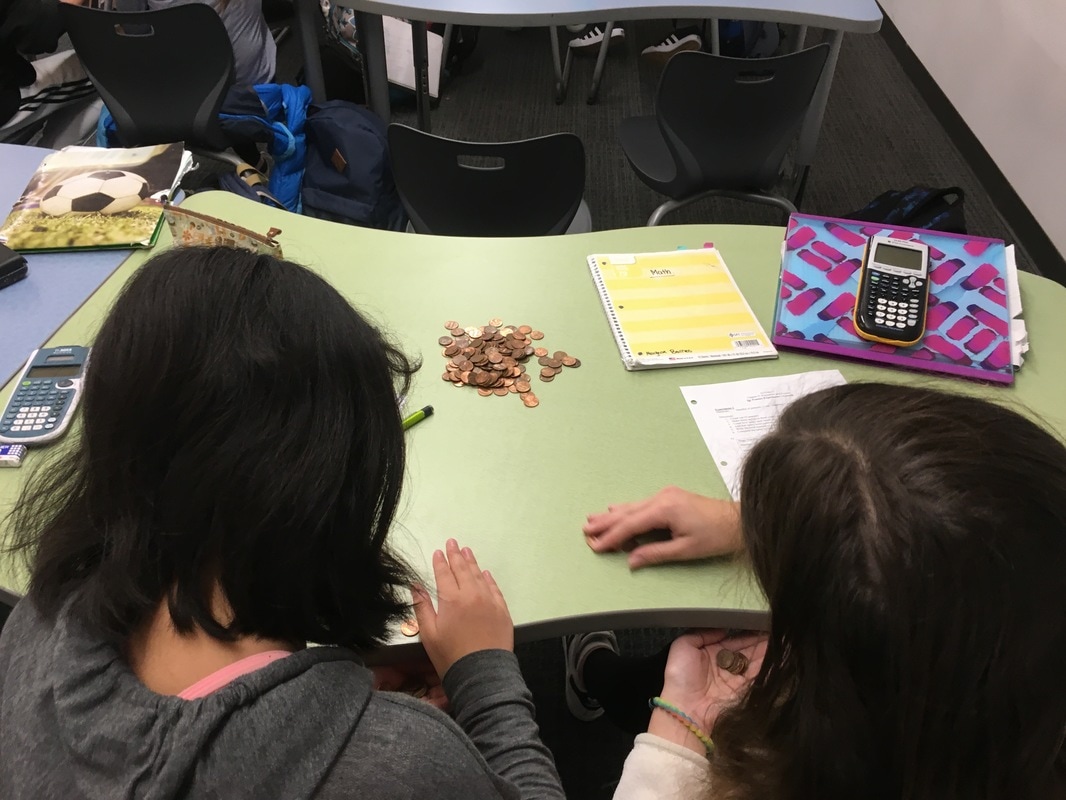 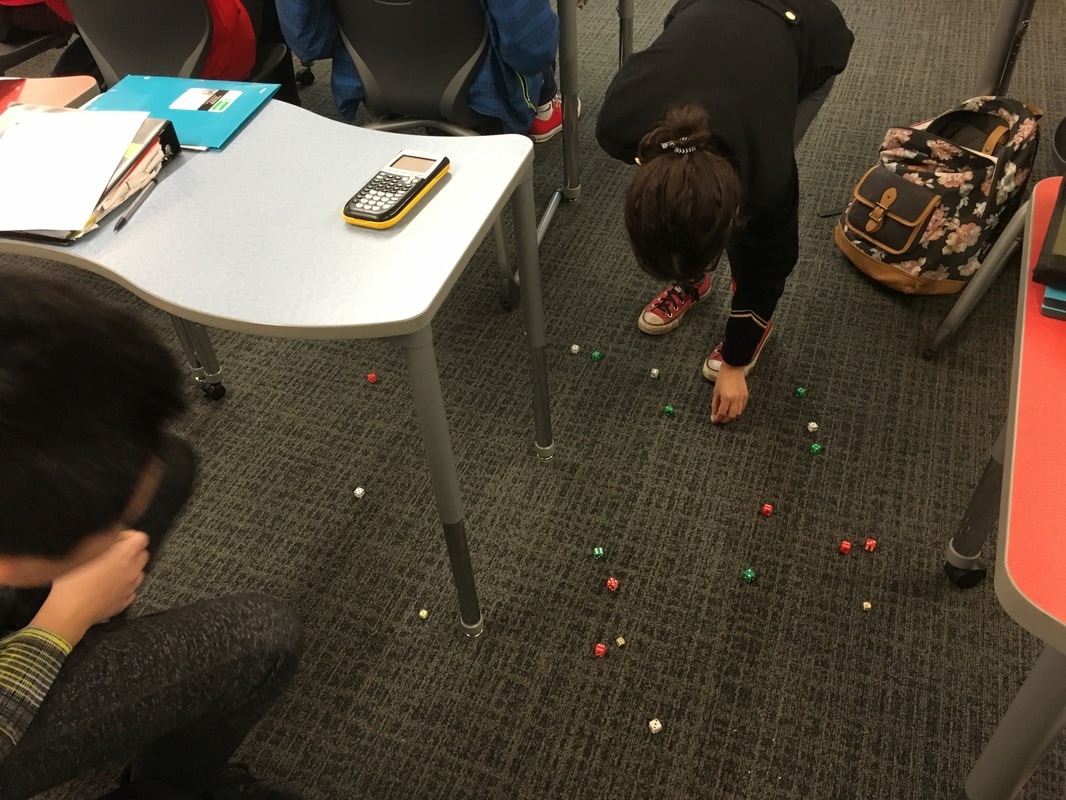 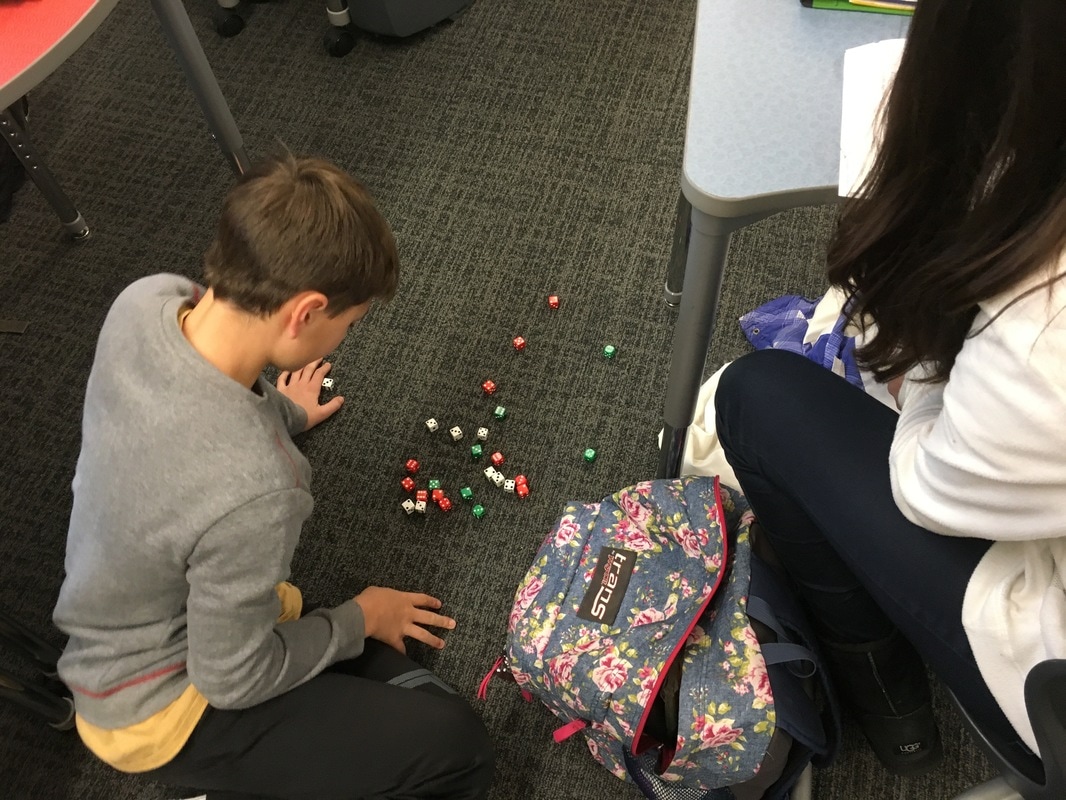
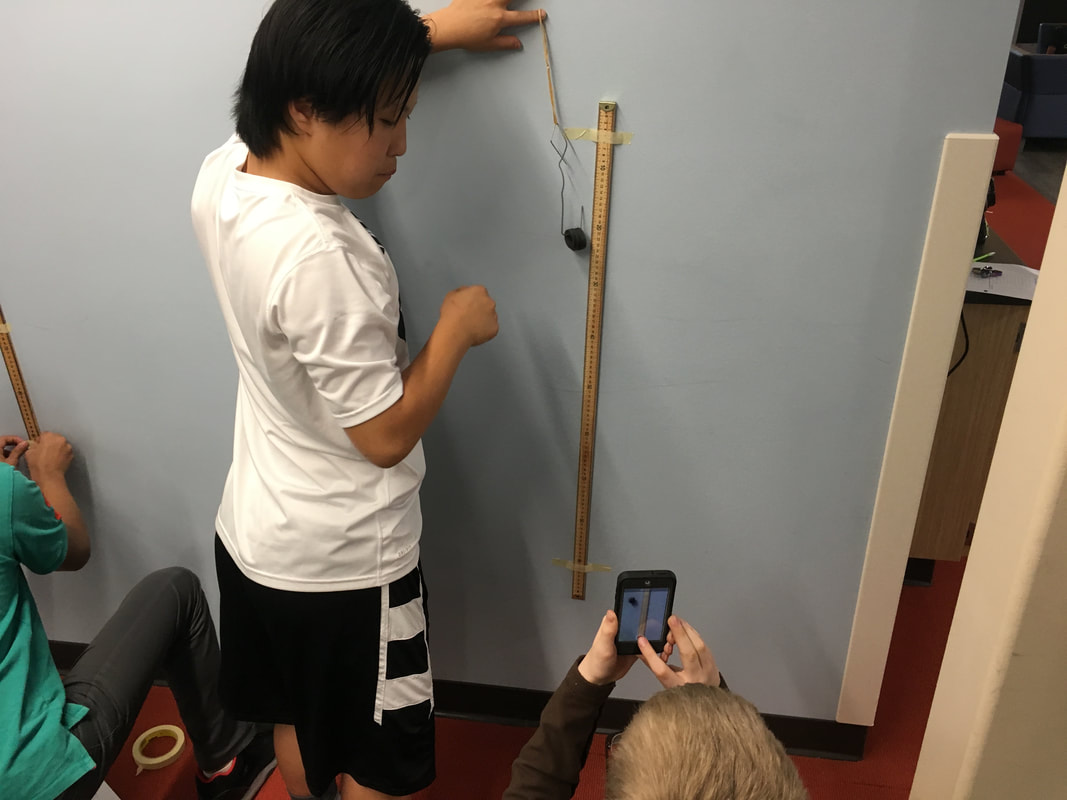
From a height just shy of 16 ft (190.5 in), two groups made amazing drops today: 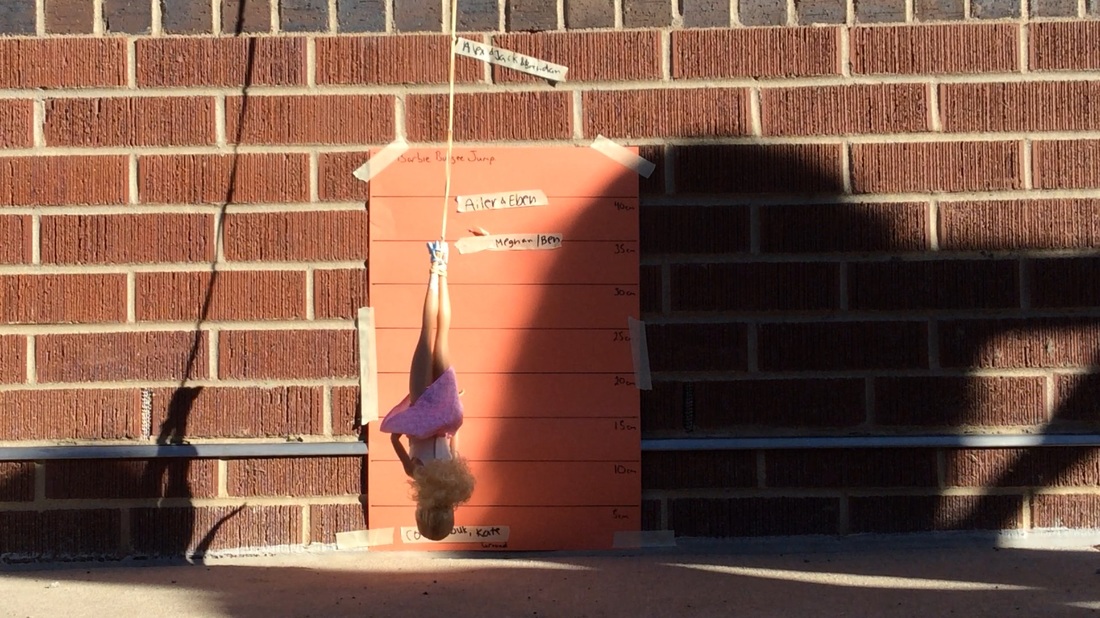 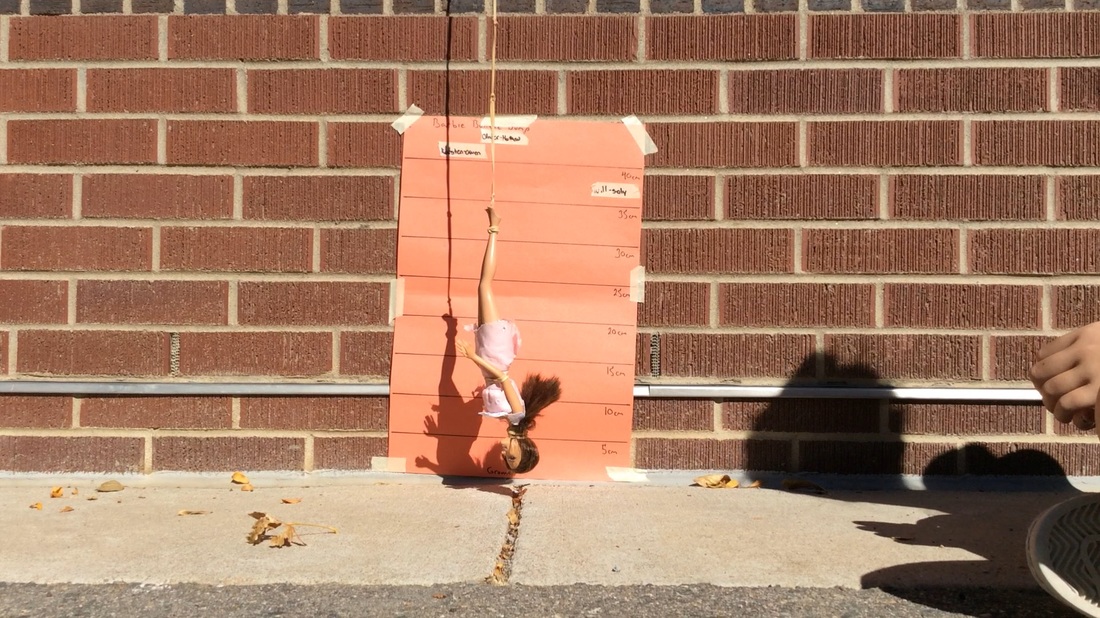 Super proud of my classes today.
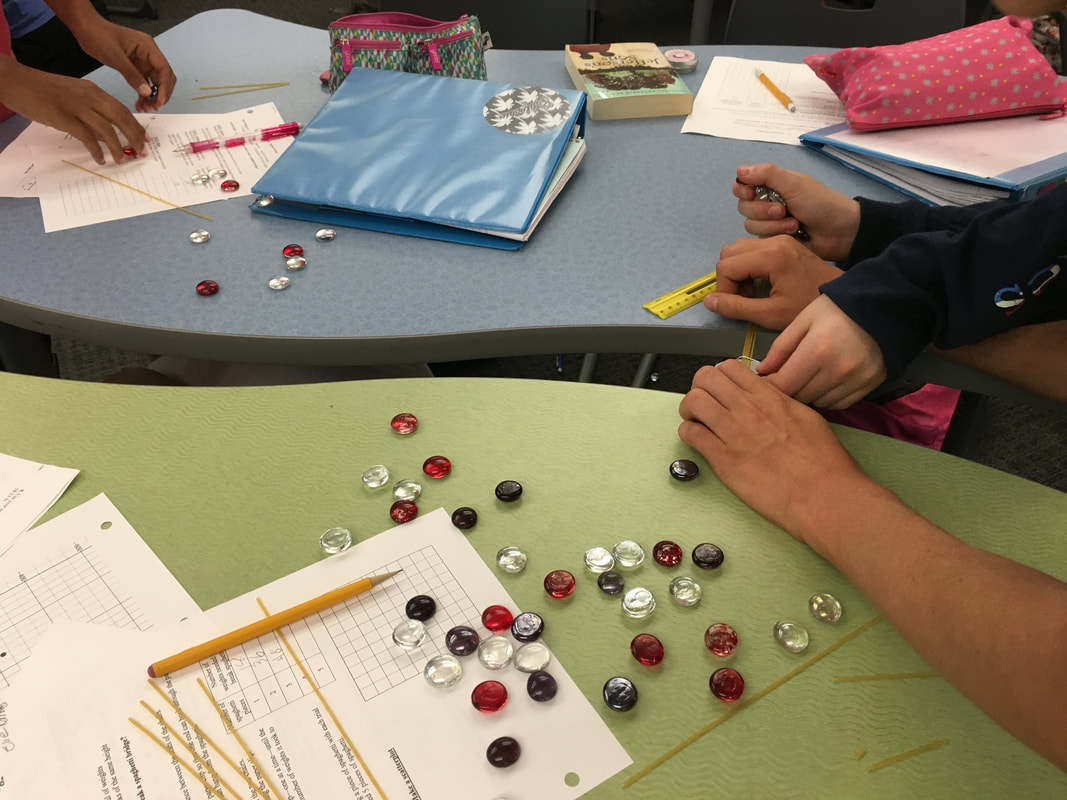
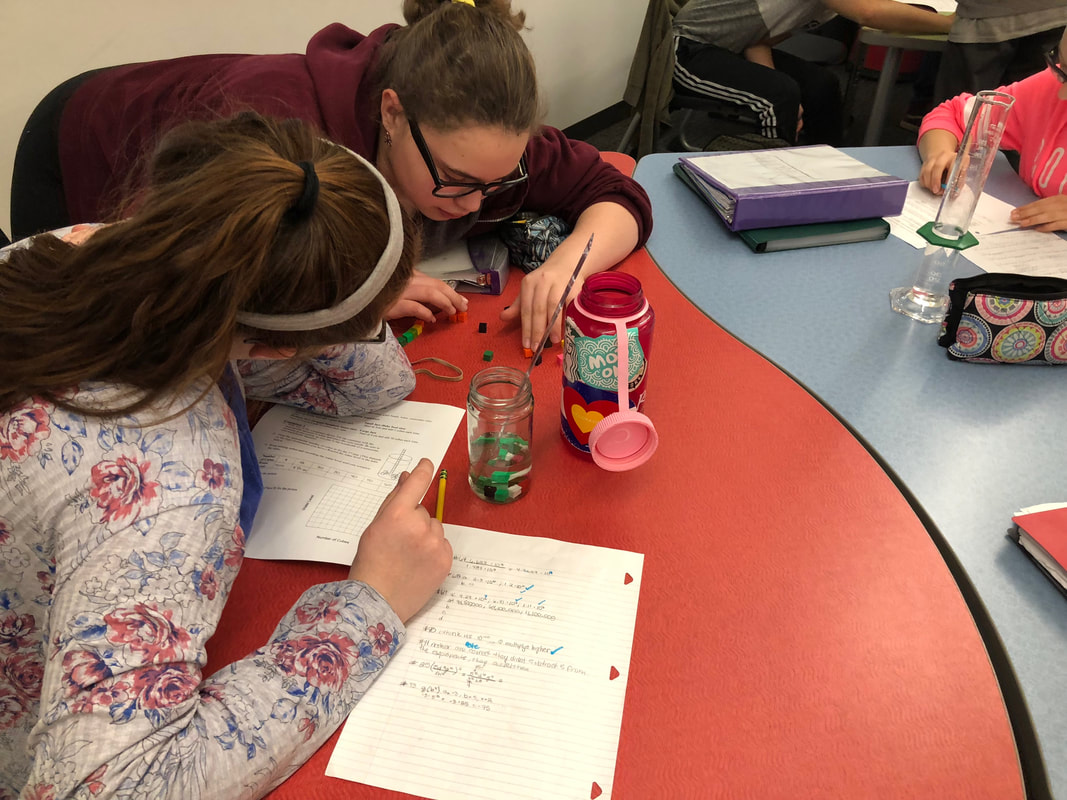
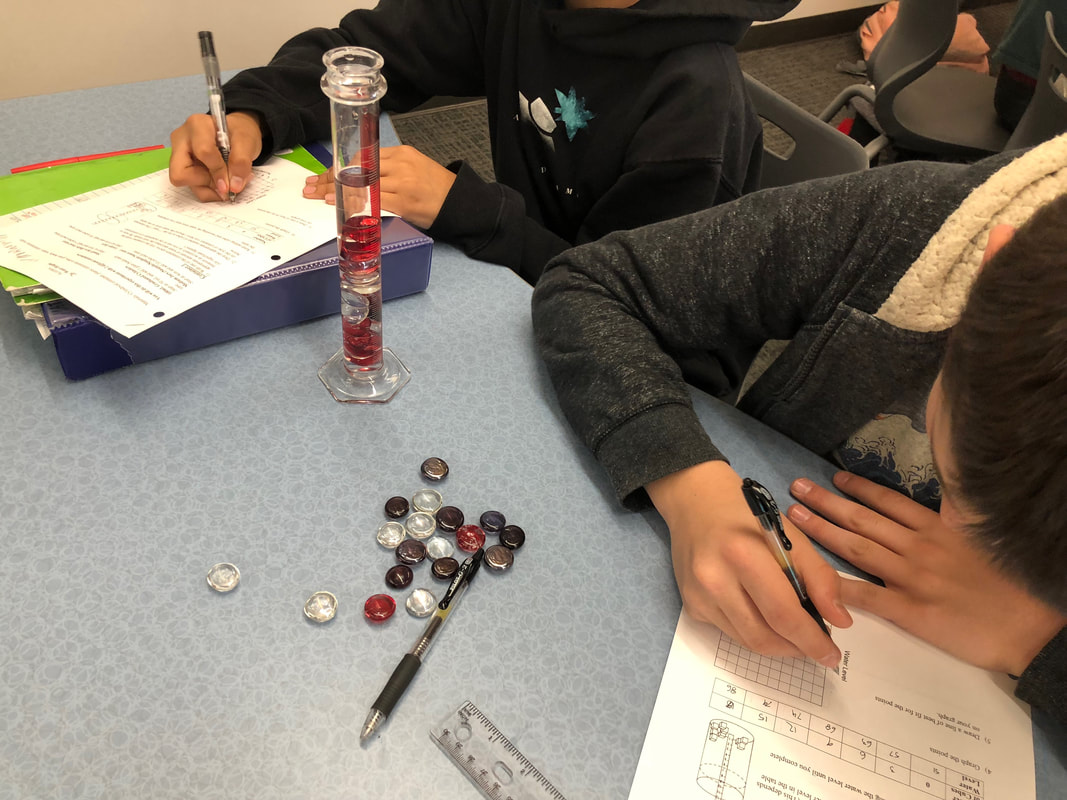
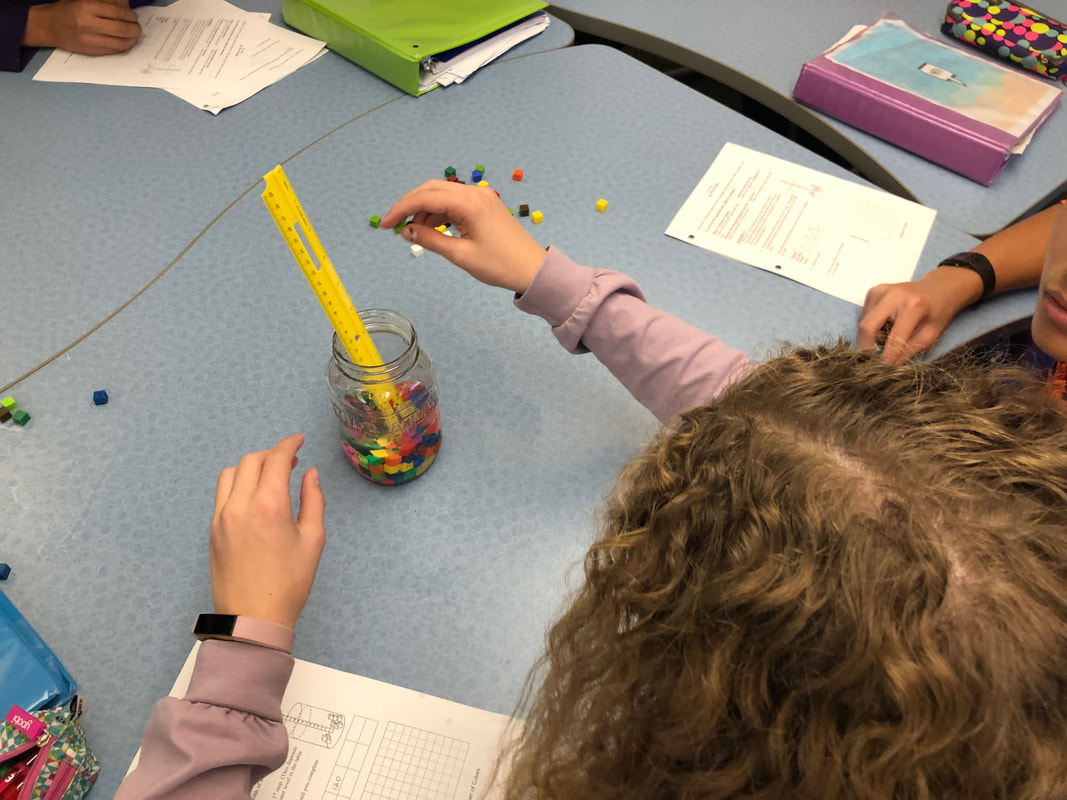
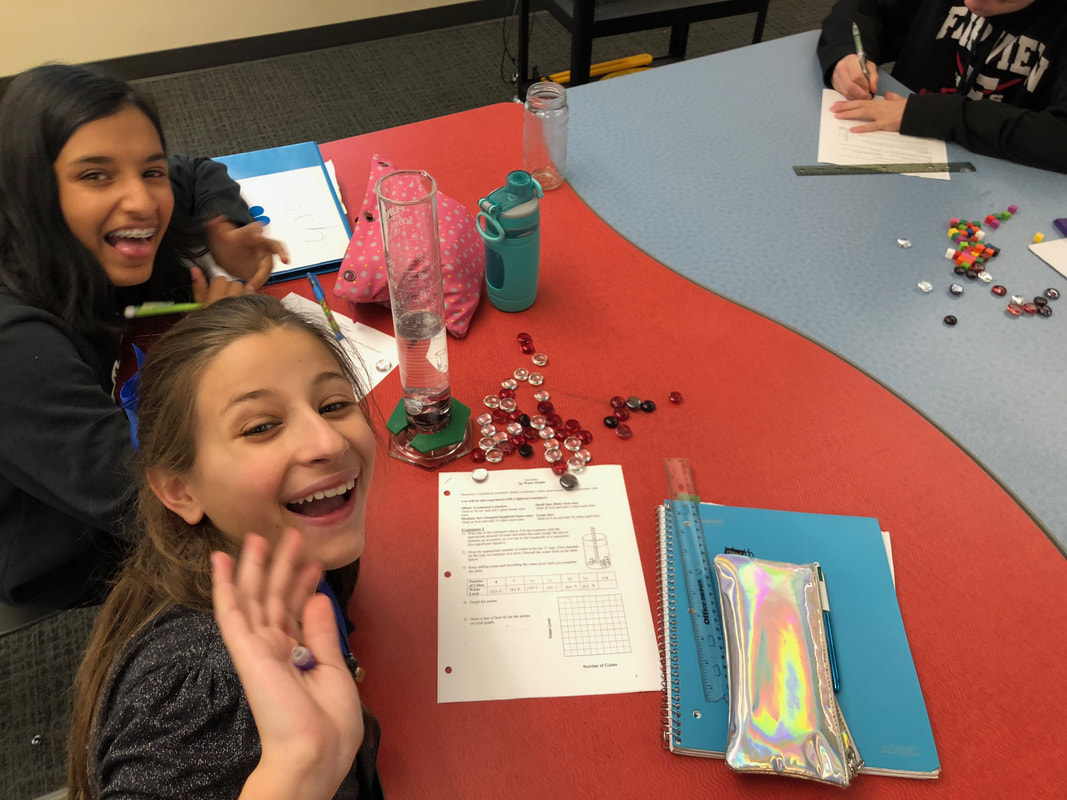
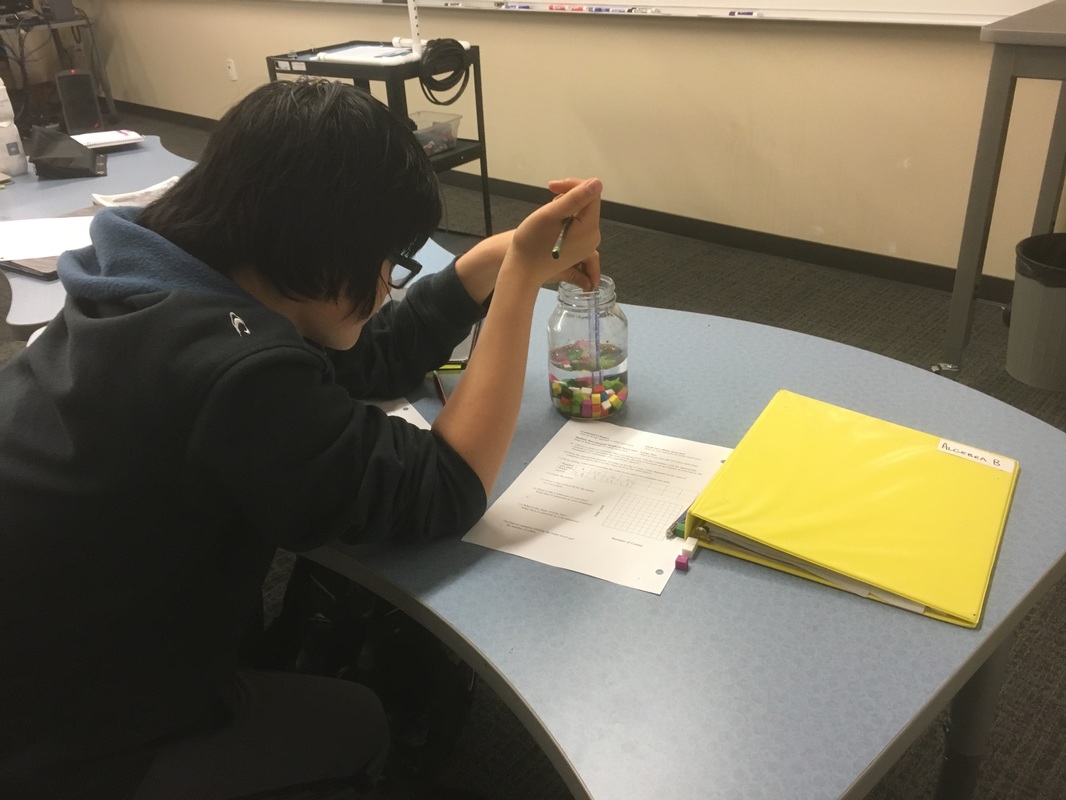
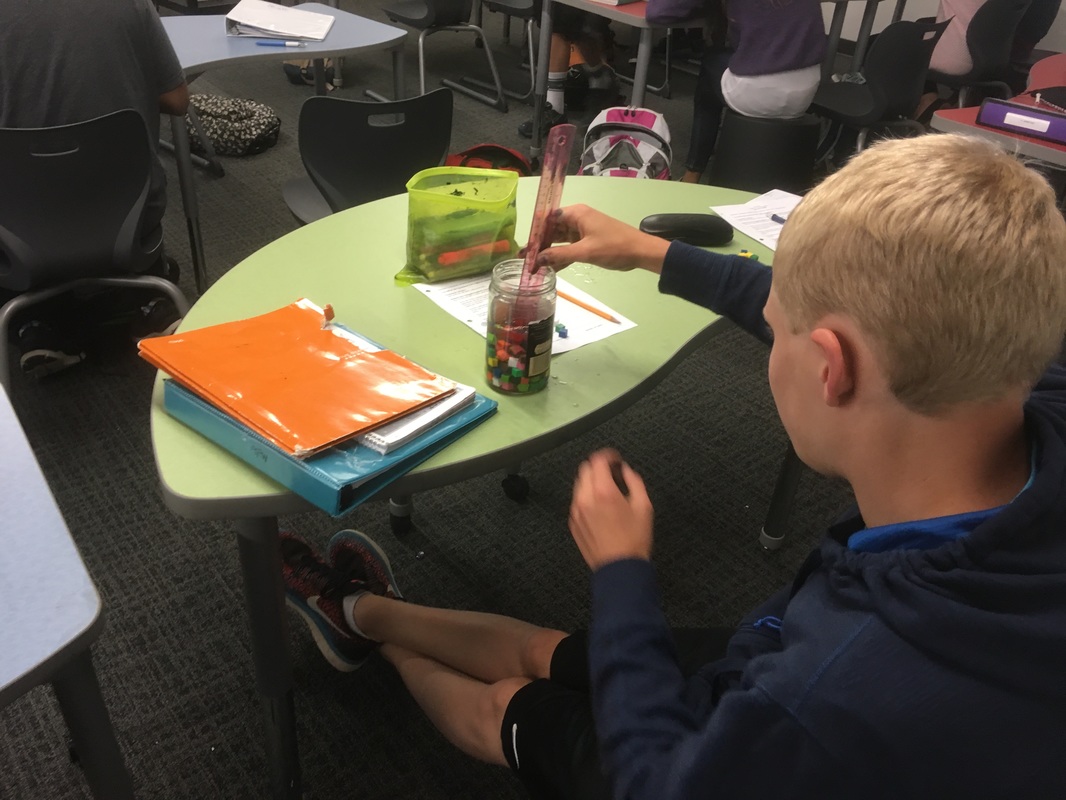
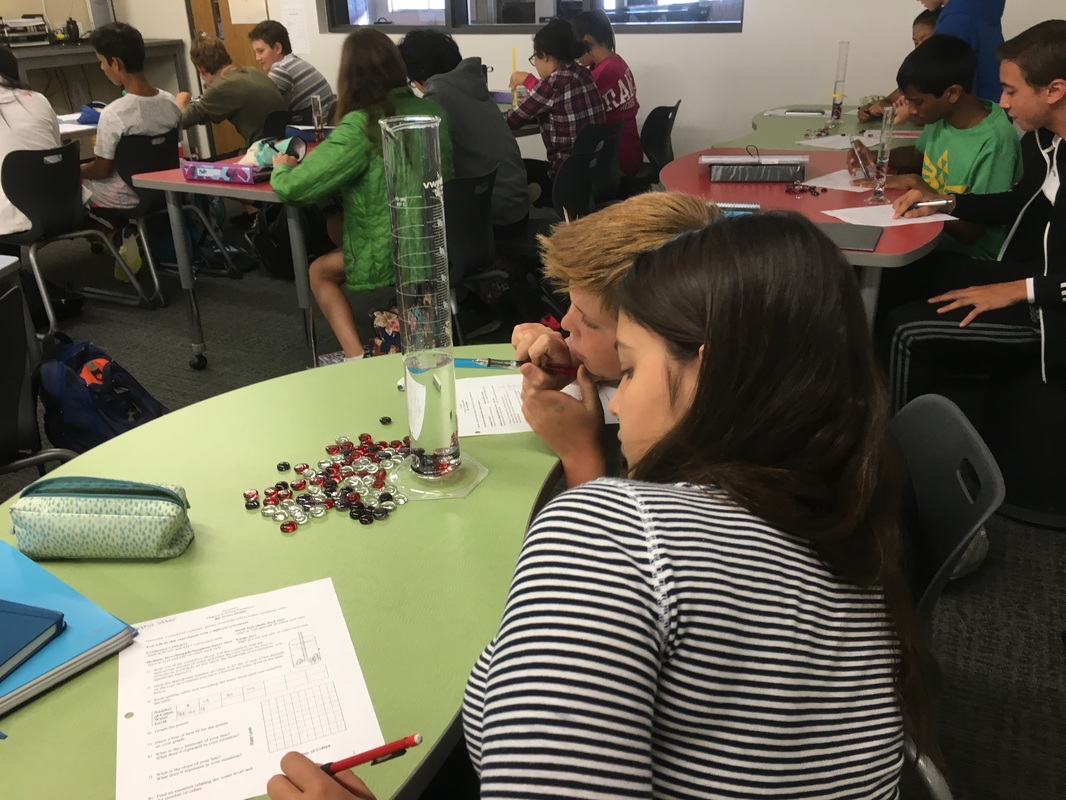
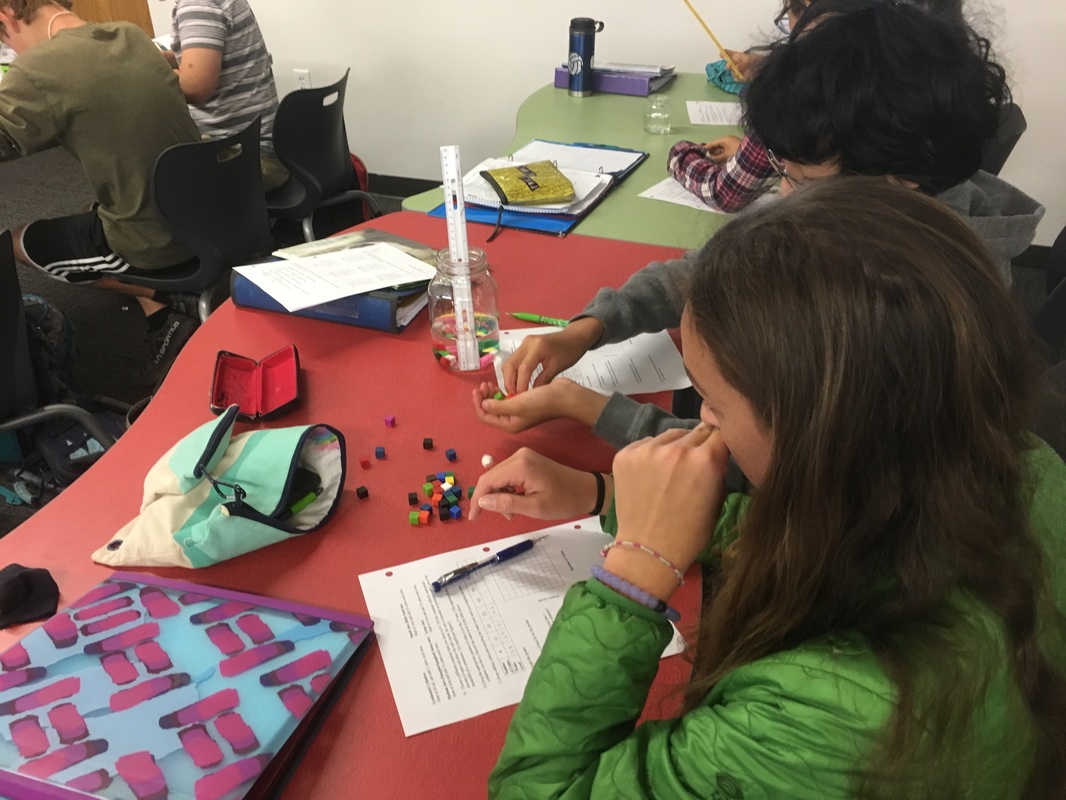
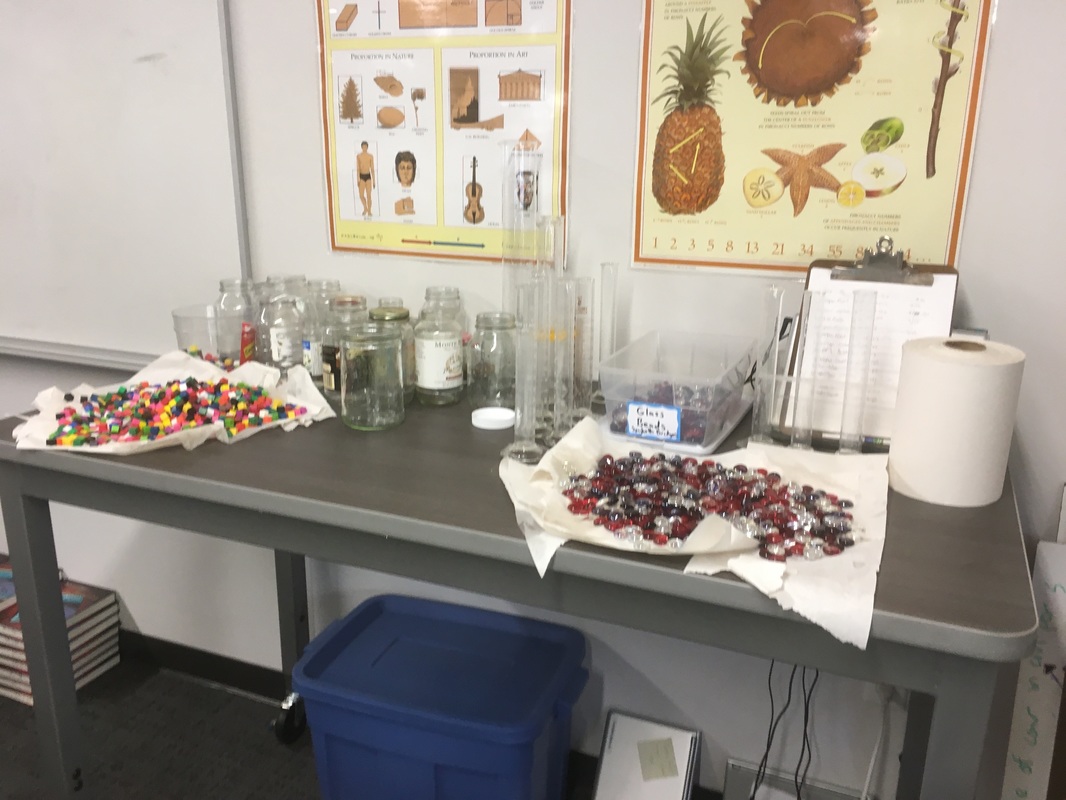
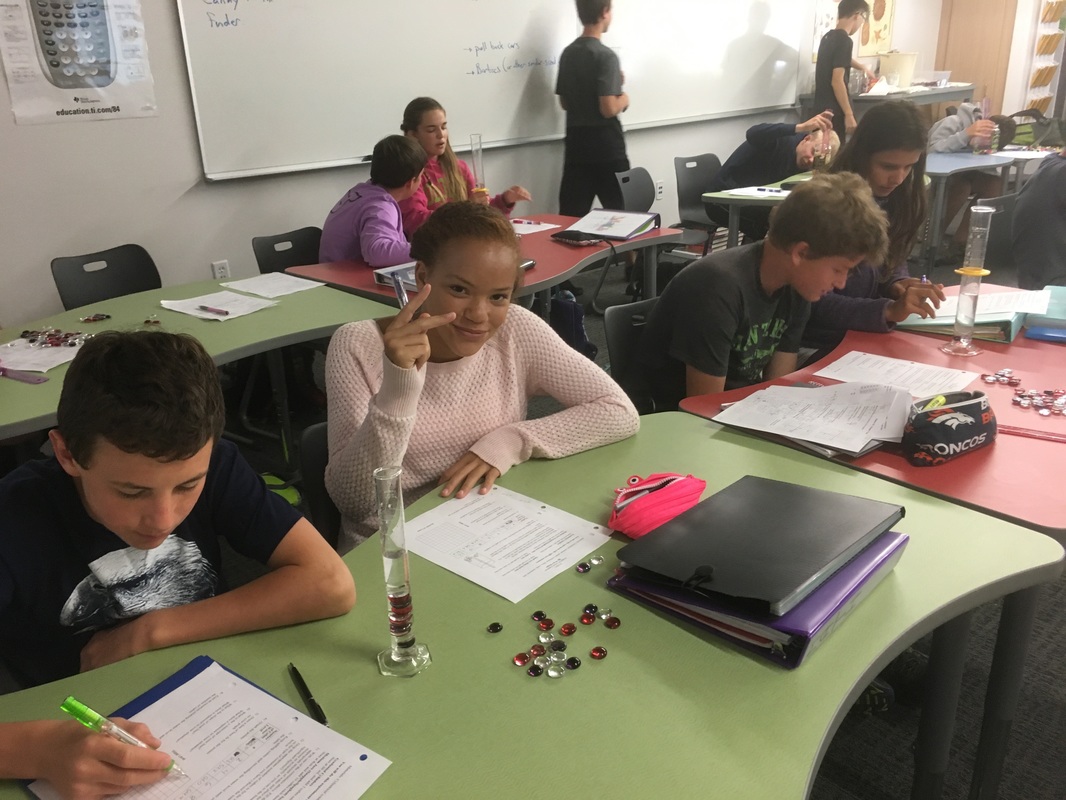
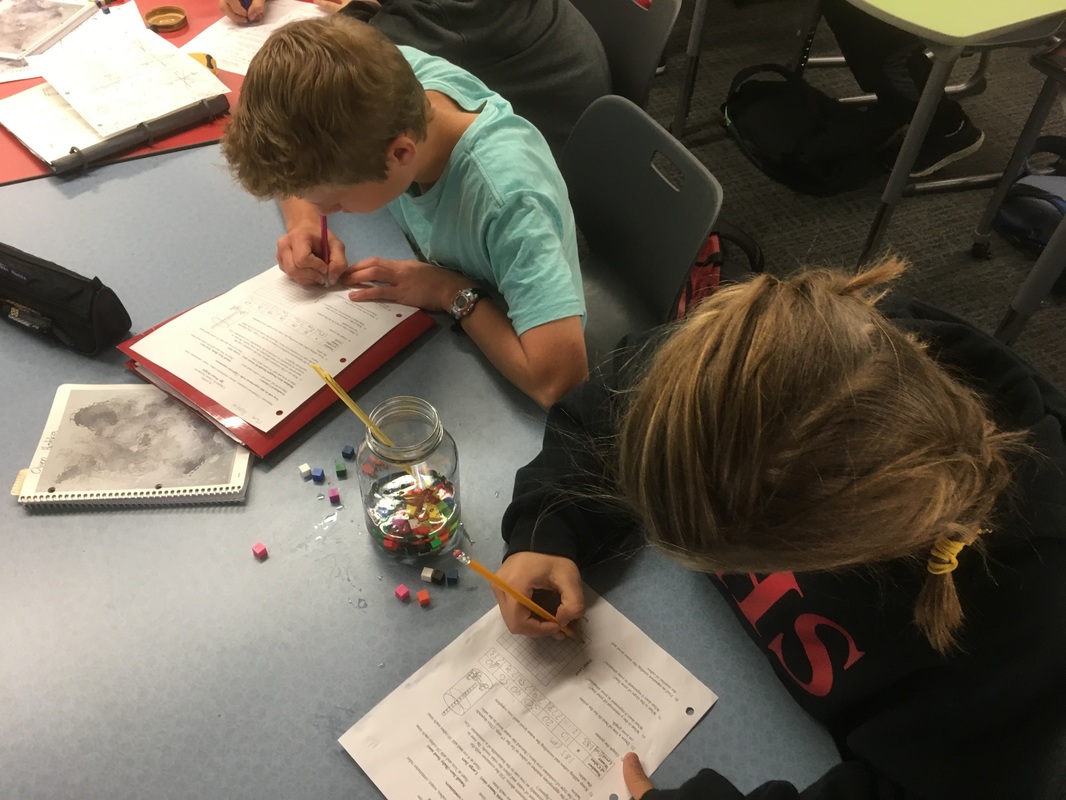
This last week we played with water in Algebra 1. My students have gone through all the typical linear stuff, but they're still weak on creating equations of lines from two points or in describing what certain aspects of the equation mean when representing a situation. To help give some motivation to practice the skill, I have a bunch of experiments in which we gather data, create lines of best-fit, and create equations to model the data. The experiments aren't amazing or anything but they beat a worksheet hands down any day. Here's the gist of how this goes. Students fill up a container with a random amount of water. They stick a ruler into the container and measure the initial height of the water. Students then add an equal amount of either centimeter cubes or glass beads to the container each time and record how the water height changes. Spoiler: the relationship is linear. Since I'm not a science teacher, I don't have all the stuff I need to do experiments just hanging out in my room. I ask students to bring stuff in. I go shopping in the science rooms. And, just in case you're wondering, science teachers actually want to help you make this work. They desperately want students to make the connections between the applications in their subject and the the math students are learning down the hall. Seriously. If I'm honest, it takes more work than I'd like to admit to pull of a good experiment but the increase in student engagement and the rapport it builds with students is amazing. And, it's fun. Fun matters. A lot. I put out a plea for staff and students to bring me glass jars. Within a couple of days I had somewhere around 15-20 jars on my classroom counter. Quick side note: I tried metal containers before but it was too hard to read the water height because of the reflection off the sides of the container. I also opted to use graduated cylinders from the science department this year. However, this put a slight wrinkle in my plans. I planned to use centimeter cubes to displace the water but I want data that isn't perfect. For those of you who aren't up on your unit conversions, 1 cm cubed is equal to 1 mL. That's about as perfect as it gets. To add some variation/spice to the experiment I had students use centimeter cubes with the glass jars and glass beads with the graduated cylinders. Since the glass beads aren't all the same size, it gave at least a little noise to the data. Students did much better when asked to create an equation from their data this experiment. However, when asked about what the slope and y-intercept meant we still had issues. In general, students nailed the y-intercept--it was the initial water height in the container. Students struggled explaining the what the slope meant in the situation. I have to keep reminding myself that what is obvious to me isn't at all obvious to an 8th grader. 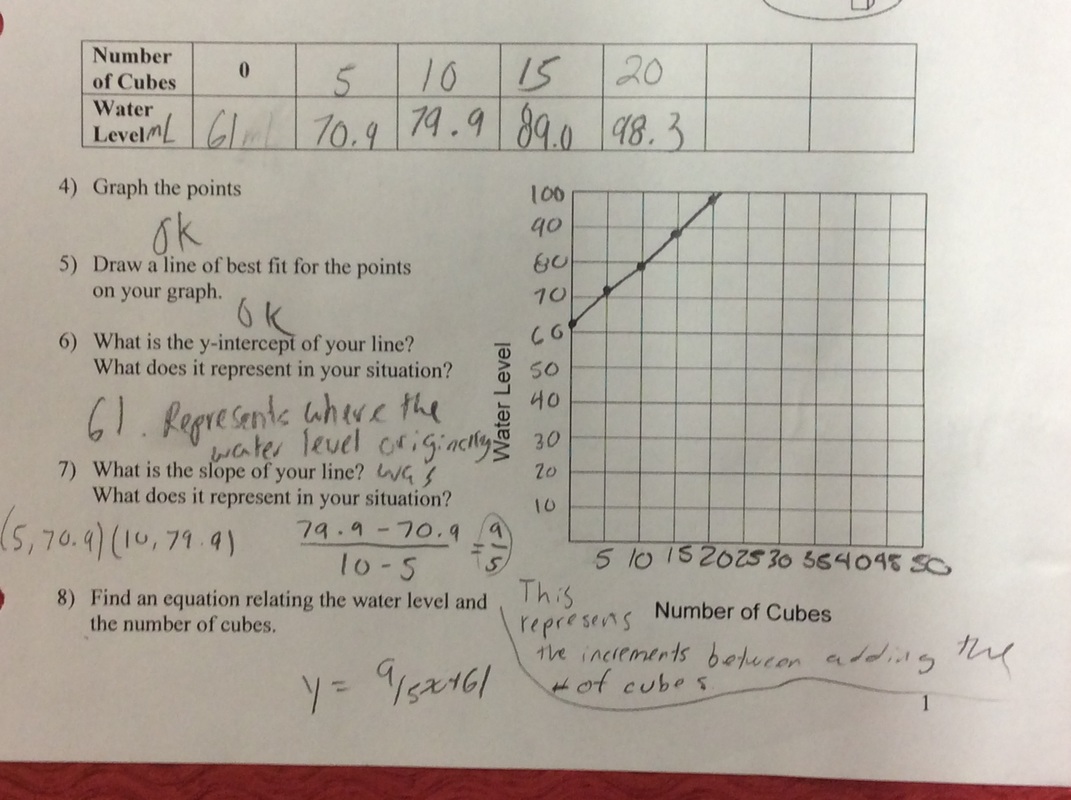 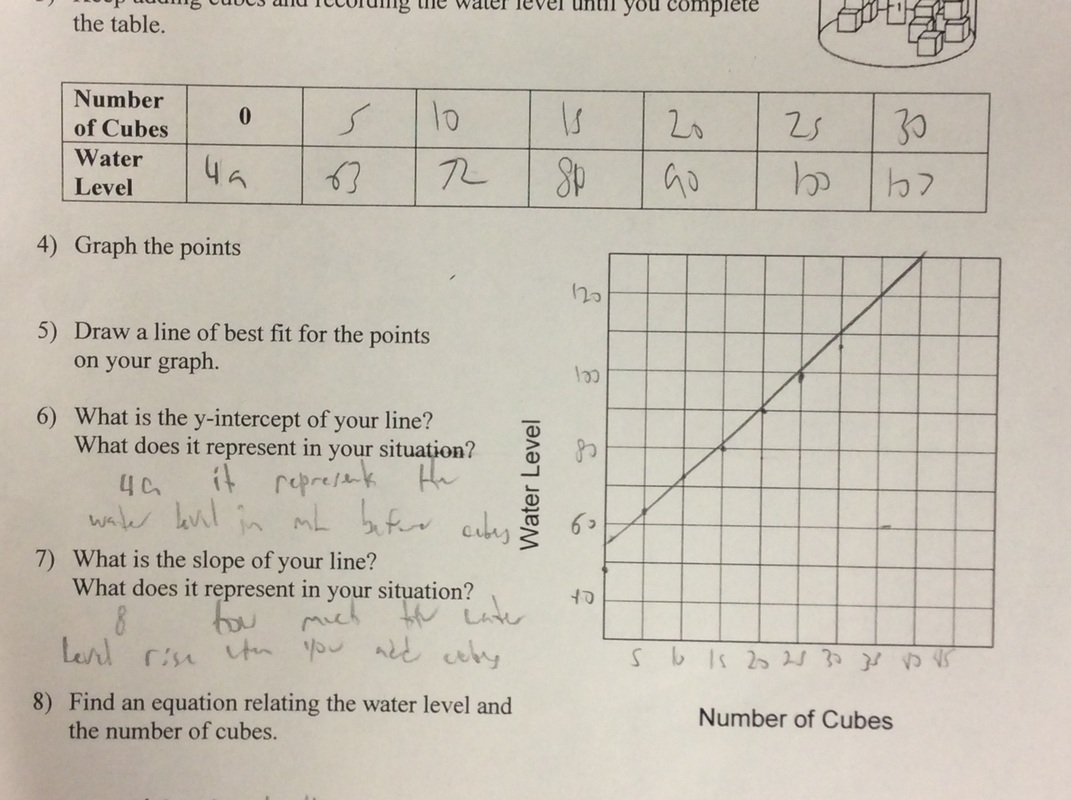 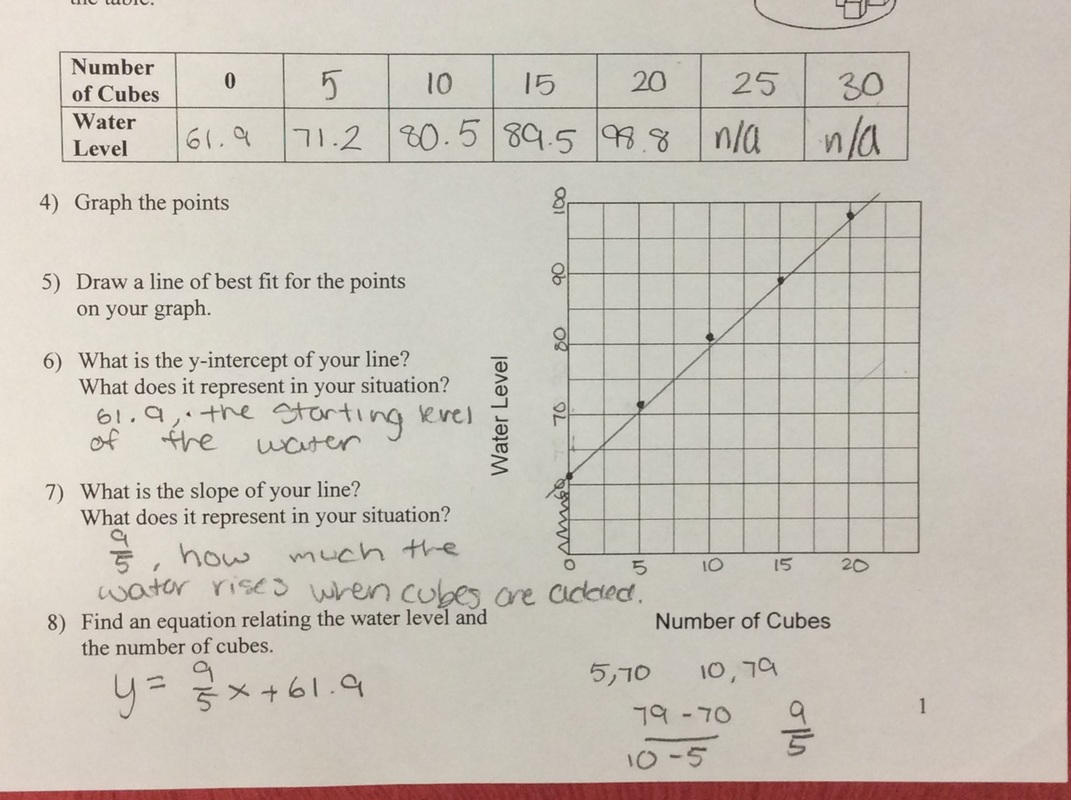 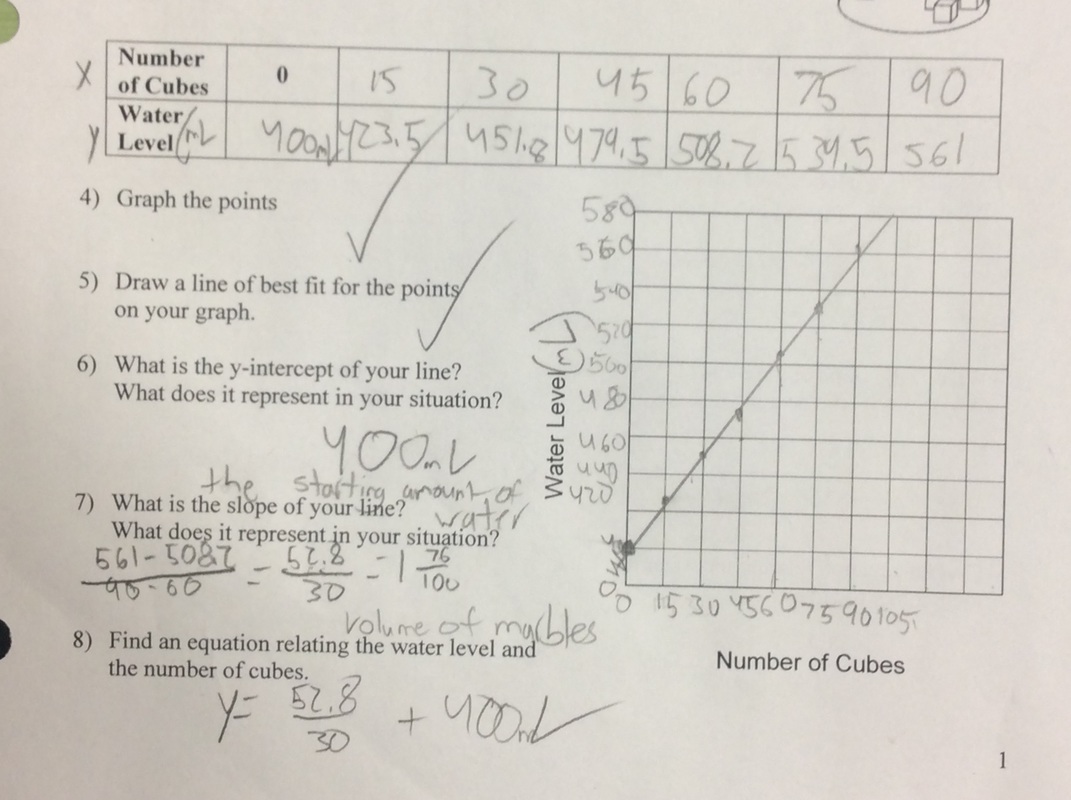 Here's my handout if you're interested.
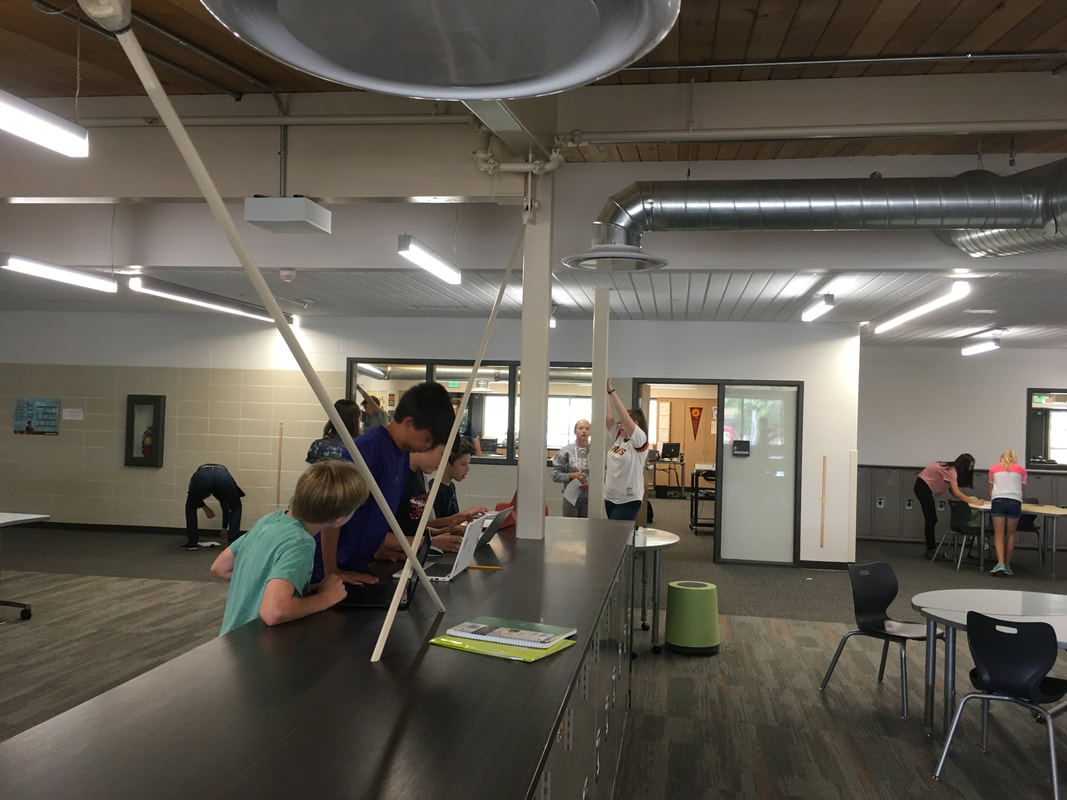
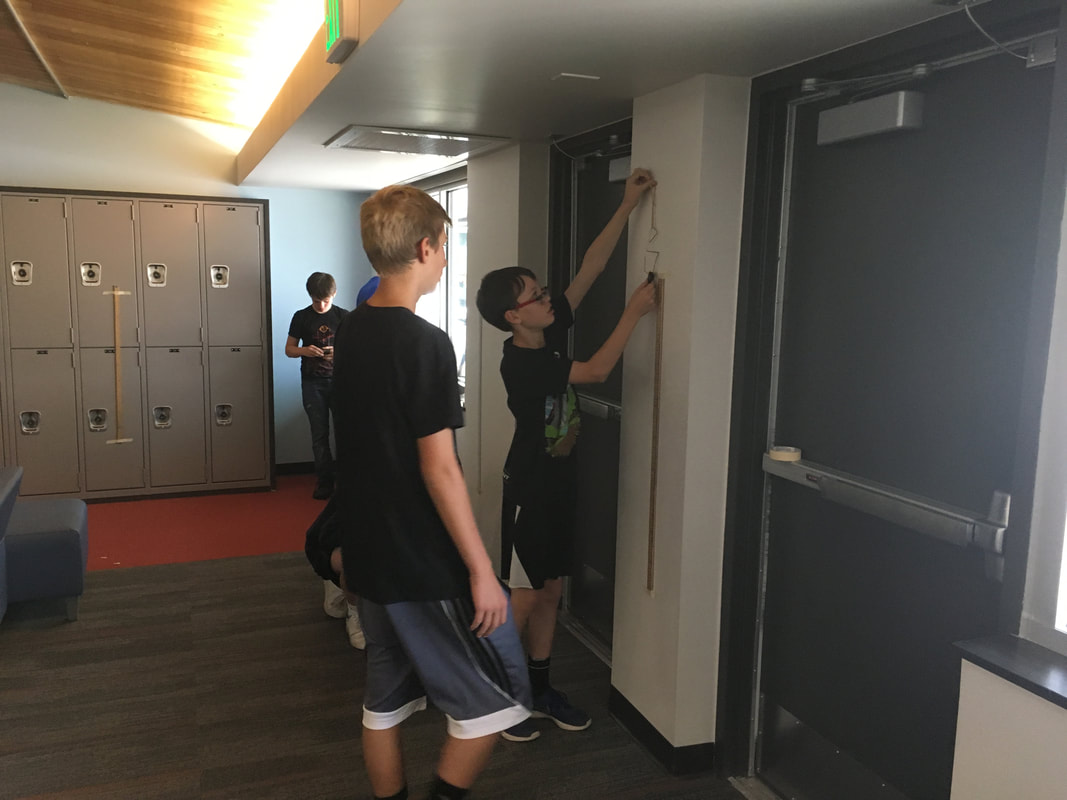
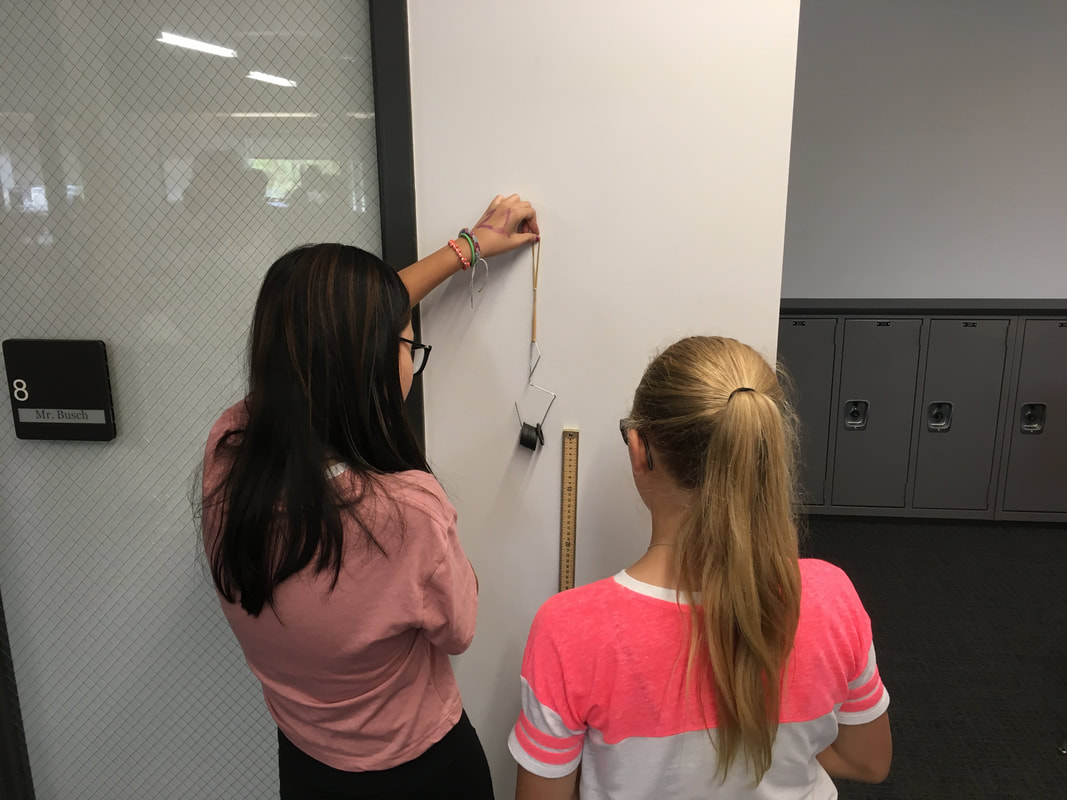
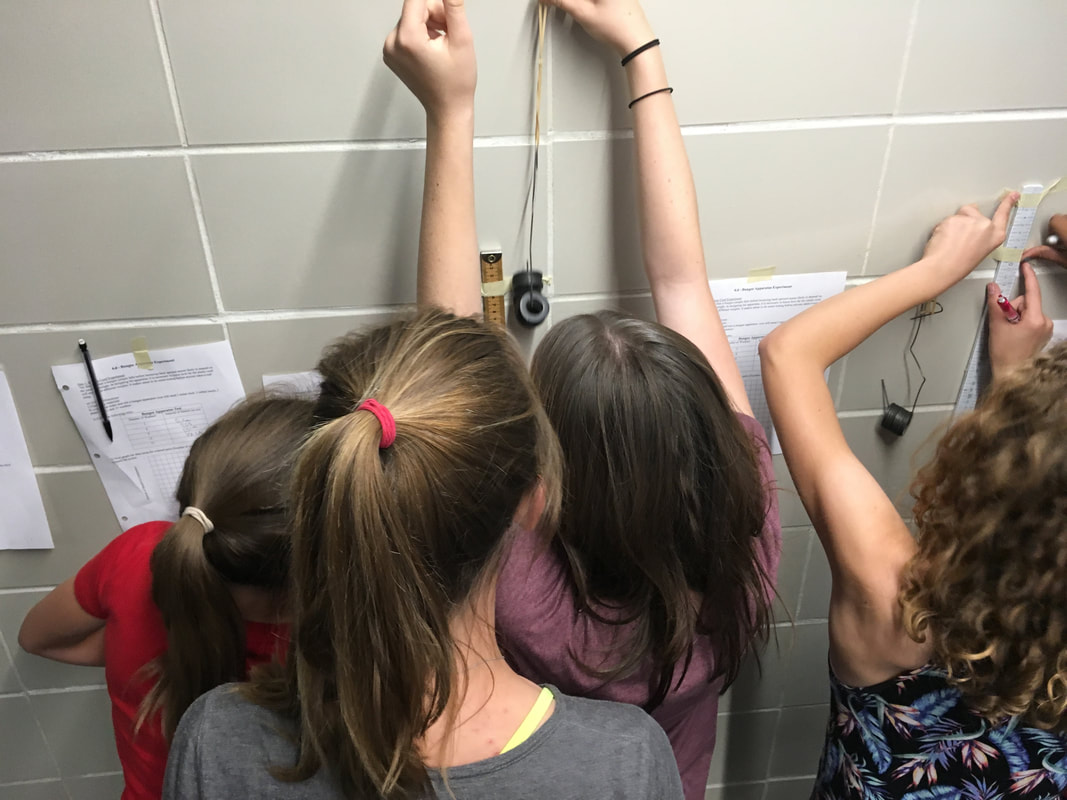
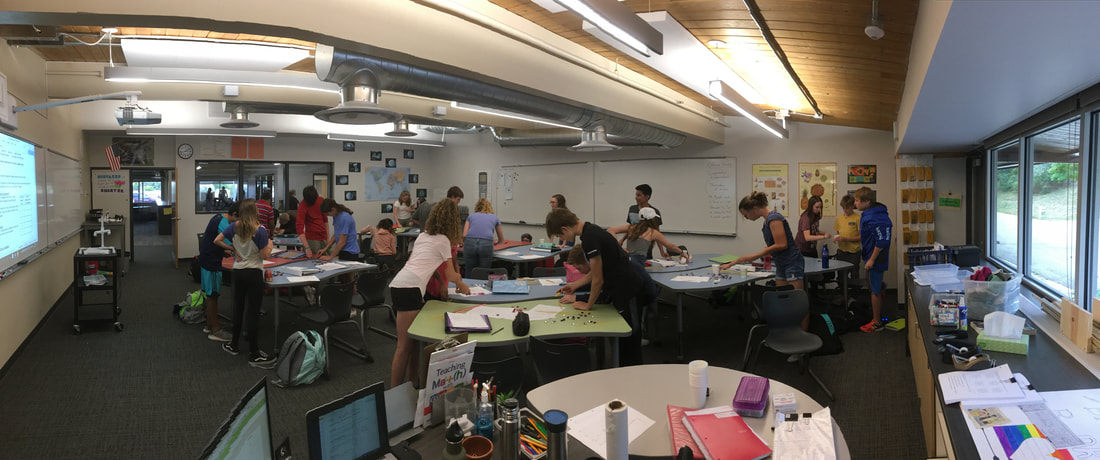
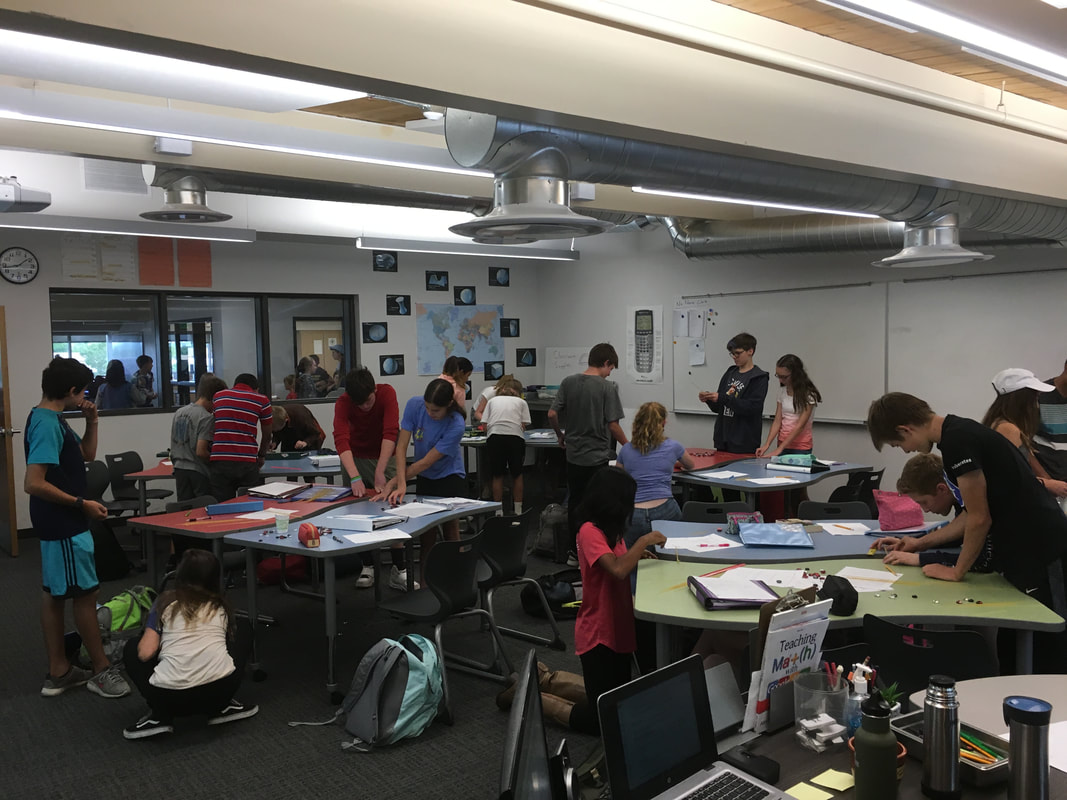
This week we start a unit on modeling linear data. But that means we need data. As it turns out, that's the fun part! Exploring linear functions in Algebra 1: Bungee Apparatus: exploring the relationship between weight and the amount of stretch. 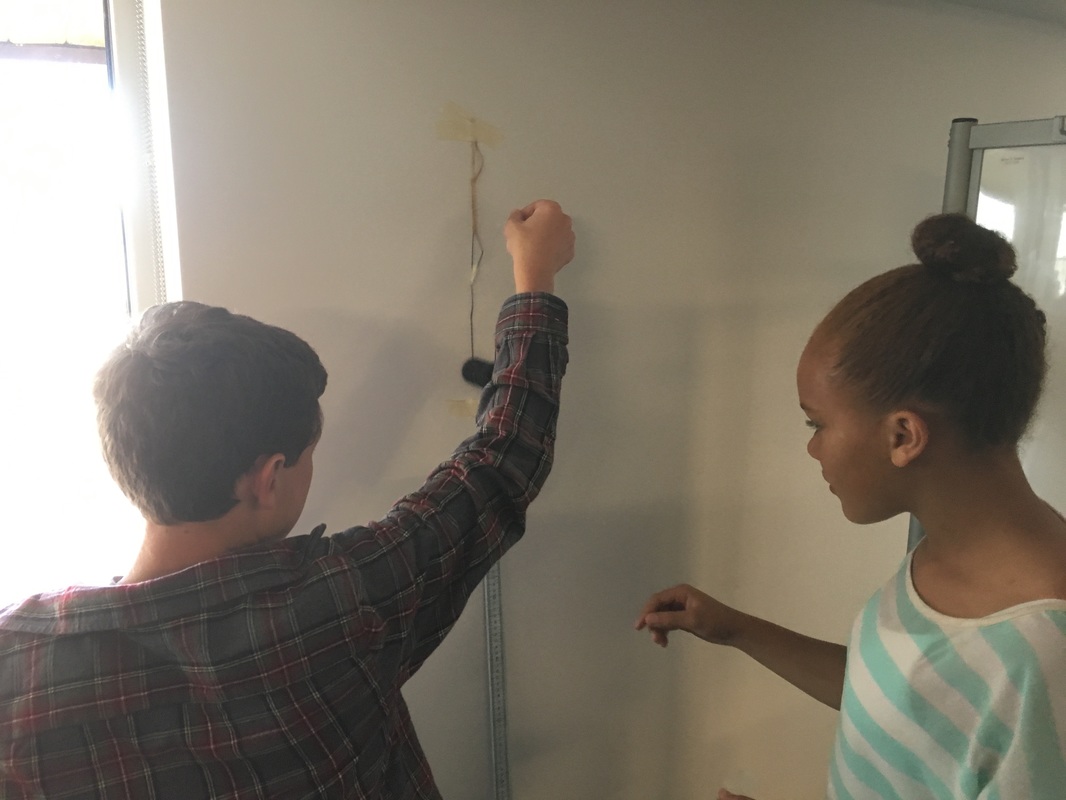  Spaghetti Bridges: looking for ways to describe how the number of pieces of spaghetti affects how many glass beads a bridge can hold. 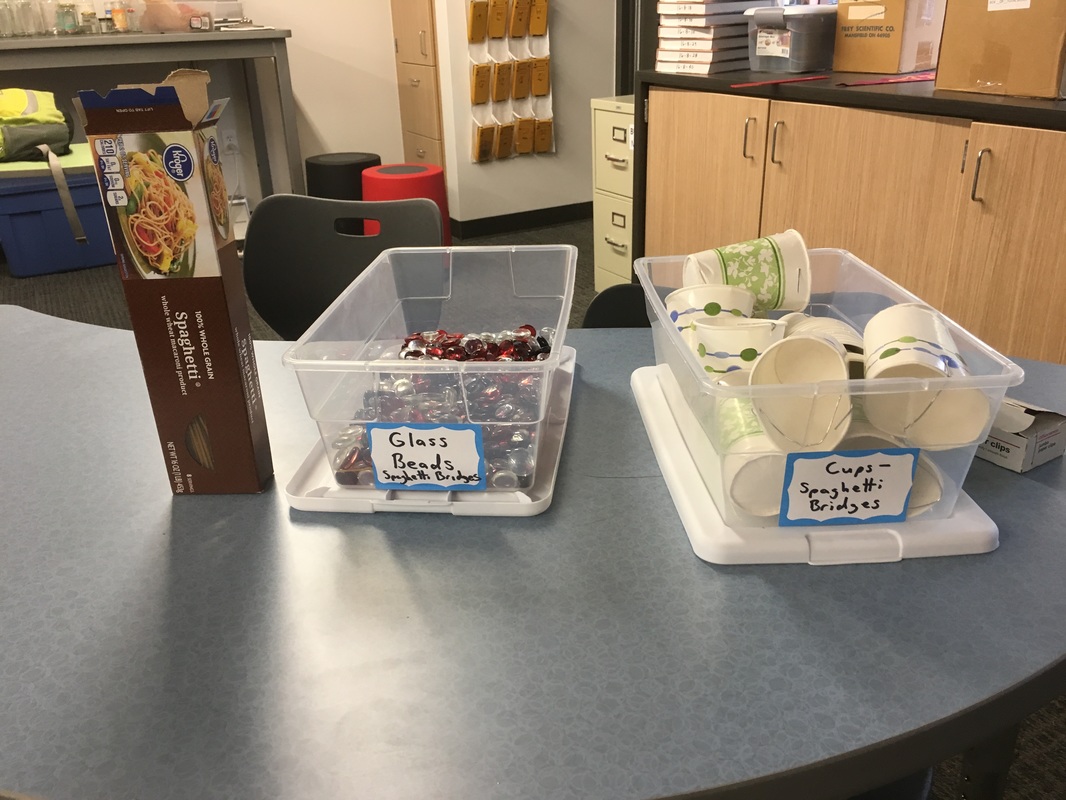 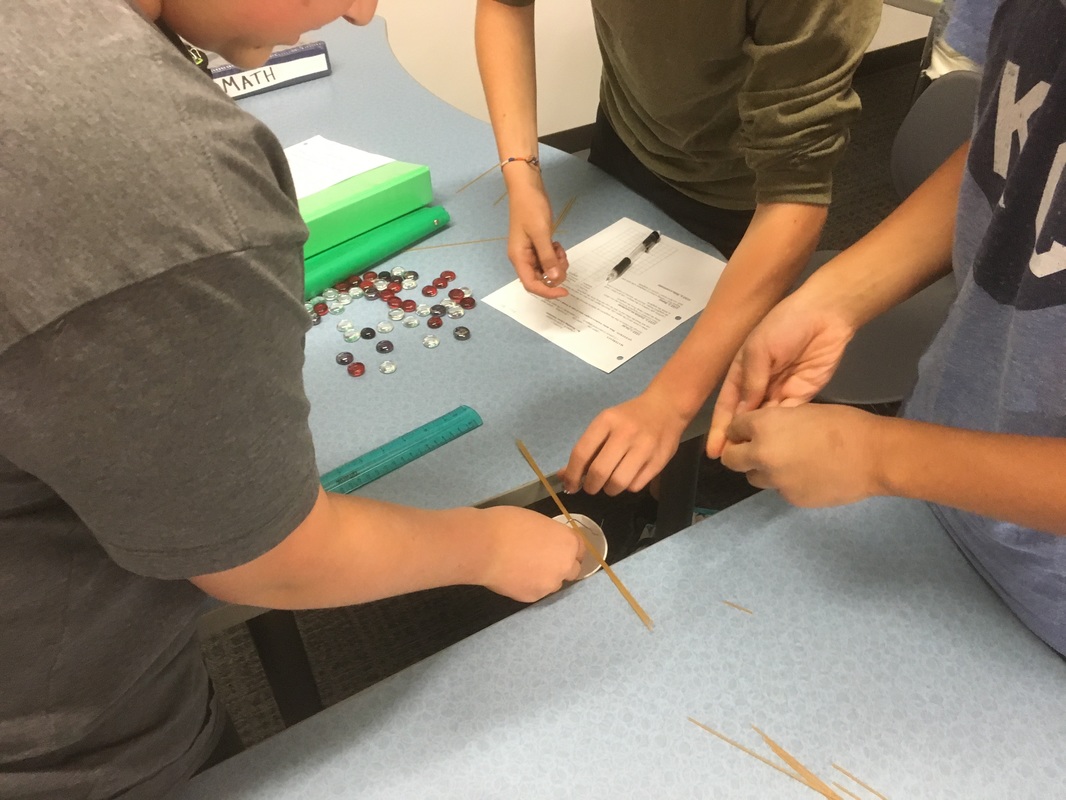 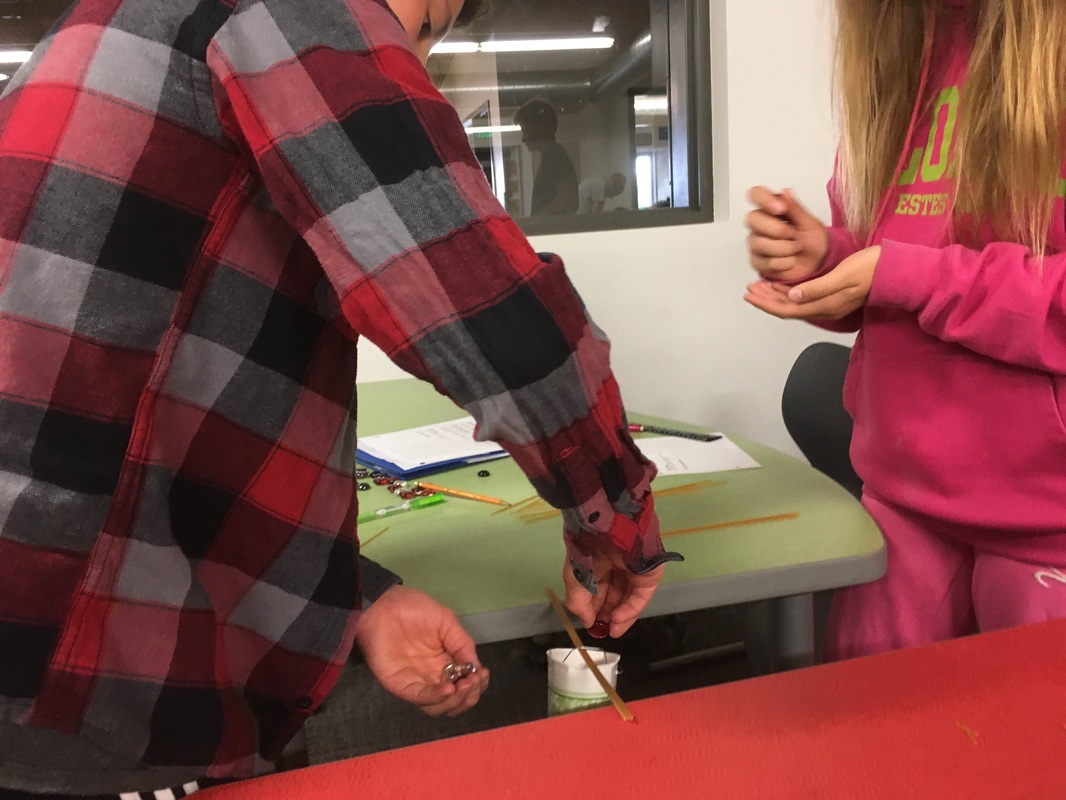 I love the conversations we have around these tasks. The physicality of the task ends up being an excellent mental hook for students to come back to when talking about topics like: independent and dependent variables, interpolation and extrapolation, correlation, error, and regression. The lineup over the next two weeks:
-water height based on how many cubes we drop into a container, -how the pull-back distance of a toy car relate to how far it goes forward, -the gender pay gap in these United States, -Barbie bungee jump I'll do my best to put up pictures as we go. This is an epic month for Algebra 1 if there ever was one!
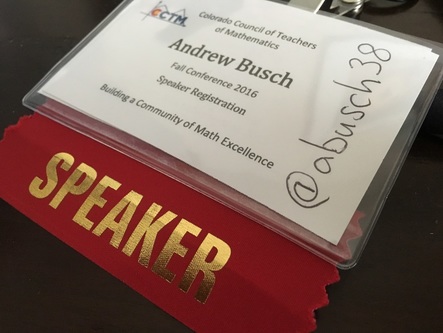
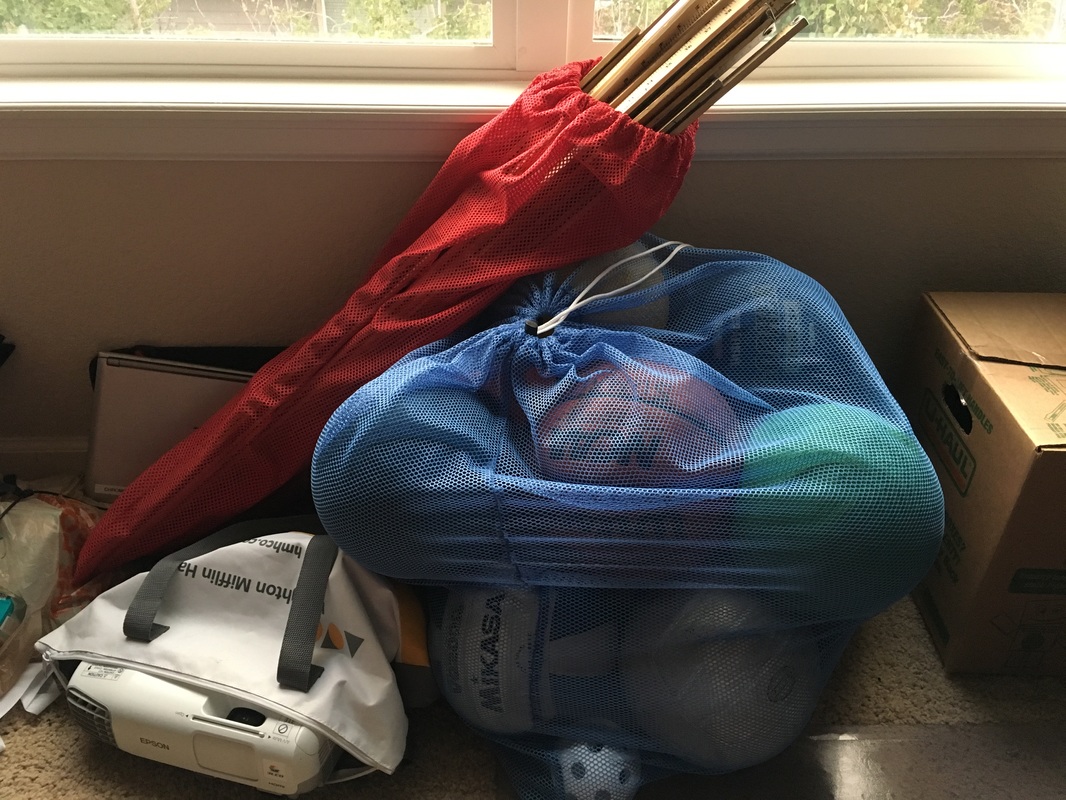
This past Friday I had the opportunity to present at my state math conference (#CCTM16). I think I was the only presenter that needed a wagon to bring in all my supplies. Not kidding.
I presented on one of the few things I'm good at--getting students out of their seats and getting students talking to each other. Over the past 4-5 years I've been on a journey to involve more more active learning in my math classes. It's a bit more than just 3-act math or problem-based learning. Don't get me wrong, I love me some Math Assessment Project or Emergent Math. There are all sorts of wonderful things happening in the world of online math teachers that wasn't happening 10 years ago. I totally dig it. But that's not really what floats my boat. I'm interested in students modeling the world around them. All the better if they can also be the ones to run the experiment and collect the data. Basically, as close as my class can get to a physics class--the better. It's probably because I married a physics girl.
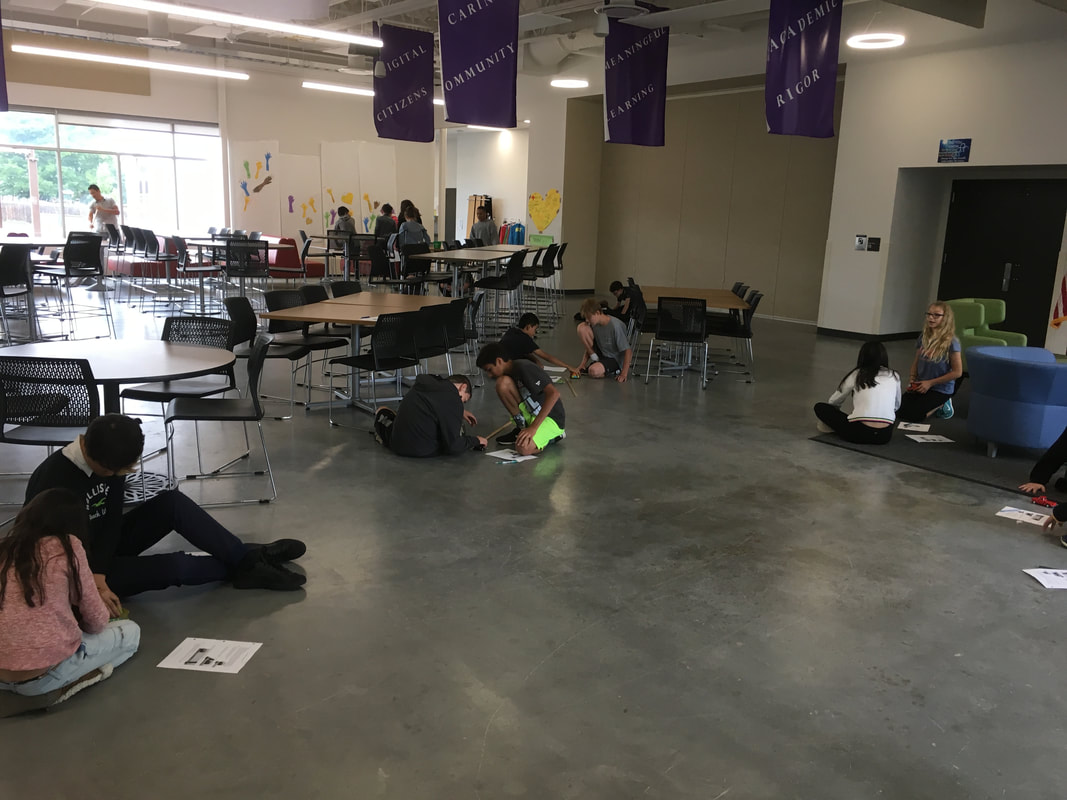
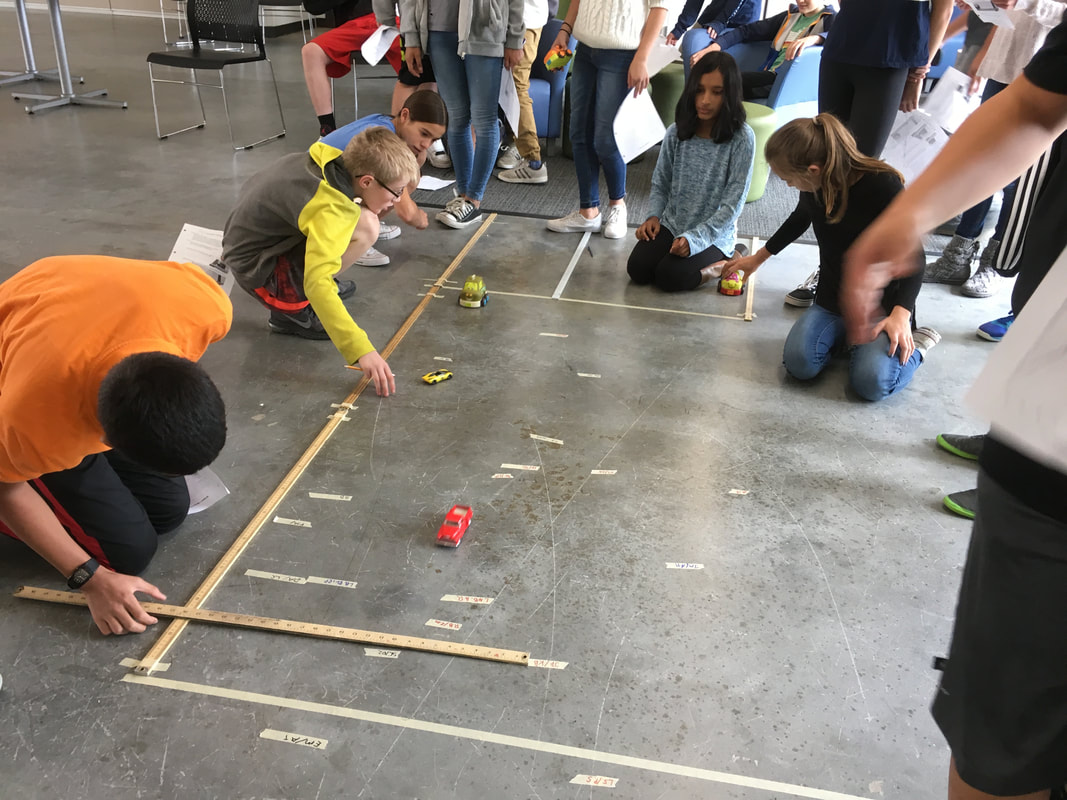
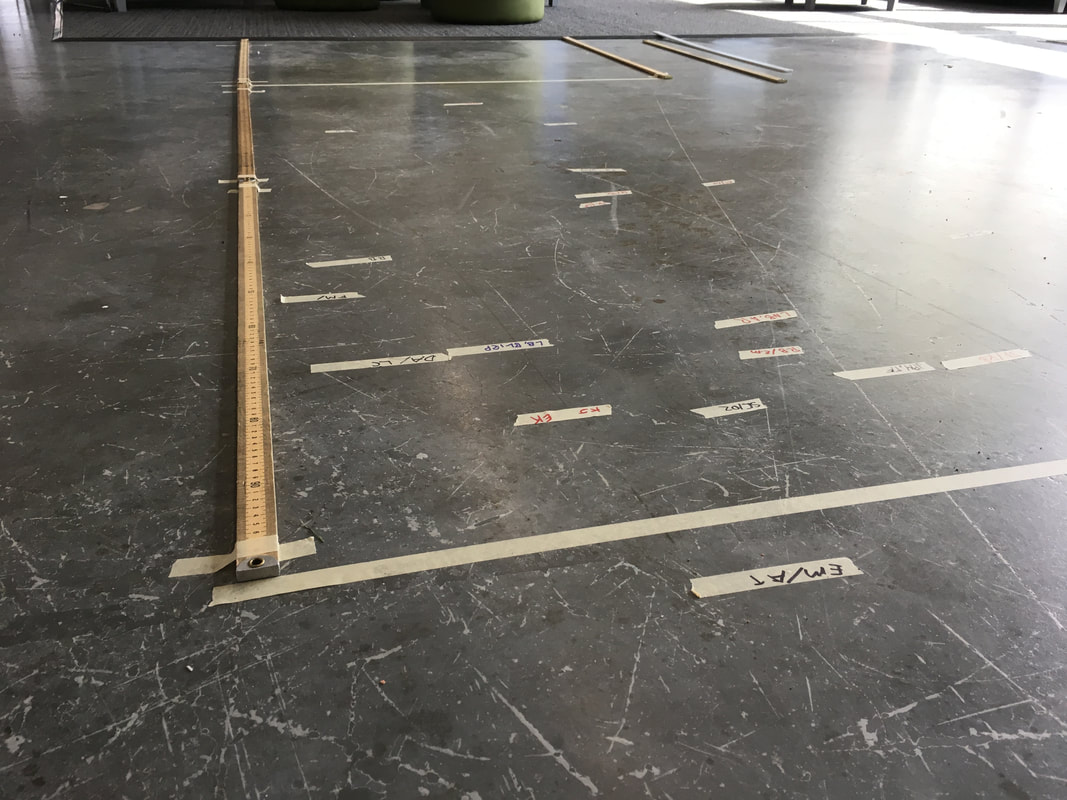
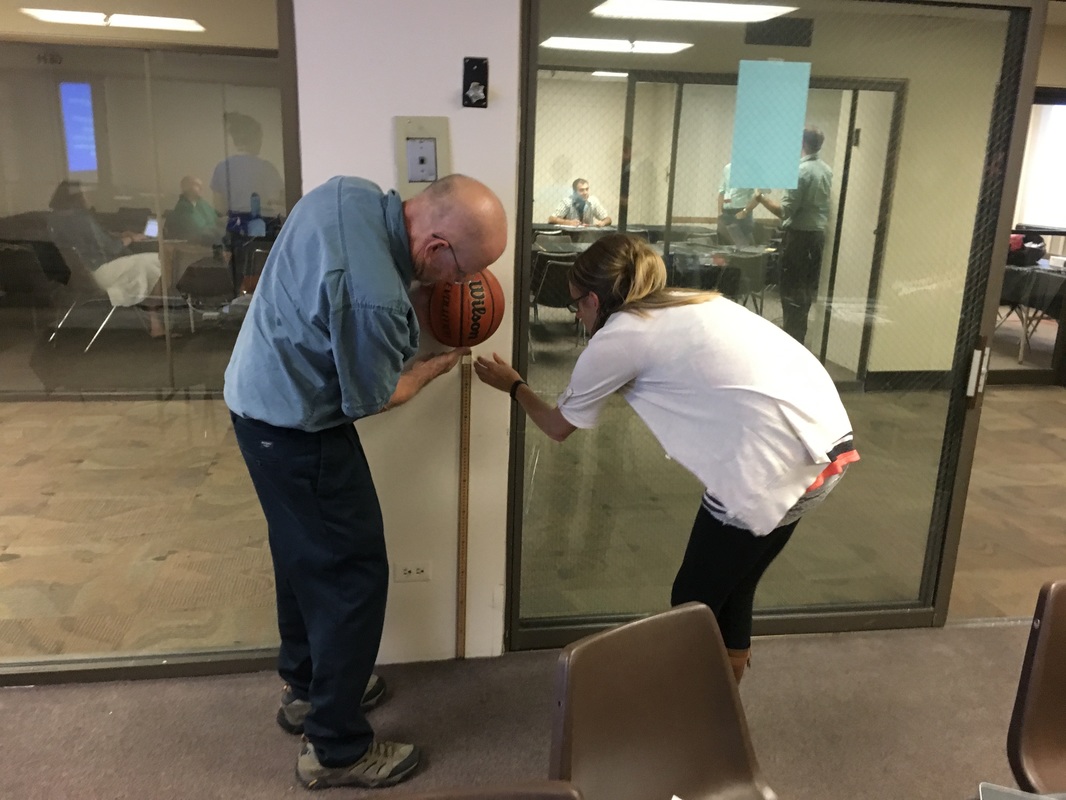
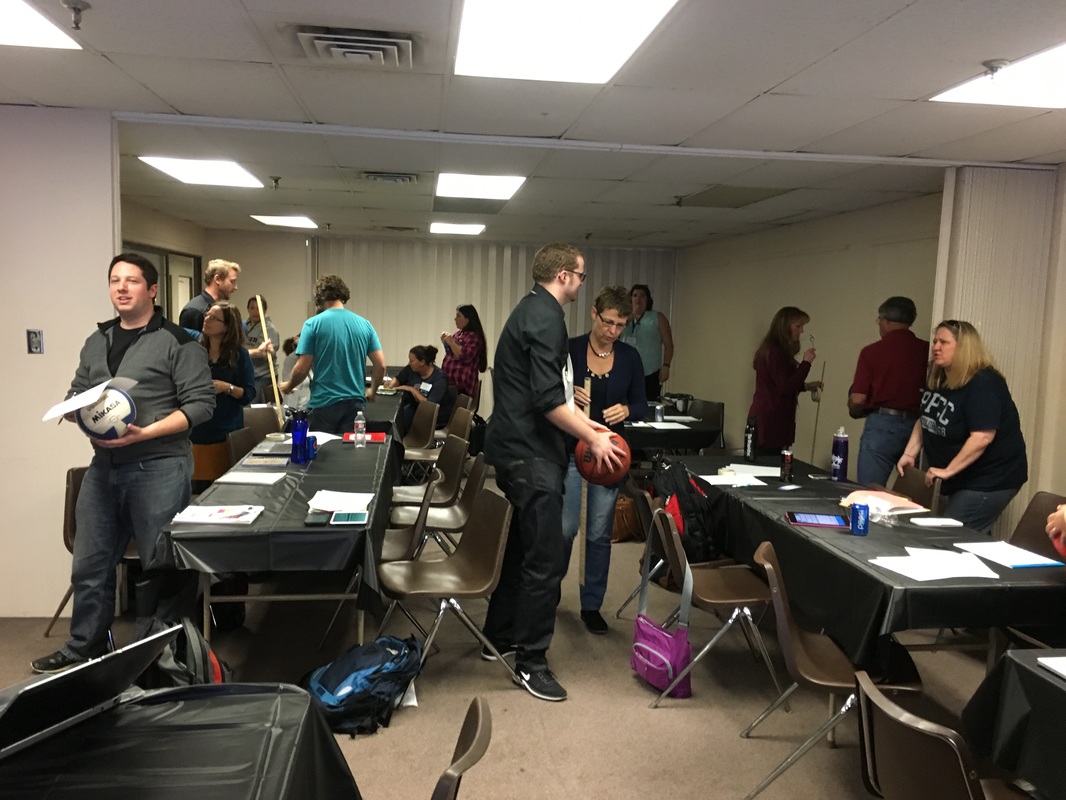
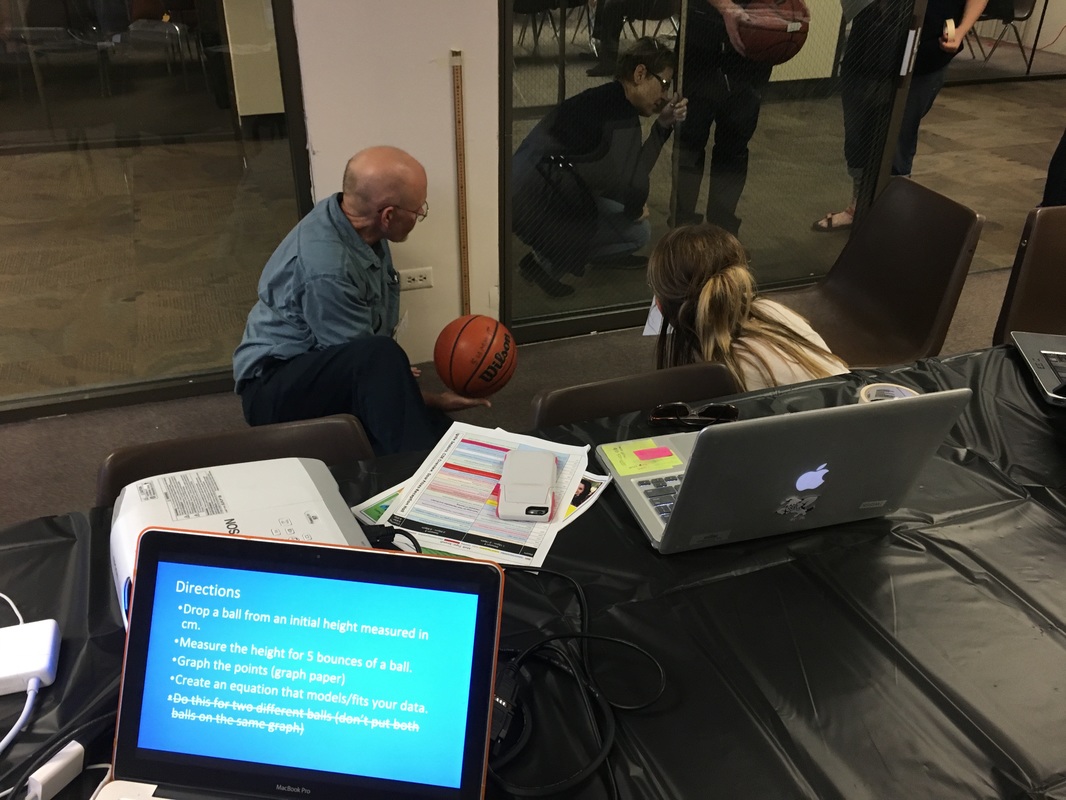
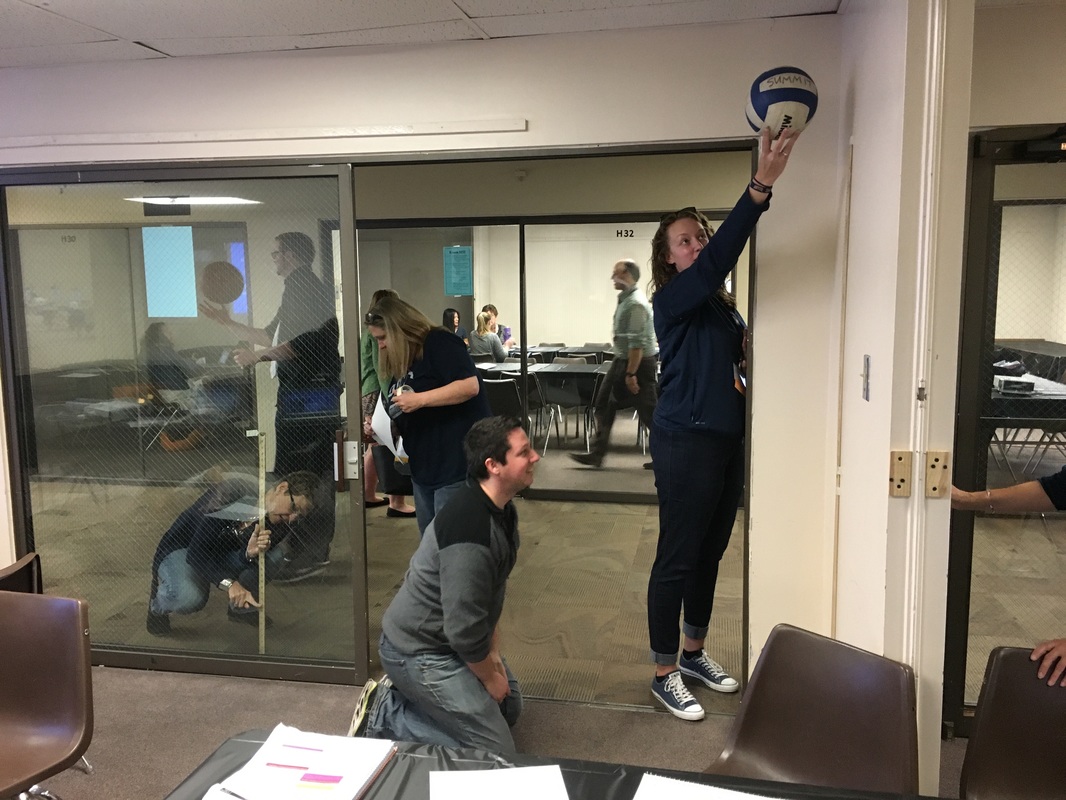
So, I presented on what I know; doing experiments in math class. We started out with a quick intro about how this isn't meant as one more thing you can add to your classes. This is meant as a replacement for something you already do in your classes. Math classes in the U.S. already try to do too much. Adding one more thing isn't helpful. Because it would be super awkward to spend 50 minutes talking about active learning without actually doing something we started out with an experiment: ball drop. I had the participants arrange themselves in groups of two or three. After a sudden death round of rock-paper-scissors, the loser came up to get supplies for the group. Here's the slide I put up for directions. 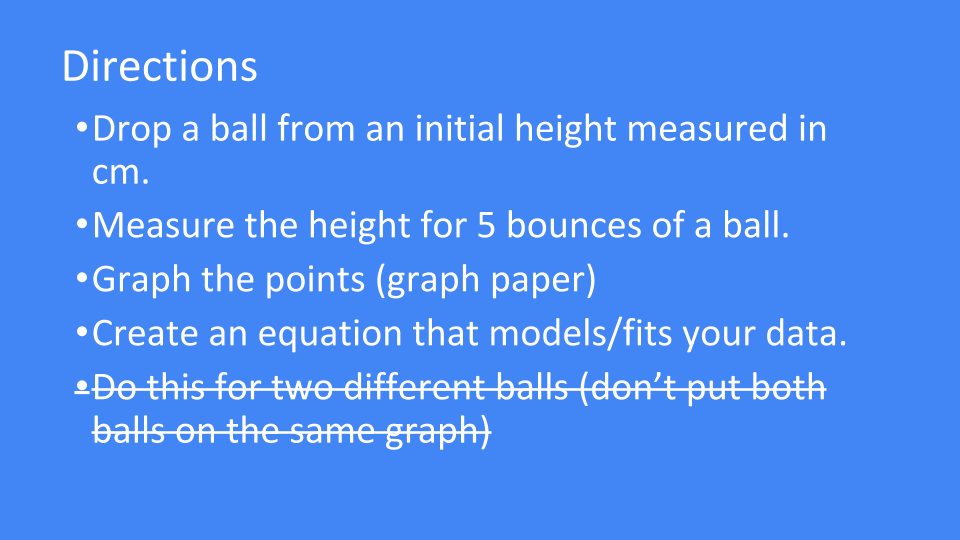
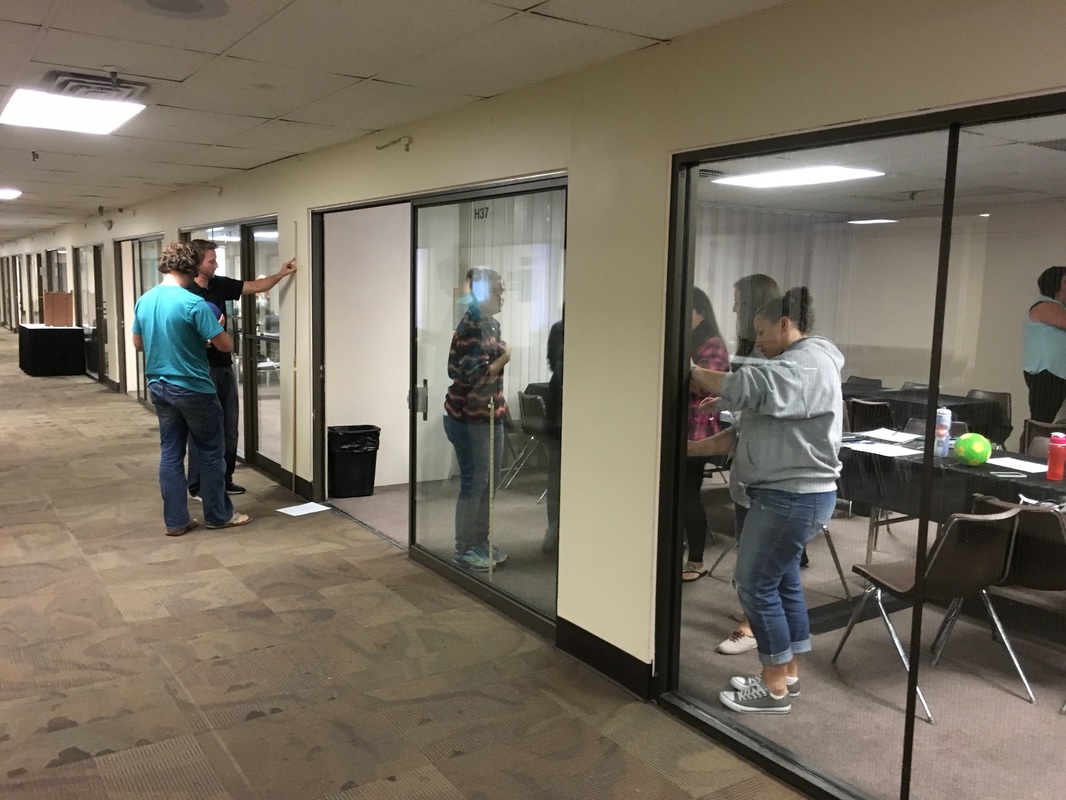
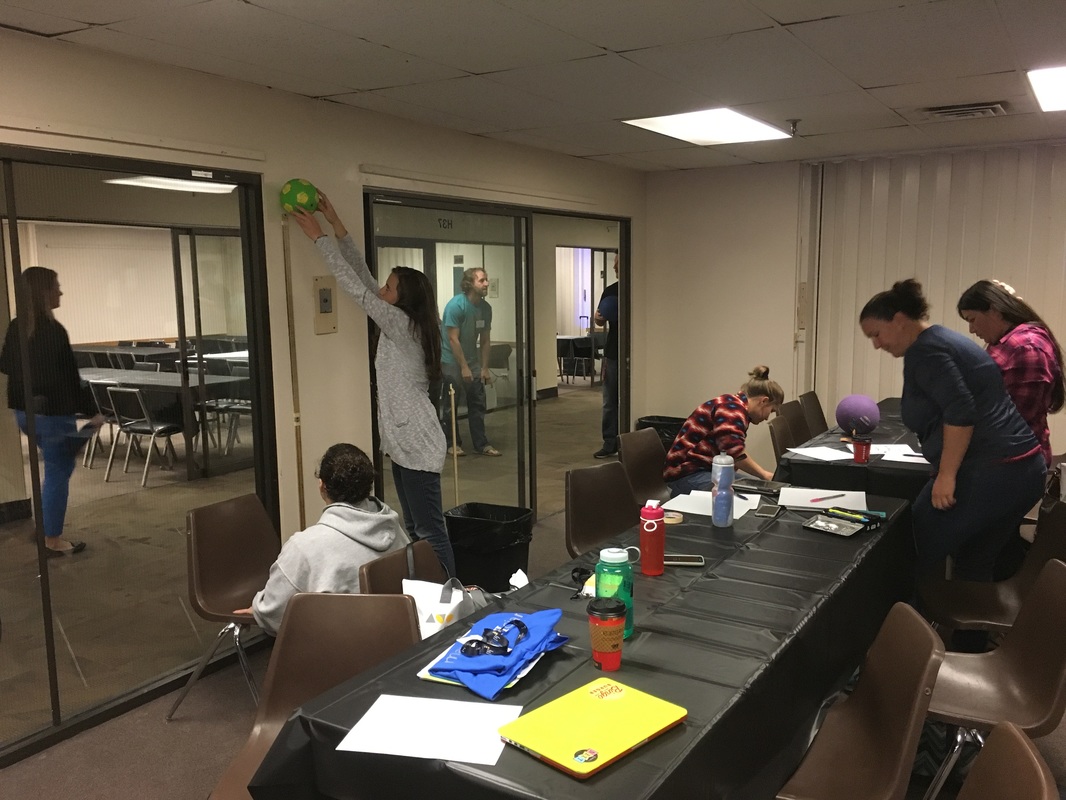
I didn't give much more help than that. Some groups had issues counting the 4th or 5th bounce. For those groups who struggled I made a observation that catching the ball at the top of the bounce and then dropping it would not change the data. I think we were the only session of the day to have participants on the floor or actively using the hallway. Epic!
While groups were busy trying to model the data, I went around the room asking questions and taking pictures of solutions strategies I wanted to discuss as a larger group. When I called the groups back together for a whole group discussion, this happened:
My Reflector2 app stopped working. I have this app that allows my phone to mirror to my computer screen. Normally, it works well. It had worked well the 10 minutes prior to this moment. Curses. Time to do what you would do in a classroom--switch strategies.
We did our best to talk about solution strategies without looking at pictures. The room was very gracious about it. A classroom of students would have revolted.
Then we hobbled through talking about how running a classroom experiment naturally flows into covering the CCSS math practice standards and the Principles to Actions math teaching standards. Again, super hard to make seamless connections without the major component of those connections--student work. But, this was a room full of sympathetic math teachers/coaches and they helped me out.
That's when we finally got to talk about some of the wicked cool experiments we can do in math class without needing a physics lab. Well, at least for most of them. I've got the presentation linked below, so I won't go into details here. The gist of what I wanted to say to them was, it's not too hard. You can do it. Ask the science teacher down the hall for help. For real. Ask her. She will LOVE it that you want to do an experiment and will help you gather supplies. Not joking. The physics teacher will probably even set up a lab for you more than once. Again, not joking.
I've already hear back from one person: "I was inspired enough to try it! I'm going to try to do a lesson with perimeter, area, and volume next week. I stole some boxes, meter sticks, and string from my science teacher next door. You were right, he was excited to help. He already had the boxes made for a lab they used to do. I'm going to try to use different balls for my students who need some more complexity and boxes for the students who need more straight-forward data collection." - Mike That, my friends, is awesome!
All in all, it was a good experience. I didn't die like I thought I was going to. I might even do it again sometime. Except it would have to be on the exact same topic. I feel a bit like a one-trick pony.
Here's the slide deck for the presentation:
AND, you should be super jealous, I ate lunch with this wonderful #MTBoS crew! From the left: @MathEdnet, @lisabej_manitou, @pwharris, @0mod3, and me. 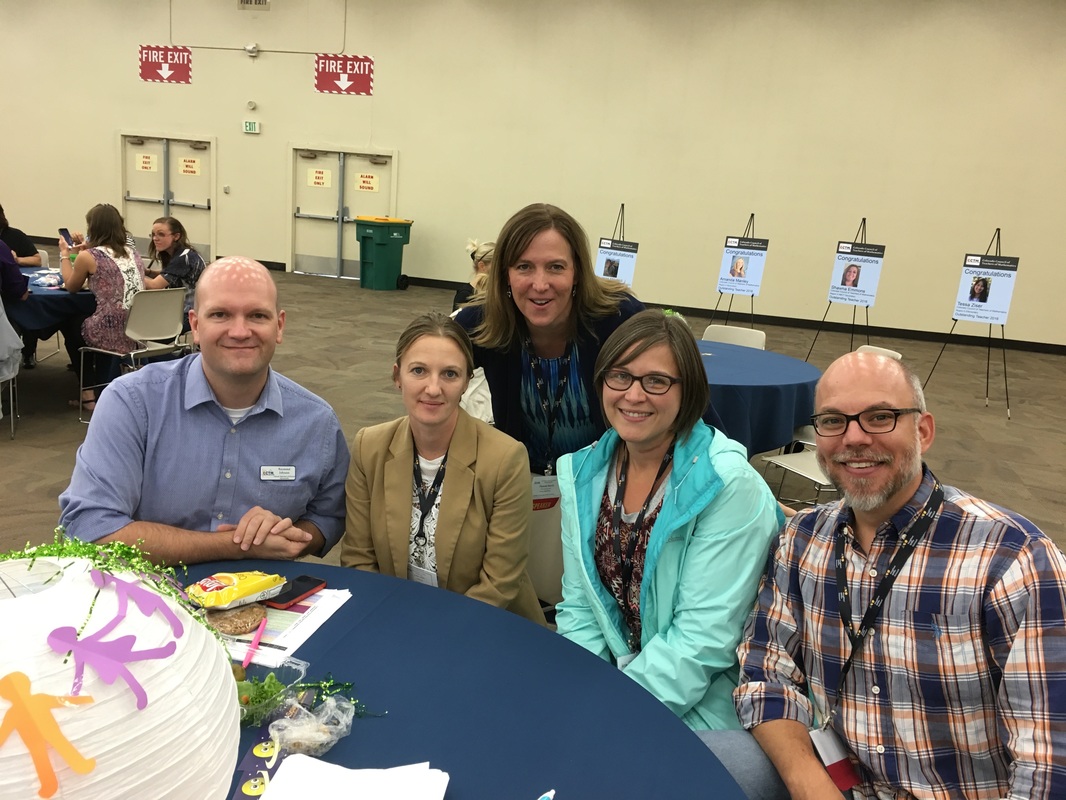
This coming Friday I have the pleasure of sharing some things I do in my class with other math teachers. Super stoked! #CCTM16
I get to talk about something near and dear to my heart--using experiments in math class. Rather than chat people up for 50 minutes, we're going to start off by doing an experiment together. The link is pretty old but you'll get the picture.
My goal is to give teachers an experience in which they see this type of lesson not simply as an add-on but as a replacement for some of the normal classroom lessons. After modeling exponential decay with bounce height, we're going to do some discussion modeling a la 5 Practices. I really should get a kickback for how often I plug that book. Then we're going to switch into teacher mode and look at the CCSS Math Practice Standards and NCTM's Principles to Actions Math Teaching Practices. It's amazing how naturally you can hit multiple standards--about 5 of the #CCSSmath and 5 of the #NCTMp2a without trying that hard. The rich conversations we have in class after these rich lessons help lay the foundation of conceptual understanding that procedural fluency builds on. If nothing else, I'll have a good time. Here's a link to the presentation. The question: How many cups tall am I? Ready? Go! 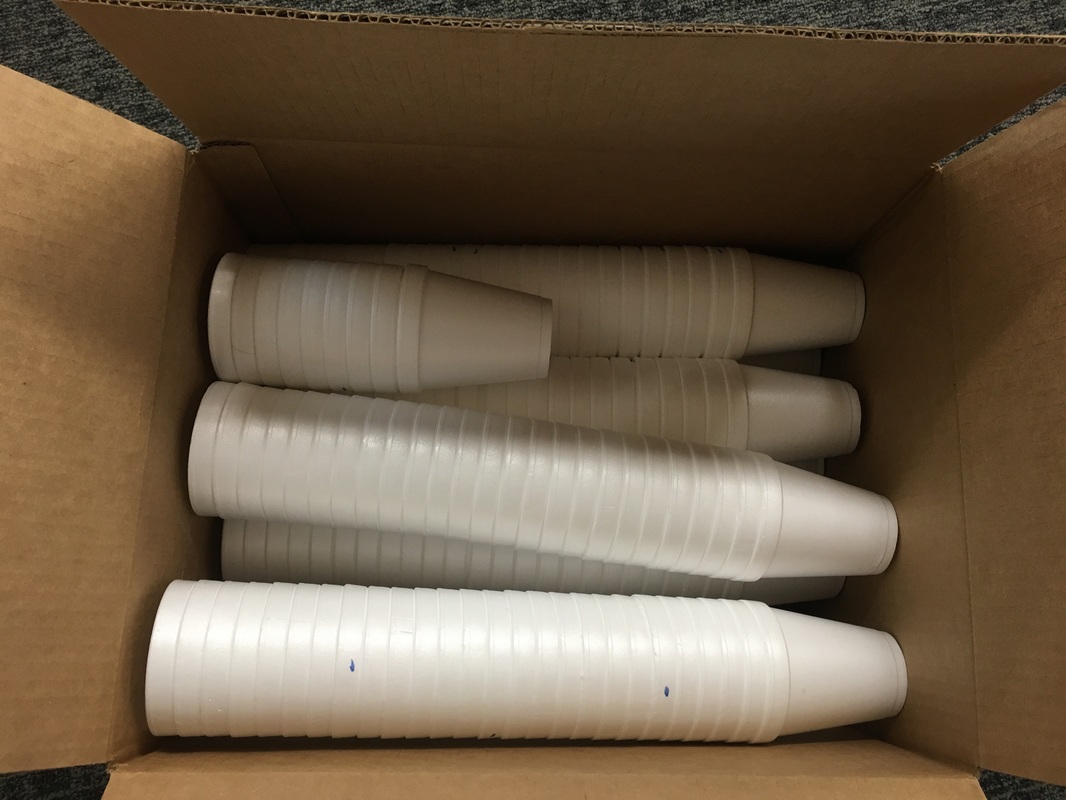 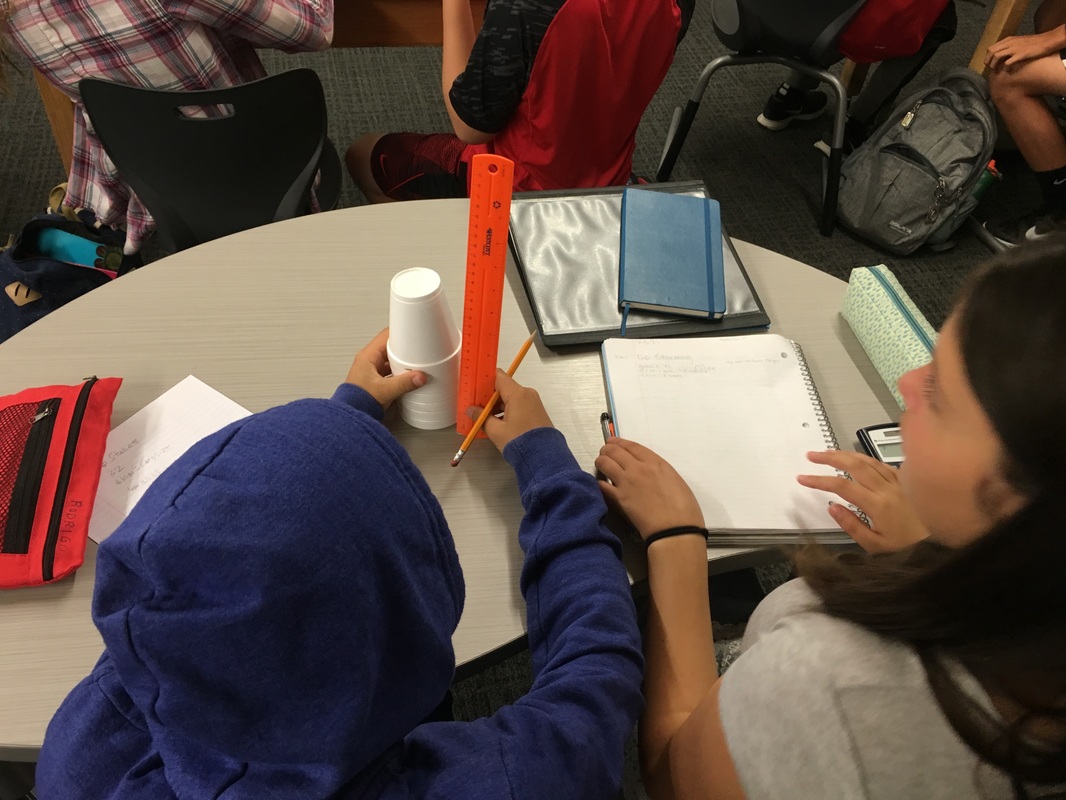   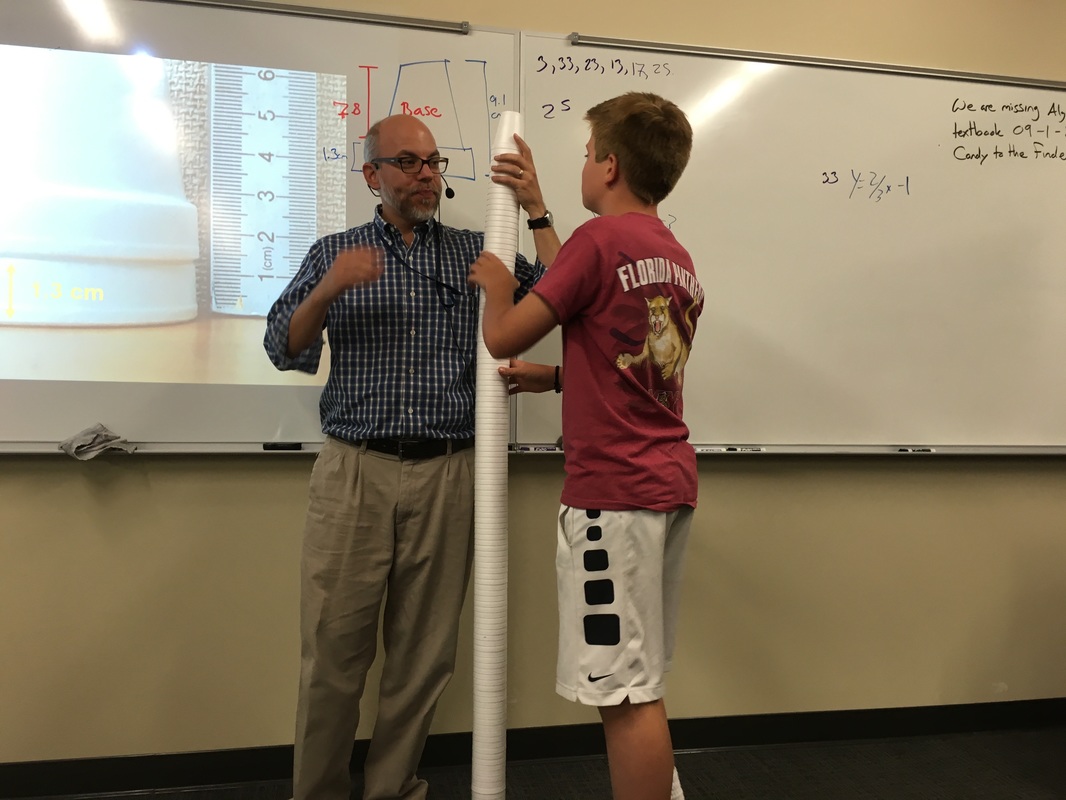 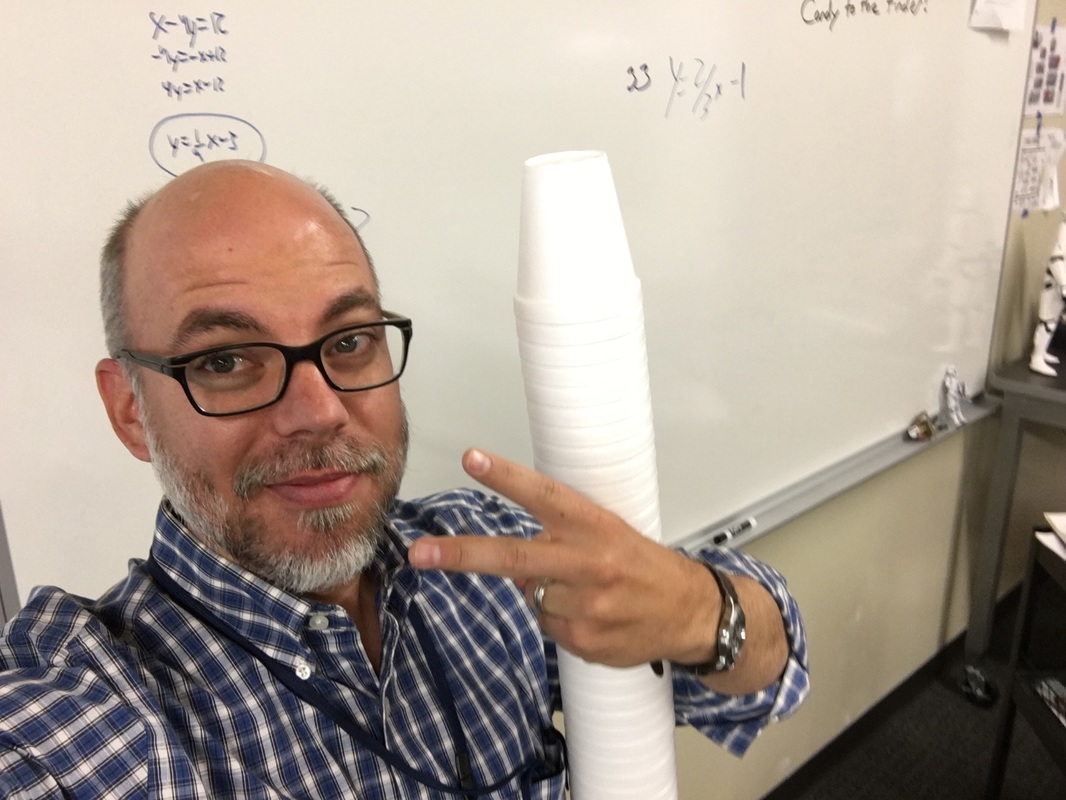 |


Andrew Busch
I teach Math at Ralston Valley High School in Arvada, CO. Categories
All
Archives
March 2019
|
|||||||||||||||||||||||||


 RSS Feed

