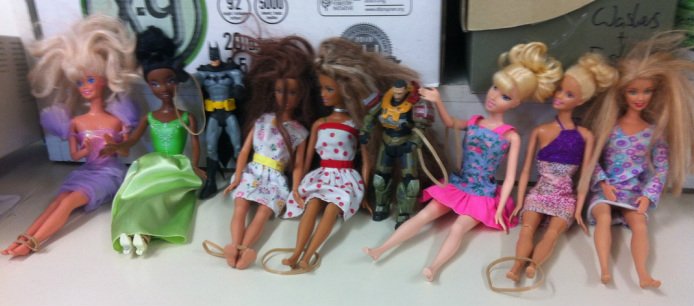
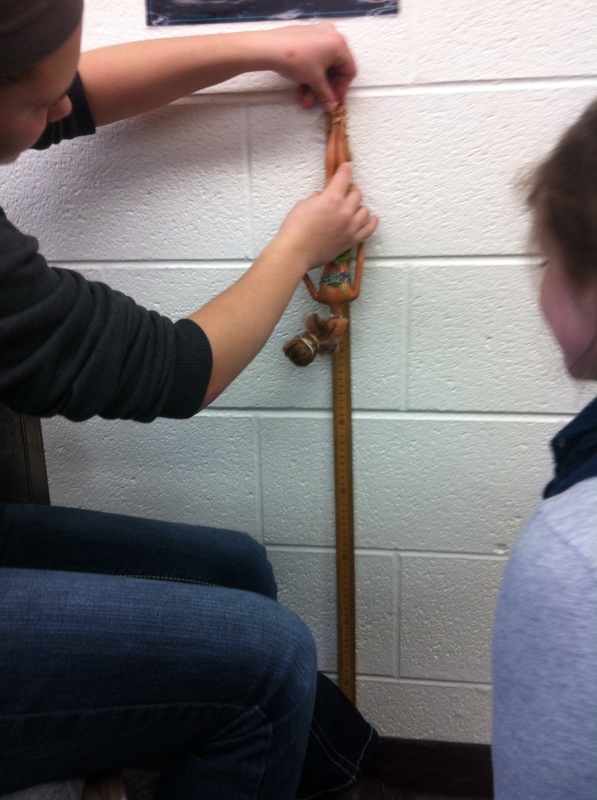
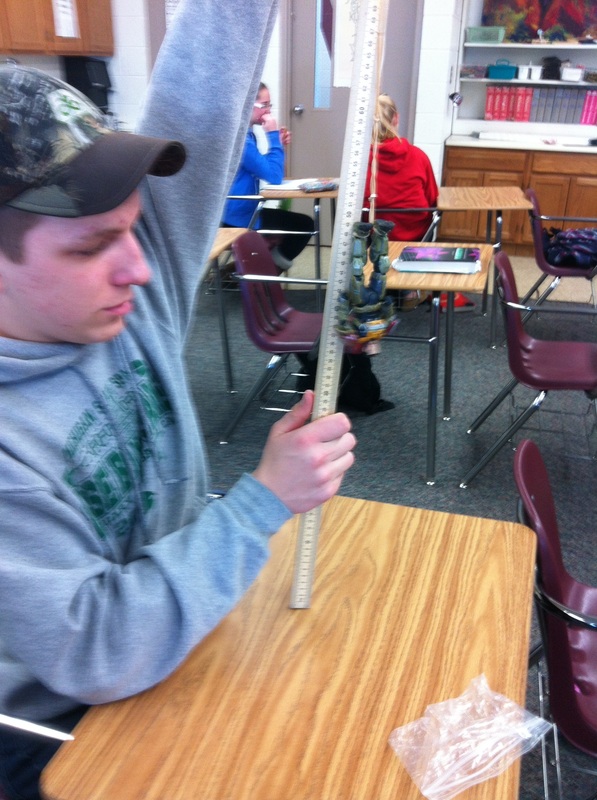
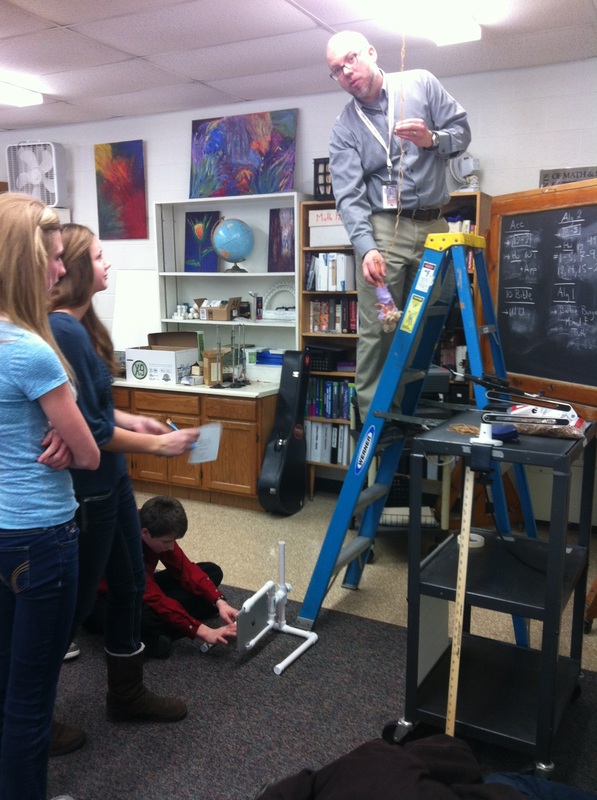
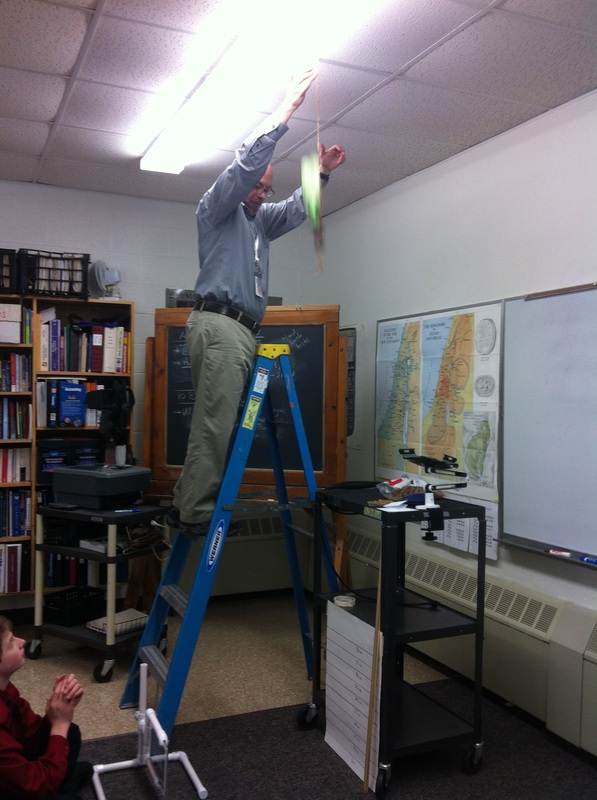
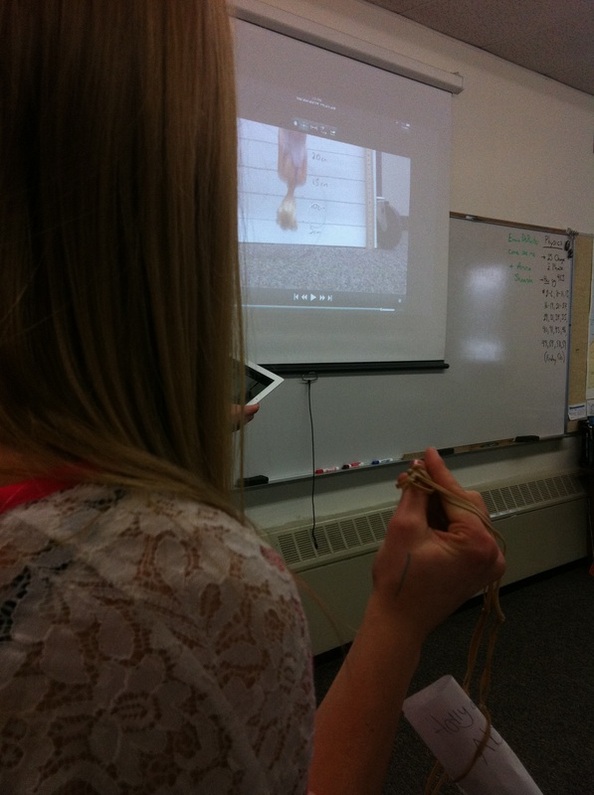
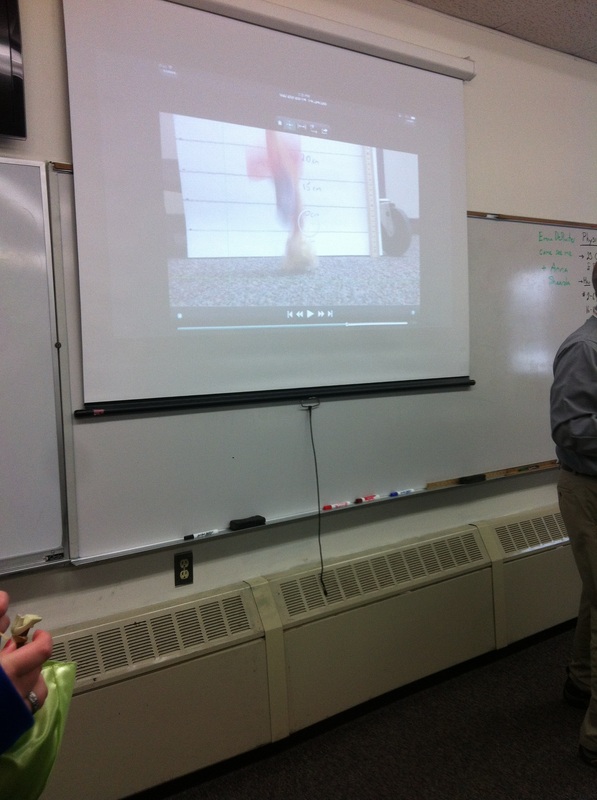
Many of the groups looked at the table and found the average rate of change and the y-intercept (both the winners and the runners up did this). One group graphed the points and used the line of best-fit (I love it when they see those connections!). One group doubled their data from 7 rubber bands and saw that it wasn't enough and then tripled it. They saw that it was too much so they found the average stretch per rubber band and then took away as many rubber bands as it took to get under the height from the floor to the hook in the ceiling (282.5 cm). Novel but unfruitful. They didn't take into consideration Barbie's initial height so they ended up being pretty high off the ground when all was said and done.
All in all, this was a great project to end our study of linearity in Algebra 1.
 RSS Feed


