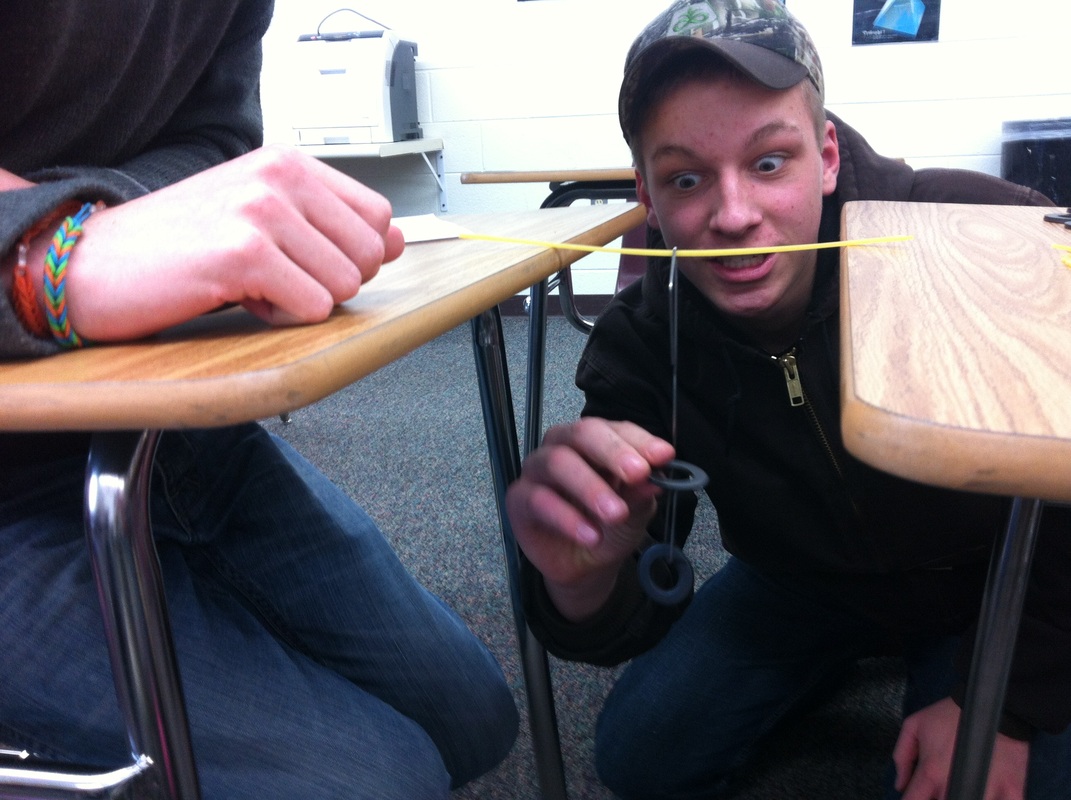
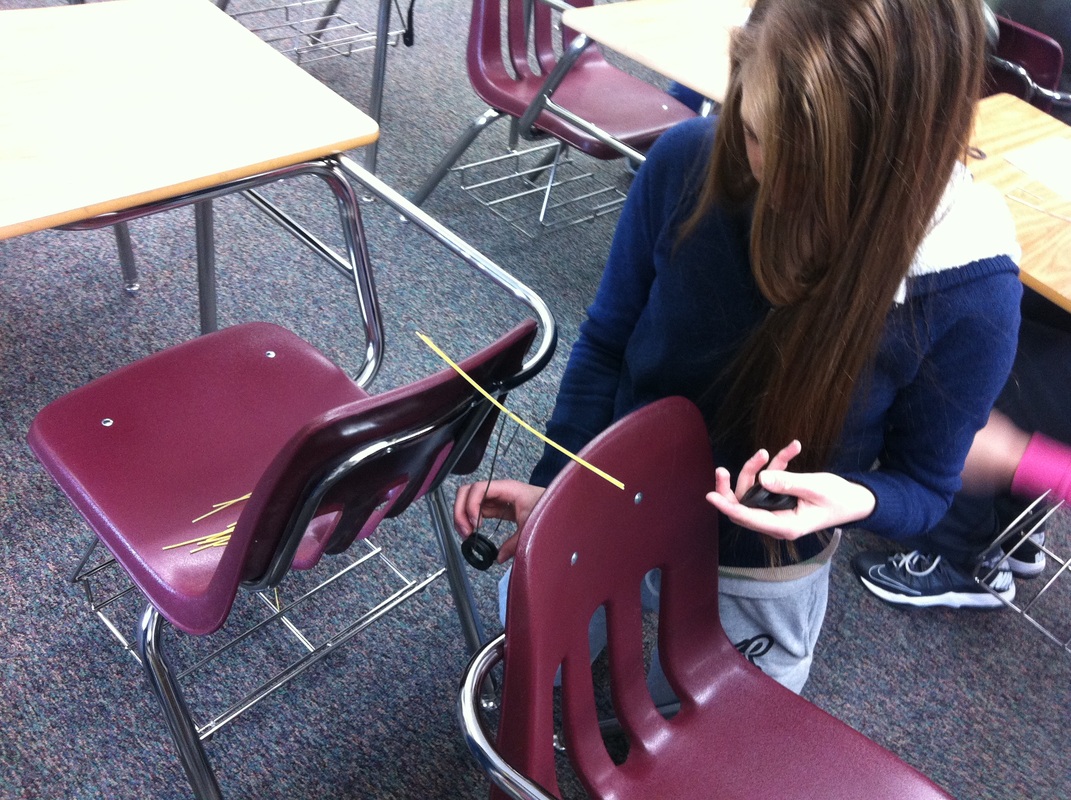
It turns out the relationship is really close to linear.
x| 1 | 2 | 3 | 4 | 5 |
y| 3 | 6 | 8 | 8 | 14 |
Some realized their problem right when looking at the data. Some needed to graph it first. It did this teacher's heart proud to hear students saying to each other: "I think we need to redo this one." or "This doesn't look right, it should keep going up but it doesn't. Let's try it again."
At this point in the year, we've gotten really good at interpreting and extending graphs. But I still have a couple of kids struggling with the jump in abstraction when I ask them to make an equation for our data. It's been almost 6 months and I still have kids wanting me to just tell them the answer. I keep reminding myself: ask a question back.
I don't show the kids regression until Algebra 2, so they generally attack it one of two ways:
1) They make a line of best fit, pick two points and create an equation (which is my objective for this lesson).
-or-
2) They find the average rate of change from the table and a) surmise that no weight will be required to break 0 pieces of spaghetti, putting the y-intercept at 0 or b) they go backwards in the table with their average rate of change and find y when x=0.
| 7.7_spaghetti_bridges.doc |


 RSS Feed


