Day 1:
I introduced the lesson using one of our school's stage lights. I had three students come up to the whiteboard--one to hold the light, one to measure the distance from the whiteboard and one to measure the diameter of the light on the whiteboard. We recorded three measurements at 10cm, 20cm, and 30cm. At the end of the experiment we are going to try and predict the width the light will make 1 meter (100cm) from the board.
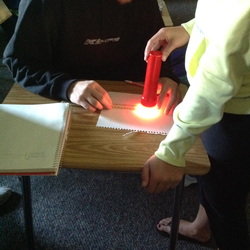
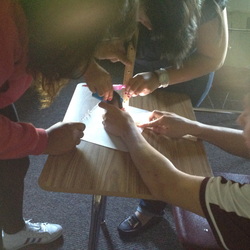
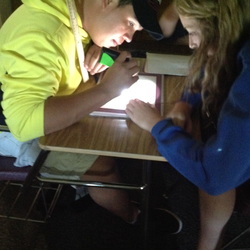
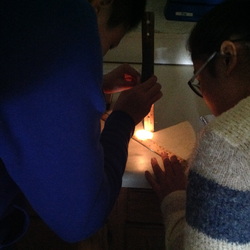
Here's some pictures from students working on figuring out the relationship between the distance of the light from a surface and the size of the diameter.
Some students had difficulty with the data they collected. When subtracting out the diameter of the flashlight lens (we're doing direct and inverse variation so we need to go through (0,0)) their data wasn't even close to linear. Bad news. For the most part we did pretty well figuring out whether it was y=kx^1 or y=kx^2 by looking at the table and the graph.
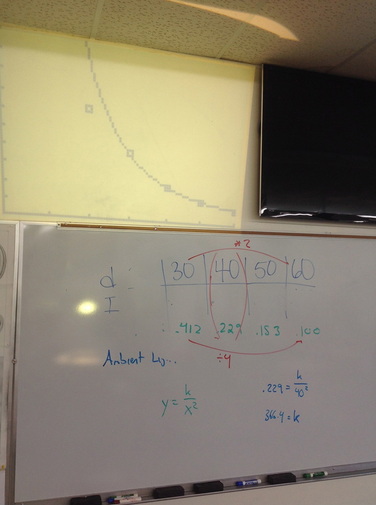
| We then looked at how the light intensity relates to the distance of the flashlight. Our first data point wasn't very good and led us on a bit of a wild goose chase. We decided try some different data points and it worked really well. (Notice we deleted the 20cm data point from our table on the right.) All in all it was a good first run on the lesson. Things I would change: Next time I would give the kids a little more structure--like a worksheet with written directions and some suggestions for measurements and how to make them. Although we ended up covering all of the math objectives I wanted to, this lesson took twice as long as I expected. Maybe I'm just too new at this to really get a sense for how fast kids can collect data. For some reason I had it in my head that we could do this whole thing in one day. Collect some data. Make some equations. Have a good discussion. Collect some more data. Make another equation. Have another good discussion. |
Oh. And why yes that is an overhead projector shining on my wall next to a flat screen TV. Don't judge me.
 RSS Feed


