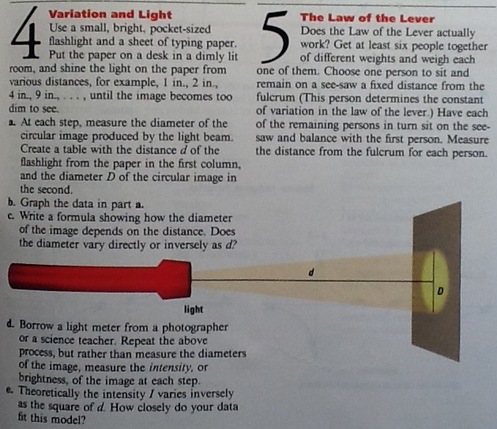
The way I've always taught this is to give students a situation and the information that goes along with it then ask them to explore the information and figure out how to model it. Here are some of the situations:
- The pressure of a gas and its relation to volume
- The intensity of a sound based on the distance from a set of speakers (like at a concert)
- The length of a wing (bird or insect) and the number of beats per second.
I found the following 2 options. Project #4 on the left and Activity 4 below. I think both are great ideas but leave something to be desired from an inquiry perspective. They do a little too much leading. I want the students to figure out on their own whether they want to use a table or a graph. I want them to think through the process of needing to find a variation constant. If the book tells them exactly what to do all the time, where is the problem-solving in that? If you look at Project #4 above, part e just gives away the extension. That's lame.
| | Here's the general idea of how I would go about incorporating this into my classroom. Need: small flashlights, measuring tape (cm), light meter (optional), CBR or iPad, ball to drop Split the class into 2 groups and have them complete the experiments:
Both groups present their data to the class and all groups decide how to model both situations. |
This could totally turn into an Act 3 lesson except that instead of showing a video, I would do a quick demonstration on the board by placing a student at set distances from the whiteboard and then draw circles around the illuminated portions of the board. At this point the students could guess at the relationship, figure out what information they need, and then hop to doing an experiment of their own to figure it out.
Use a small flashlight and a sheet of paper or poster board. Use a measuring tape or a ruler to shine the light from various heights on the paper. Measure the diameter of the circle created by the flashlight. Create a math model describing the relationship between the height of the flashlight and the diameter of the circle.
Make a prediction about how large the circle should be from a different height. Test your prediction.
(If there is time at the end and I can find a light meter, checking the relationship between the distance of the flashlight and the intensity of the light would be brilliant)
Directions - Ball Drop
Either use a CBR to measure or use an iPad to video a ball drop.
CBR: Place the CBR above the ball to get data relating the distance the ball drops in relation to time. Transfer the information from your calculators to something the whole class can see.
iPad: Video a ball being dropped next to a tape measure taped to the wall. Start the zero at the height the ball is dropping. Using the stop and forward options on the video bar, measure the distance the ball dropped over time. Transfer the information to something the whole class can see.
Both: Create a math model based on the data and make a prediction about how long it should take to drop from a different height. Test your prediction. Be ready to share how you arrived at your conclusions.
 RSS Feed


