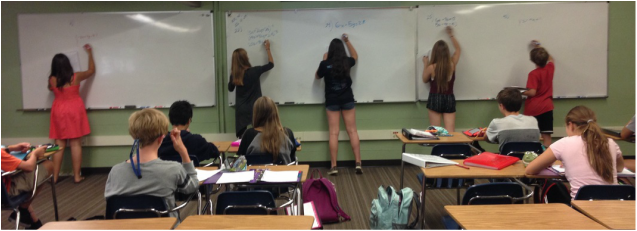
Students demonstrating how to correctly solve homework problems other students asked questions on. Brilliant.
| Musings about math education. |
|
|
Students demonstrating how to correctly solve homework problems other students asked questions on. Brilliant.
0 Comments
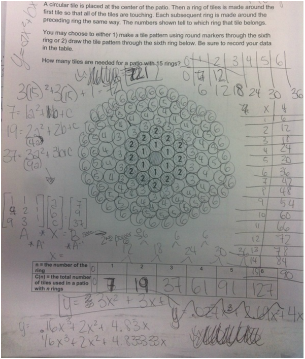
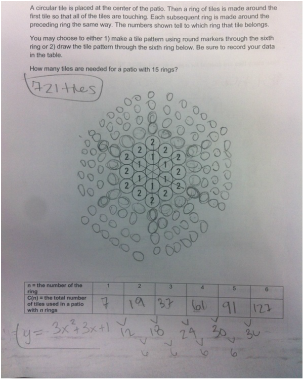
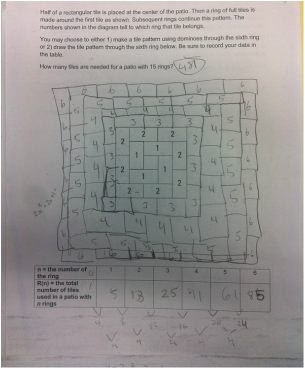
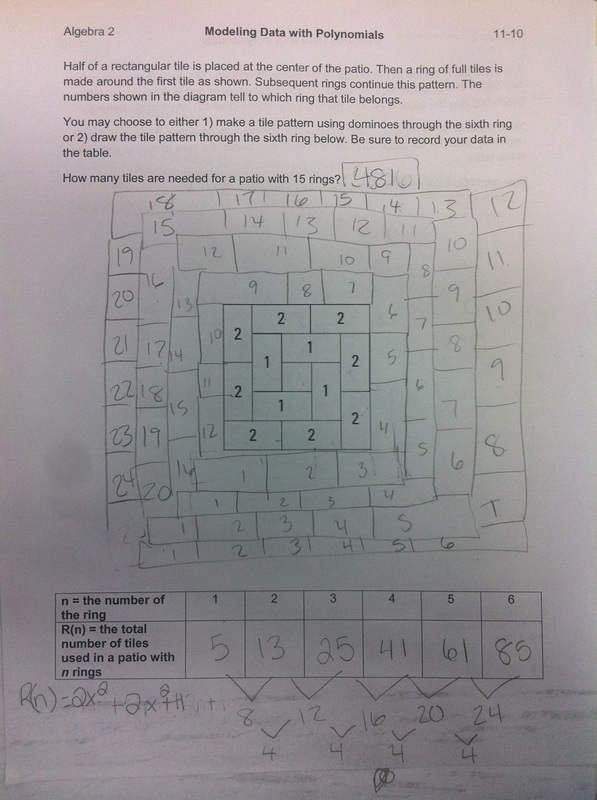
As an intro to polynomial equations in Algebra 2, I decided to skip the "real world" problems--which always seems to be terrible for this topic; either too simplified to be of any value or too complex to understand in Algebra 2--and just go modeling. Granted, it's using quadratics, but at least it's a start. The goal was for students to make a table of data and look at differences to tell the degree of the polynomial function. From there, students had to create a system of equations and solve--preferably using matrices. Here's some student work. The file is at the end of the post.
I got this from modifying a UCSMP activity in an attempt to remove some supports. Trying to be less helpful and all that. The original activity told students directly how to solve the problem. I want to give less away when I ask students to model situations. What's the point in having them compare and contrast families of functions if I never have them make decisions on the tasks I assign? If you have any nice modeling tasks that go beyond 2nd degree, I'd love for you to share them with me in the comments.
This is a sweet little one day task I use for helping students get their minds around rational functions (from EMATHS). The concept is simple enough--find the total miles per gallon for the Chevy Volt. 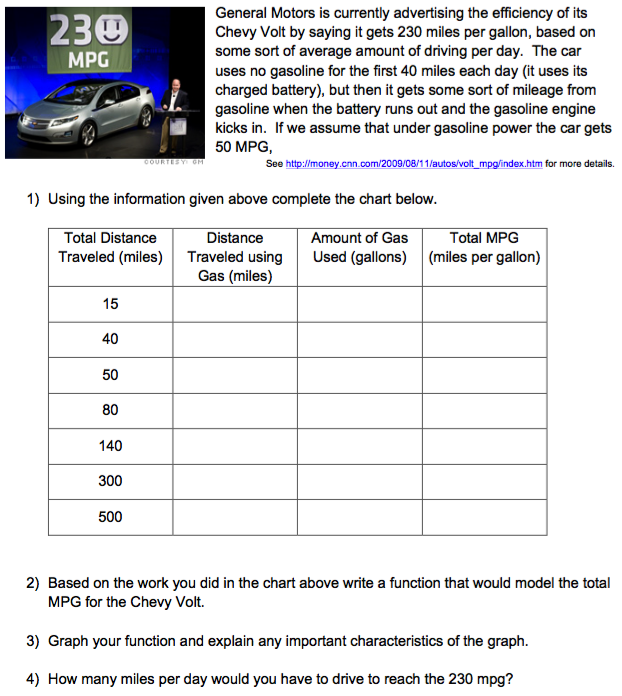 Students use the table at the top to help make connections between the miles traveled and the amount of gas used. Most students are able to come up with a function modeling the situation without much scaffolding from me. I've used it with both Algebra 2 and advanced Algebra 1 students. Both groups did great.
I'm reworking some of my previous lessons. You know the ones... the ones where you fall on your face and flail like a turtle on its back. This is one of those lessons. The basic concept is simple: have students solve systems of equations and decide which light bulb is better in the long run. Needless to say, it didn't turn out to be simple for the students. Last year was my first year using the idea and we tried making it a take-home project. There wasn't a way for stuck student to become unstuck. If at all possible, I'd still like this to be a take-home assignment. I want students to be able to take a real-life non-contrived problem and be able to make some headway on it. The real difficulty probably comes with comparing the incandescent light bulbs to the CFL and the LED light bulbs. Students have a hard time making the equations. Finding a yearly rate of change is hard with the incandescent bulbs because you have to purchase more than bulb in a year if you buy the cheap ones. That makes coming up with a slope and y-intercept harder for an Algebra 1 student. So... dear internet, I'd love a little help finding some way to provide a bit of structure to help students along in the process. I don't know, maybe I'm just too attached to the problem. I want them to work for it... but I want it to be within reach.
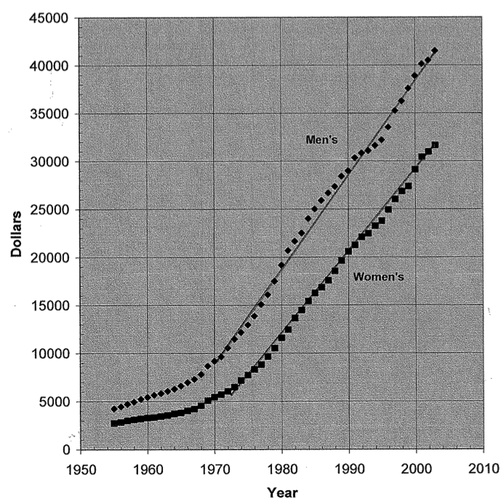
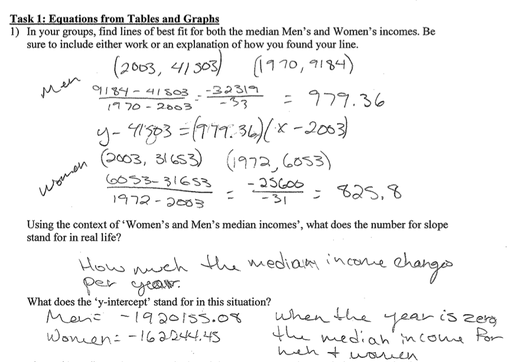
Okay, here's an example where "real life" math needs a little help. I was thinking about a problem I assigned last year during track season. I really really like the problem (adapted from emaths). The task: Fielding Nair International (FNI), the company renovating our school, is also contracted to build new tracks at several of the Boulder Valley area schools. BVSD wants FNI to plan and construct new tracks that meets the criteria of the NCAA. The track will consist of two straight sections and two semicircle curves. Although FNI’s blueprints contain the dimensions of the track, they are still in need of assistance on some crucial aspects of the track design. 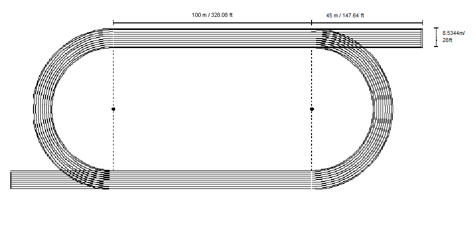 I've got a bigger picture of the track at the end of this post.
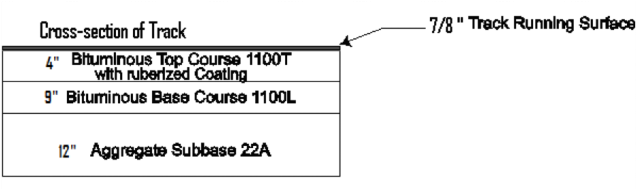 I don't know if you can see the numbers in the picture very well--they're not regulation track size. The straightaways are 100 meters each and the straight extensions past the curve are 45m. Definitely not regulation. The whole time, I'm not kidding here--the ENTIRE time we do this problem students ask me whether these are the real track dimensions. I don't know what to say. Do I just lie to them? Do I tell them we're doing a problem similar to the one the builders will do just with easier numbers? Here's the real difficulty for me. Kids struggled with this. They persevered. They figured out how to use trig and sections of circles in order to not have any overlap when figuring out the track surface area. I. Love. It. After finishing, the students were happy the numbers were easier. But during the process, they wanted the work to mean something. Would the problem work better if I went completely "real world" or do I leave it in its current "sudo real world" state? 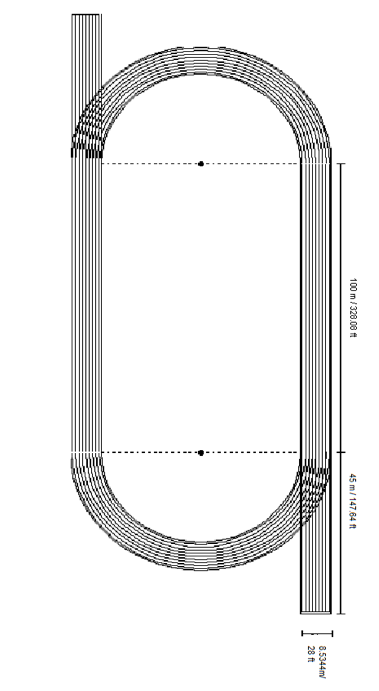
It's not very often something I teach turns out better than expected--but this is it! This year, for the 1st time ever, I successfully taught transformations to Algebra 1 students. Yes, that's right--Algebra 1. I bit the bullet and spent more time than normal designing a unit which forces me to take my classes to the computer lab. I hate the computer lab--mostly because of the sheer amount of time lost to travel and transitions. Maybe someday my students will have computers with them at all times, or I won't be out in the portable trailer park where it takes me just short of forever to go get a chromebook cart. 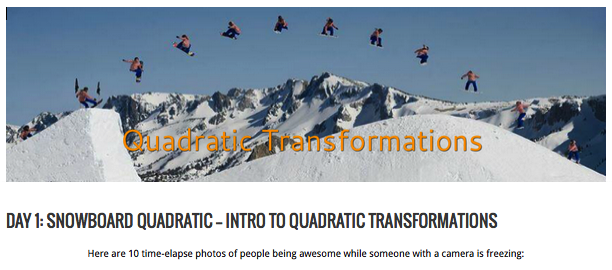 I designed the task for a two-day intensive. On day 1, students use Desmos to match graphs to the paths of skiers and snowboarders. 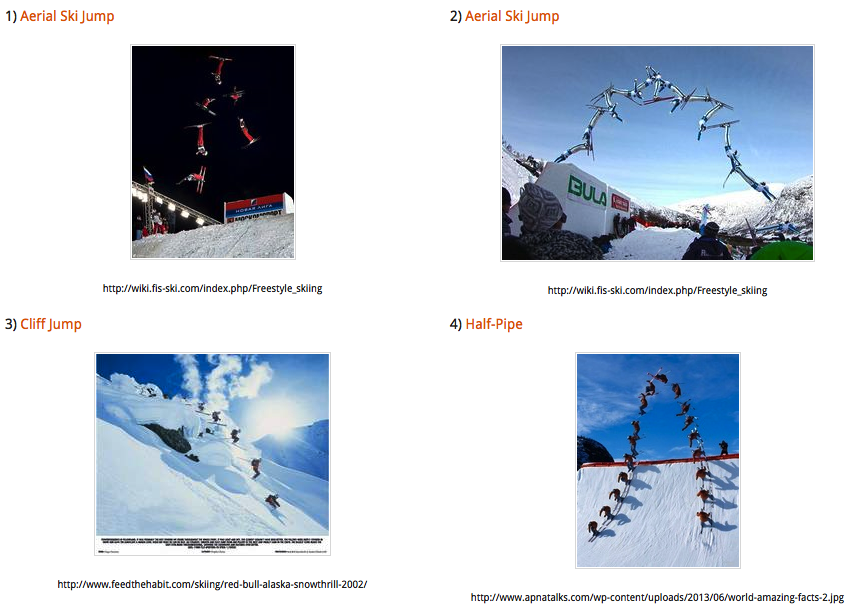 By the end of the period, students mostly understand the vertex form of a quadratic equation: y=a(x-h)^2+k. They are able to describe what the a-value does and how to find 'h' and 'k' without sliders. I made a handout for the students to use during the class period that also includes some practice problems.
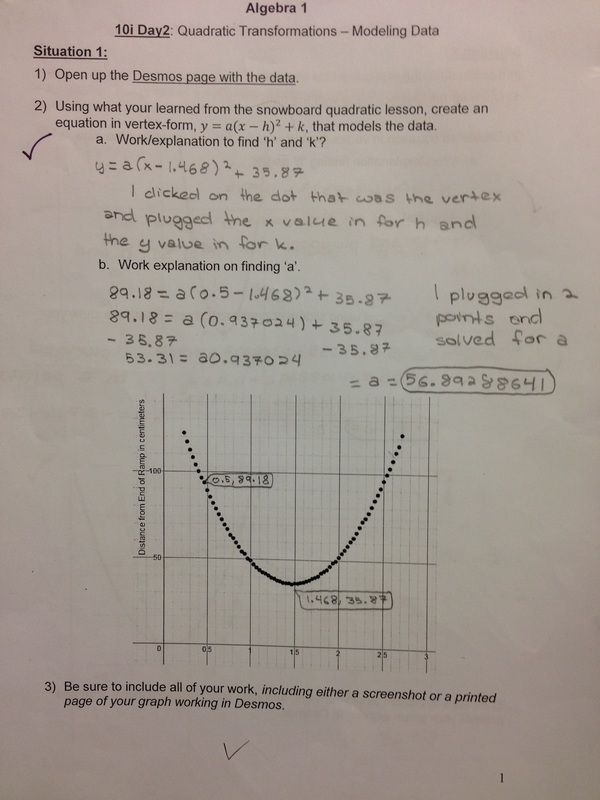
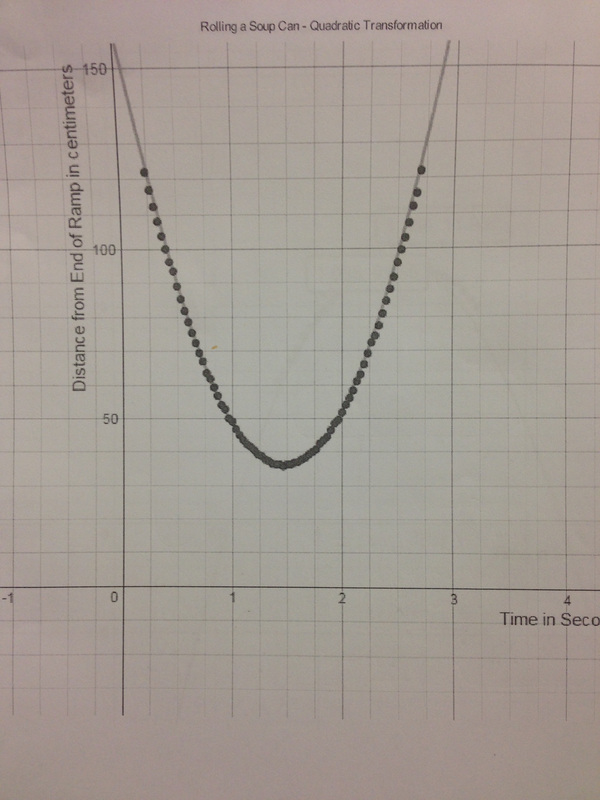
Day 2 is about modeling a situation using the vertex form of the quadratic without using sliders. This means students look at real data, estimate the vertex, then calculate the a-value. They do this in two different situations. Situation 1: Rather than using another projectile example, I used the simple situation of rolling a can up and down a ramp. Below left is a student response on how they fit an equation to the data. Below right is an example of how well the curve fits the data.
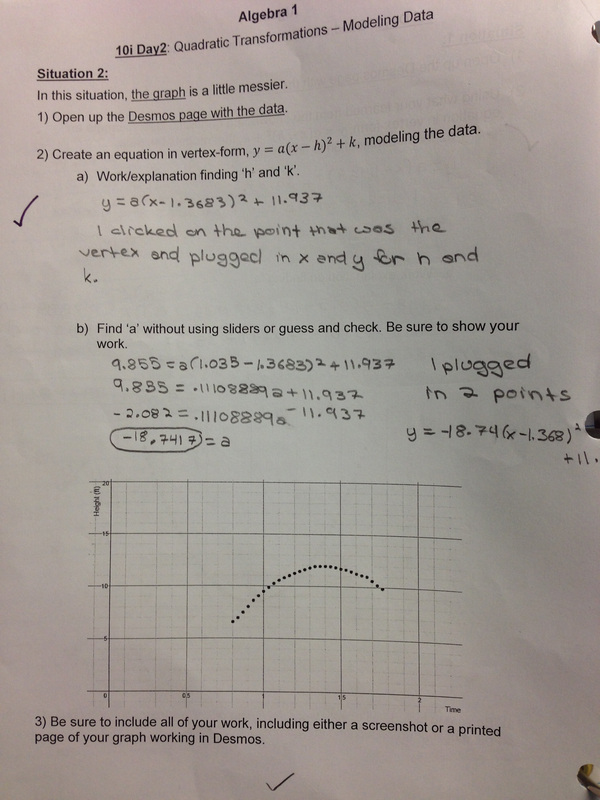
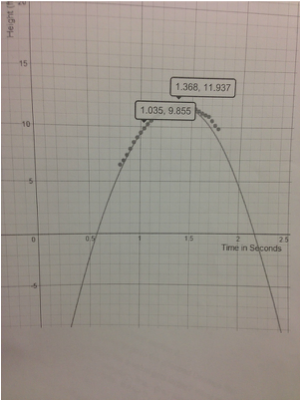
Situation 2: I use a basketball example here for two reasons: 1) the students dig it, and 2) I didn't do the greatest job tracking the data. Messy data forces student discussions about why the graph of their equation only works for the middle part of the graph but not the edges.
Here's an example of some student work on the practice problems. 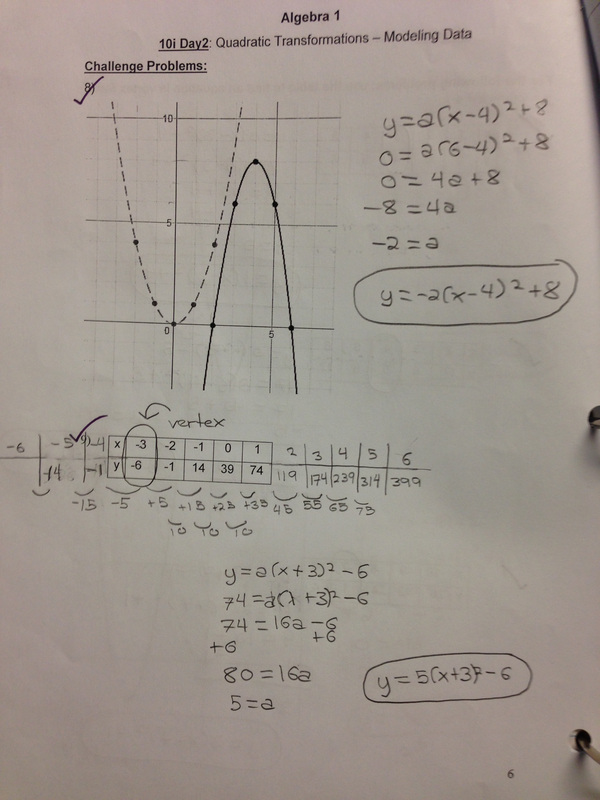 A huge thanks to John Stevens and Matt Vaudrey for responding to my cry for help on Twitter with insightful comments. Once again the #MTBoS math community demonstrates the benefits of online collaboration.
If you decide to give it a whirl I would love to know how it goes. If you change it up, I'd love to know how so I can tweak it with my students as well. Today we did some applications of exponential functions in Algebra 1. Particularly, I want these kids to find math interesting and enjoyable. I had an old activity involving checkers from a CPMP textbook that was the seed for this idea. We began by discussing the oil spills of the Exxon Valdez (1989) and the BP Deep Water Horizon (2010). I try to be as intense and dramatic as possible. These are environmental catastrophes; I want students to feel the weight of the situation. The BP Deep Water Horizon was the US’s largest oil spill ever. After the Deep Water drilling rig exploded--killing 11 people--the oil well continued to release oil into the ocean for another 87 days. All in all, 206 million gallons of crude oil were put into the ocean in the Summer and Fall of 2010. However, the worst oil US spill in terms of environmental damage happened 25 years ago in 1989 when the oil tanker Exxon Valdez ran aground in waters of the Prince William Sound near the Kenai Peninsula of Alaska. An estimated 11 million gallons of oil spread on the waters and shoreline of the area, endangering wildlife. How do you begin to clean up such a mess? [students respond in all sorts of manners] How long do you thing it takes? [students again respond with very uninformed opinions]. Enter the checkers activity. I start with 80 red checkers in a tote bag and 20 black checkers representing an oil spill. I also have about 5 or 6 small bins with 20 red checkers in each for use in the activity. Experiment (from Core-Plus Mathematics Project)
I ask a student to record the number of black checkers left on the whiteboard. As I go around, students take turns taking out 20 checkers. We then figure out the number of black checkers left. I let the student on the whiteboard make up his/her own organizational structure. It ends up being a decent discussion point for the class about what they like or what they would like to see in order to help understand the data better. Sometimes the data works out really well (like in 1st period today). Sometimes it doesn't (as in 7th period today). Either way, it helps students begin to get their heads around the idea that oil is harder to clean up as the days progress. The easy oil gets cleaned up early on. The harder oil stays around for quite awhile. The graphs below show two possible outcomes of the pollution and cleanup simulation. I ask students about which option they think best represents the situation. 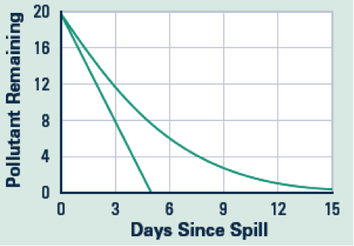 After a brief discussion, in which every class brought up that the probability of getting a black checker goes down every time, we try to create a mathematical model for our little experiment. Here's what 1st period's table looked like: x | 0 | 1 | 2 | 3 | 4 | 5 | 6 | y | 20 | 16 | 13 | 11 | 7 | 6 | 6 | We talk about what kind of patterns we see in the table. Every class I've ever had goes for rate of change. So we look at the differences. I'm not about to intercede at this point. After some more discussion the class comes to a consensus about the starting-value for the exponential function: a = 20. (We use the general form: y=a(b)^x). Then I have students work in pairs to try to find the b-value. Of the 12 different groups in two different classes today, I only had 2 groups not treat the multiplier, b, like the slope. Groups had all sorts of values. They took the average difference and plugged it in for b. They took the average difference, turned it into a percent and subtracted that from 1. I could go on, but you get the idea. Me: "What does the b-value stand for in the equation?" Kids: "The multiplier." Me: "Is that what you found?" Kids: "Yes. No. We found the difference." Me: "Is that the multiplier?" Kids: "No." Me: "How would you find the next y-value in the table from where we are at now?" Kids: "You would divide 16 by 20." Kid2: "Wait! That means we can find all the b-values and then average them." Kids: *murmers of agreement* Me: "You have another 3 minutes to fix your equations with your groups. Go!" The class comes back together and we discuss the results. Then I bring up the next slide in the presentation. This is the 25th anniversary of the ecological disaster caused by the Exxon Valdez. Unfortunately, we don't have data for this situation like we did for our experiment with the checkers. Figuring out how much oil is left involves paying people to take samples and do studies--lots of money. Now, 25 years after the fact, some people have gone back to check on the area (I have the study linked in the ppt). On the surface, things seem to be recovering well. However, when they began to look under the surface, literally, things weren't so pretty. Of the holes they dug, something like 58% of them showed visible signs of oil. It's been 25 years and things still aren't okay. They now estimate that there is still somewhere between 16 and 21 thousand gallons of oil still in the local environment. How might we go about fitting a model to this data? In y=a(b)^x, the 'a' value is given with the 11 million gallons of oil originally spilled. We now have another point (25, ___). Every class picked a different number to use for the associated y-value. Some wanted to take the average of 16,000 and 21,000. Others wanted to use 20,000 because it was an easy number to work with. We plug in our a-value along with our point (25, 20000) and we end up with 20000 = 11000000(b)^25. Now we graph both sides of the equation to find our b-value. The conversation then shifts back to the gulf coast. Just last month, BP was found as grossly negligent prior to the oil spill. The company faces fines up to 18 billion dollars. How do you think the Federal Judge in the case came up with the number 18 billion? How long do you think it will take to clean up? After the lesson, several students went home and did their own voluntary research into the situation. I don't think I've ever had that happen before. We ran out of time to talk about the ongoing disaster at the Fukushima Nuclear Power Plant. My problem ideas for that are in the attached lesson. The ppt presentation goes over the BP Deep Water Horizon and the Exxon Valdez oil spills. My current textbook has zero applications of exponents outside of scientific notation. It doesn't even cover the concept of exponential functions. Since I'm still a strong believer in homework, I had to make my own worksheets. This is one of the skill and application worksheets I used this chapter. It took me less than 10 minutes to make the key. Hopefully, it's about the right length for students (I expect somewhere around 30 minutes per night).
CCSS
• HSF-LE.A.1 Distinguish between situations that can be modeled with linear functions and with exponential functions. • HSF-LE.A.2 Construct linear and exponential functions, including arithmetic and geometric sequences, given a graph, a description of a relationship, or two input-output pairs • HSF-LE.B.5 Interpret the parameters in a linear or exponential function in terms of a context. • HSA-SSE.A.1 Interpret expressions that represent a quantity in terms of its context.★ • HSF-BF.A.1 Write a function that describes a relationship between two quantities.★ • HSF-BF.A.2 Write arithmetic and geometric sequences both recursively and with an explicit formula, use them to model situations, and translate between the two forms.★ I moved to Colorado this Summer and started a teaching math at a public school (it's been 6 years since I taught in the public schools). One of the new requirements for me was putting all of my assignments online. Because of the Christian resources on this site, I started a new webpage for use at my new school: andrewbusch-bvsd.weebly.com.
Things have been crazy busy--moving, starting a new job, 3 small kids under 5. That means I've been neglecting my blog and not consistently updating my resources on this site for the past several months. I plan to do such things... just when I can catch my breath. However, my work website gets updated regularly... because I'm paid to do it. Funny how things work like that. Anyway, we've only been in school for a couple of months, but the website is fleshing out So, if you're interested in what we're doing for Algebra 1 homework, feel free to take a look around. In previous schools most of my homework was from the book. Here, it depends on the chapter; my books are so old I regularly beg/borrow/steal stuff from other people and sometimes even create my own assignments. Like when covering exponents, the only application problems the book came up with were ones dealing with scientific notation. Really? Next week we're talking about cleaning up oil spills and modeling the process using exponential decay functions. Then we're going to talk about the Fukushima nuclear catastrophe that continues to unfold in Japan and the half-lives of Caesium-137 and Strontium-90. Next up, the population implosion in the city of Detroit from 1970 to 2010. All this book can hack up is scientific notation? No wonder we have a generation of adults that hate math and can't think of how basic algebra relates to "real life". I will now step away from the soap box. Hey, if you're interested, I'm also teaching an intro to programming class using the language Python. If your looking for ideas on how to structure an introduction to Python class in middle school, this my 1st attempt. It's not perfect but it's a start. This year I find myself teaching a class called Algebra 1B. It's basically the second half of Algebra 1--except that I have almost the whole year to teach it. So pretty much, almost every activity I've ever collected I get to do with these kiddos. Here's our last two weeks together. 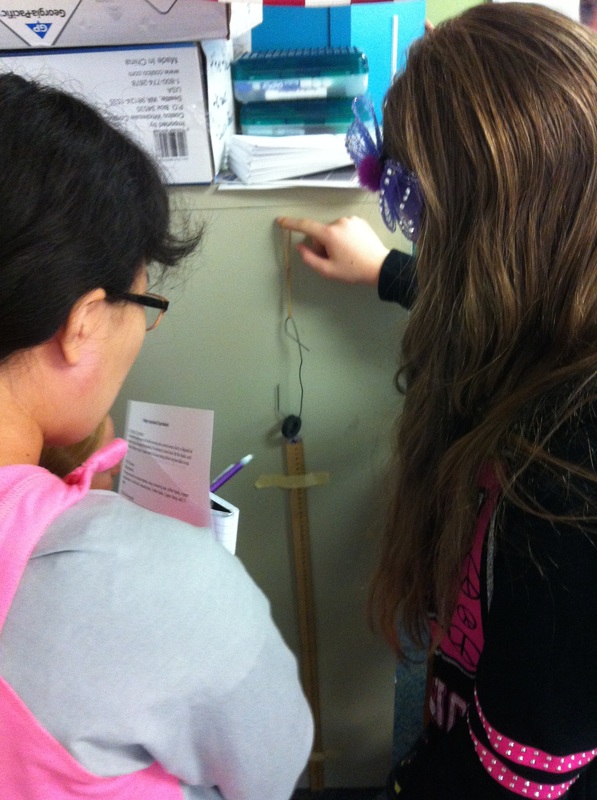
Next week: Barbie Bungee Jump
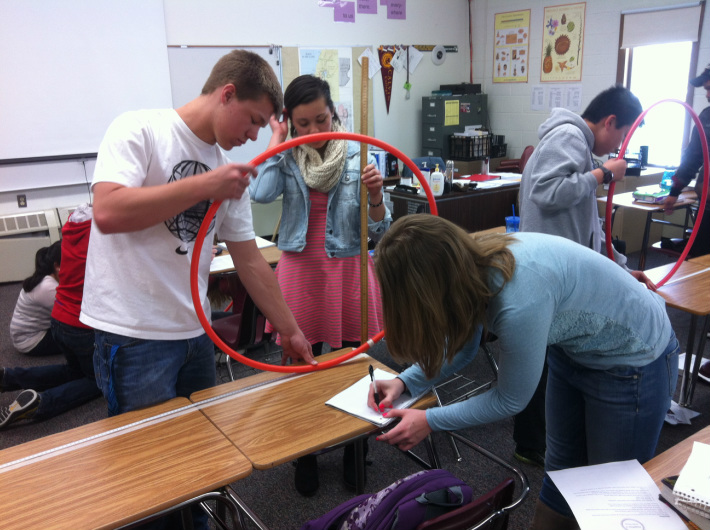
Right off the bat, let me say that I like trig. Or at least I like all the triangles and the easy applications for finding all sorts of lengths. Students in my classes generally like that too. What they find difficult, however, is translation of trigonometric functions. I mean, who looks at y = a*sin([p/(2pi][x-h])+k and says "ooooh I want to do that"? My students initially look at that and panic. You think I'm kidding. This year I hope to change that--I'm stressing transformations for every family of functions we look at rather than limiting it to the chapter dealing with transformations of functions. Those of you with access to Desmos think that's easy. Without student devices I can tell you it's not. I'm also introducing trigonometry by embedding it in the unit circle. If all of the triangles we look at are always brought back to the circle, then all of a sudden the Law of Cosines isn't such a big deal. Shifting functions up, down, left, and right is less scary (I hope). Anyway, that's all to say we starting looking at trigonometry today by playing with hula hoops. We started the class talking about what students remembered about trigonometry--just to get the proverbial wheels turning. They started off slow but then started picking up steam. Then I threw a stick into the spokes: we're going to start talking about trigonometry by looking at circles. We watched the following video: Me: If you were the person recording this video, what would the graph of your experience look like? Guess. Try to sketch it. Student1: How do we graph that? Student2: What are the variables? Me: So you have to identify your independent and dependent variables? (I probably gave too much away there). Student3: Time! Student4: Height? Student2: Are we assuming constant speed? Me: Sure, I think we can make that assumption. Students gave a lot of triangle-looking mountains as graphs. Brilliant. Me: We're going to refine our ideas by making our own Ferris Wheel out of a hula hoop. *cue student rejoicing*
We ran out of time to formalize what I wanted to talk about with them. Finishing the questions on the lab/worksheet was homework. The next day we started class by having students show their graphs. Some student had graphs looking kind of like a bell curve and others had graphs looking like a sine curve. They quickly came to the conclusion that this difference was due to where people started measuring from--either halfway up or from the bottom. Me: So if trigonometry is about triangles, where are the triangles in our circle? Enter Geogebra and interactive websites: 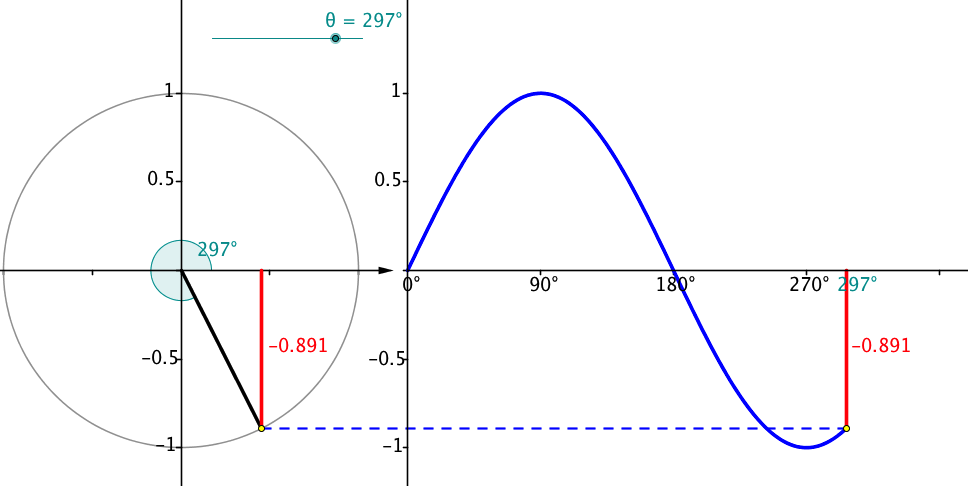
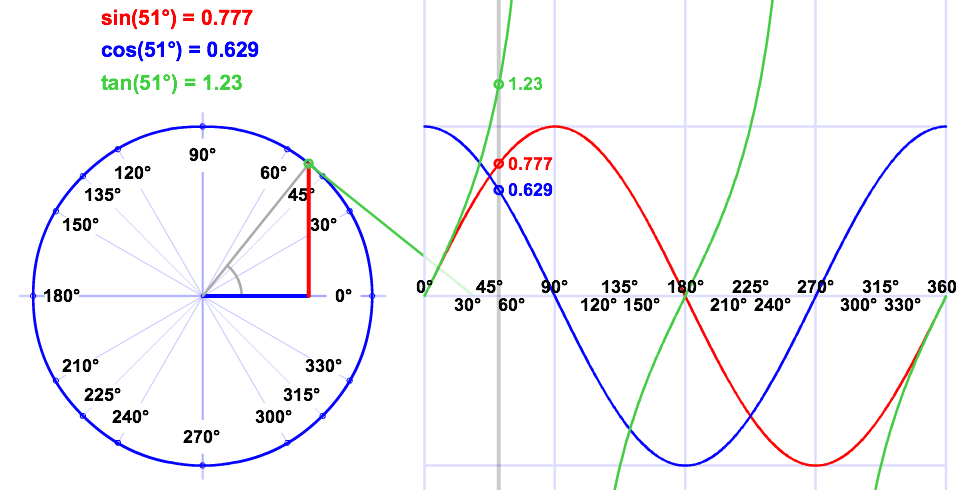
These led to some great conversations about the geometric nature of sine, cosine, and tangent (not to mention cosecant, secant, and cotangent). Sine is the vertical distance of a point on the circle above the x-axis. Cosine is the horizontal distance of a point on the circle from the y-axis. Tangent is the length of the tangent through the point on the circle to the x-axis. Then we talk about ratios, SohCahToa, and solving triangles using neat stuff like: 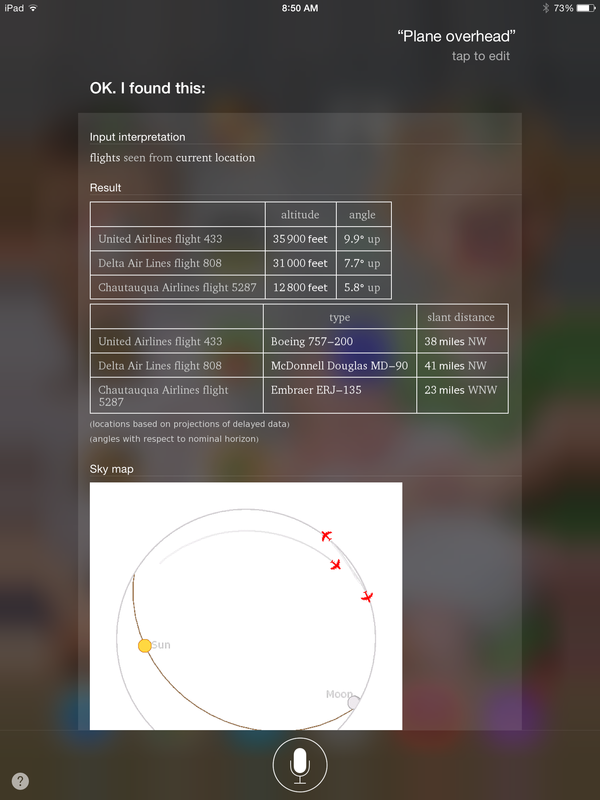
Introducing trig this way adds extra day to the crazy end of the year I-can't-believe-we-had-more-than-10-snow-days blitz to try to cover all the standards. What I hope is that it deepens student understanding and cuts down on the number of days we need to review these concepts.
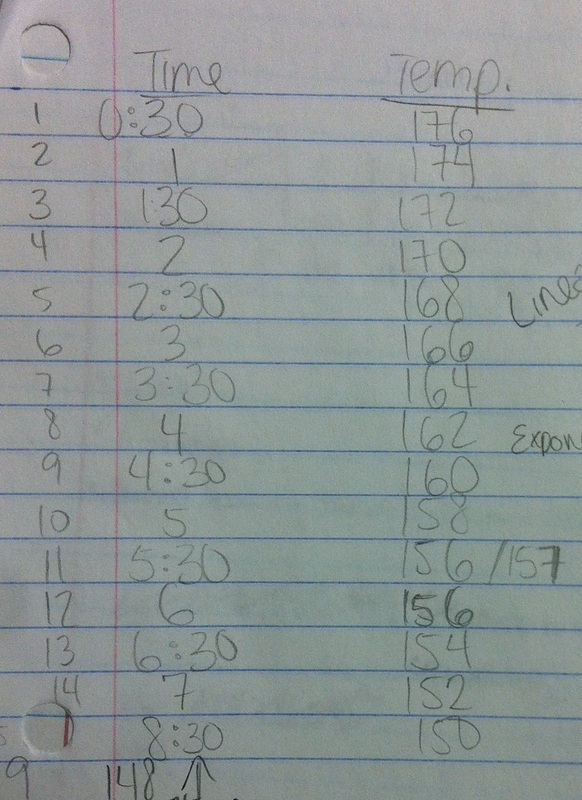
We explored exponential functions in Algebra 2 recently. I had planned on using the NCTM Illuminations lesson: Too Hot to Handle Too Cold to Enjoy since this past summer. However, as I've become more comfortable doing experiments in my classroom and gotten better at creating my own investigations I decided to steal the idea and make it my own.
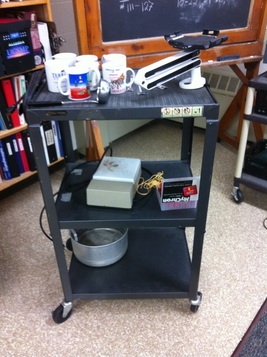
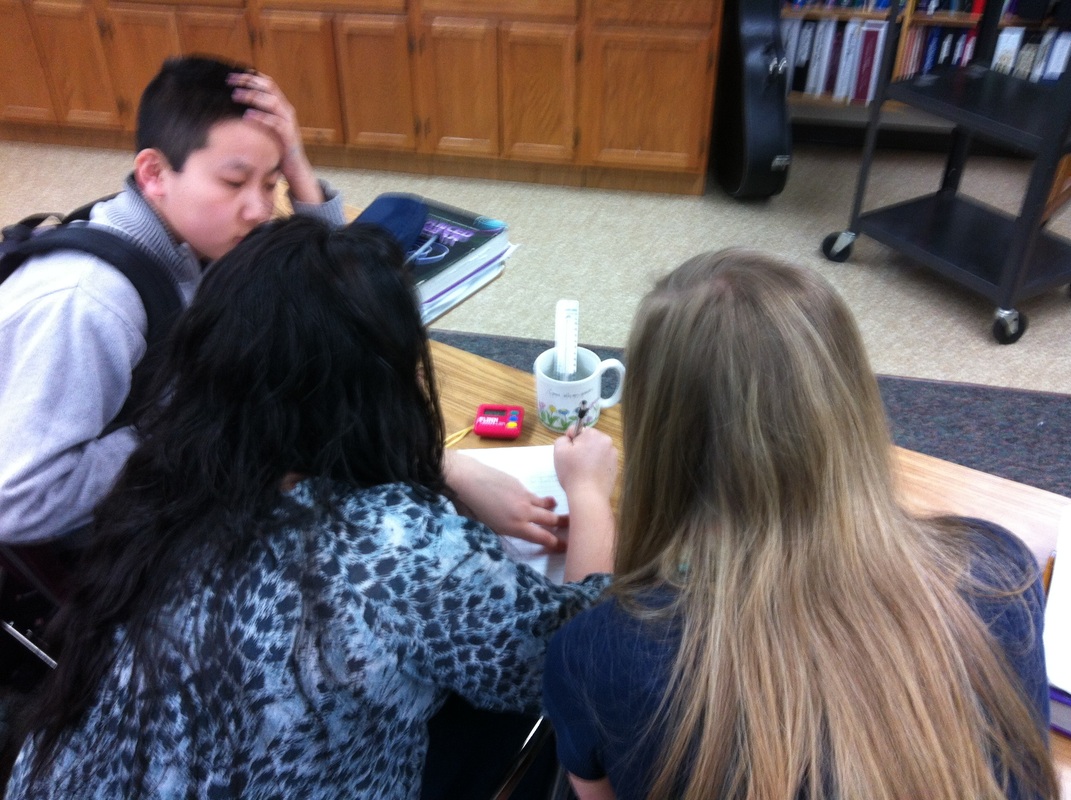
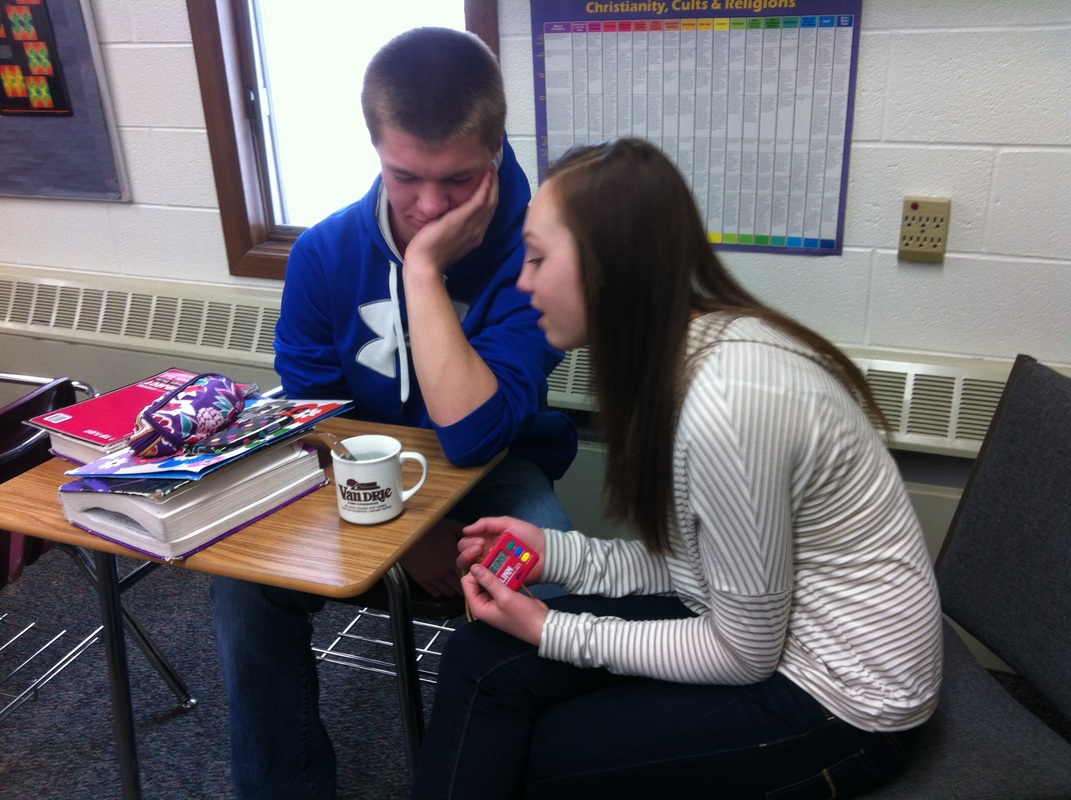
I introduced the experiment talking about the McDonald's lawsuit back in the 1990's over a elderly lady getting burned by a cup of coffee. We told some stories and ended up discussing that once coffee is 120 degrees, it's cold enough to not scald you and hot enough to still enjoy. I ladled out water to the groups and they set to work collecting temperature data based on the amount of time that had passed since they first started measuring.
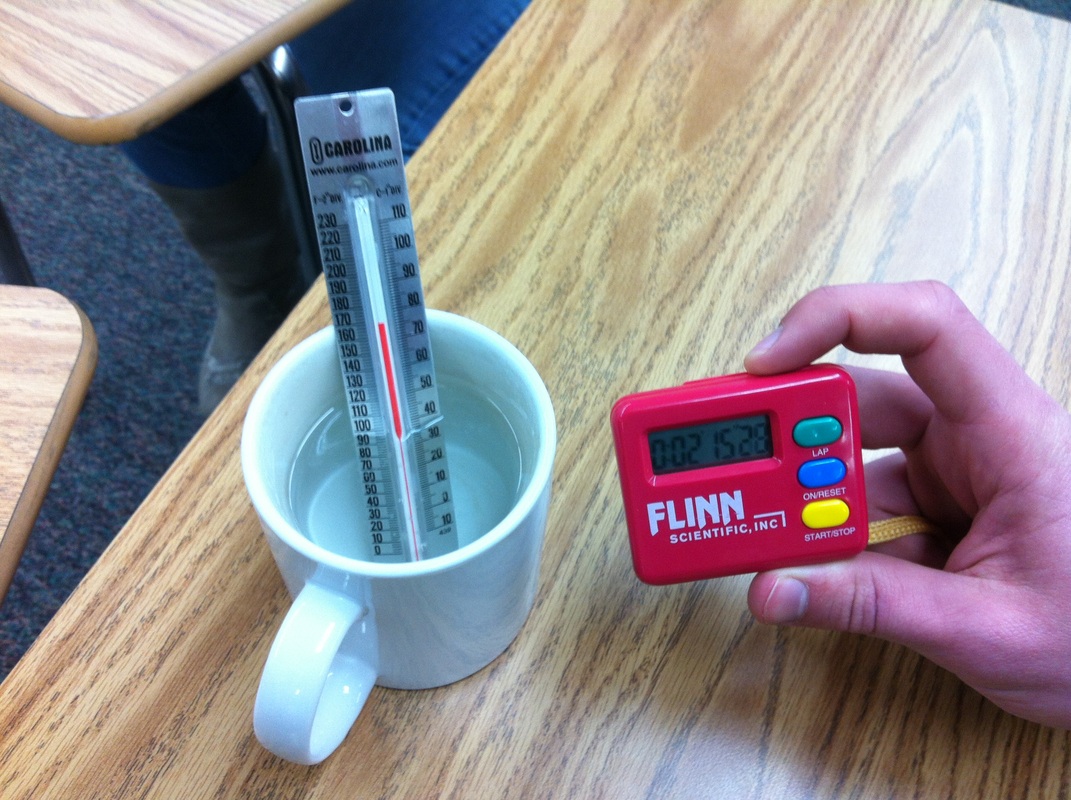
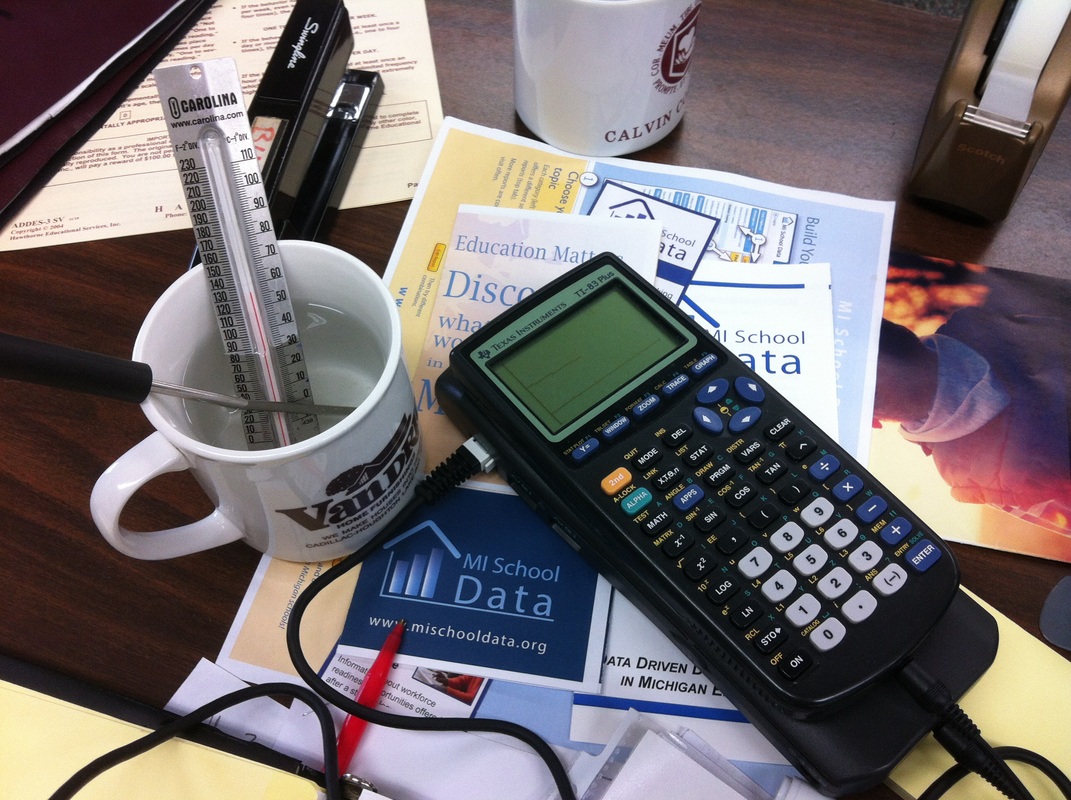
Things didn't go well--or at least as well as I had hoped. In the picture below, you can see the tools the students were working with. The thermometer was hard for them to read accurately. As a result, several groups got data that was pretty much linear.
Once the students started in on the process of modeling the data, I had to make a quick decision. I hadn't planned on the data showing up linear and students were asking me what kind of model I wanted. I chose to have them make the model they though best fit their data. Here's some samples of student work. 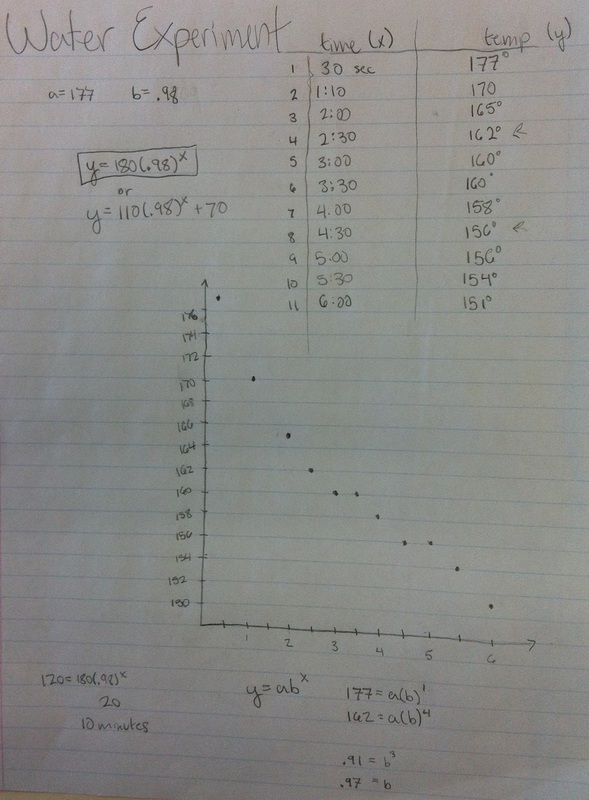
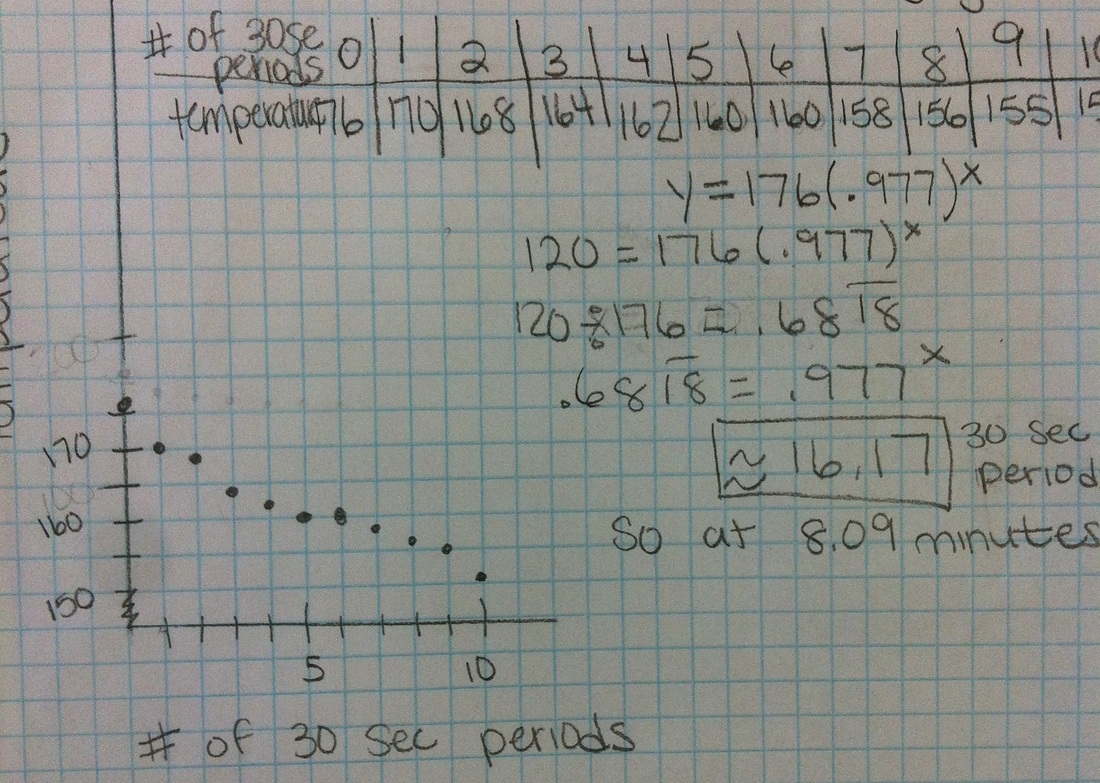
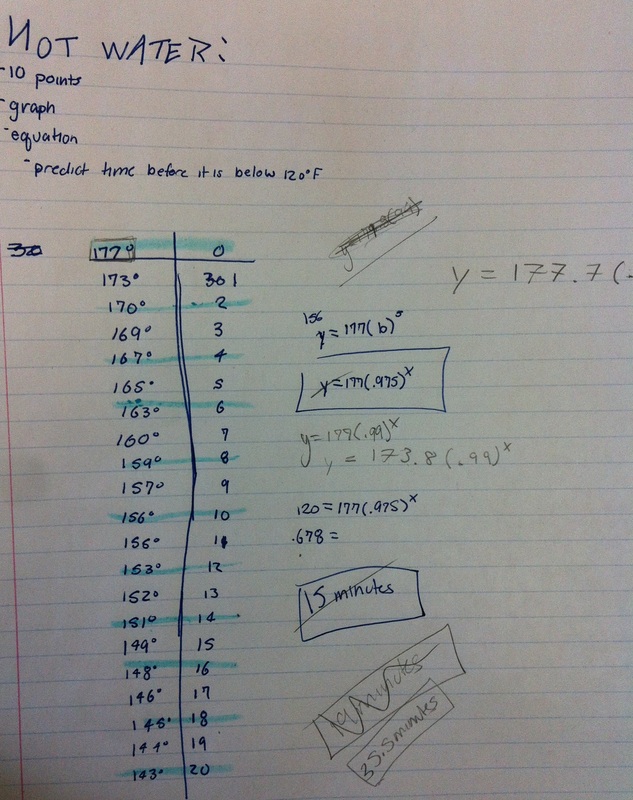
Here we had a great discussion about how well the model fits the data AND the situation. All but one of my groups went for an exponential decay model. However, all but one of those groups got the model wrong. They did well enough finding growth factors and starting values but they didn't take into account the horizontal asymptote for an exponential decay function; it's always at y=0. This means for all of the above functions, when we made a scatterplot on our calculators and graphed our equation at the same time, the equation went down much faster than the data--even when using exponential regression. Then the group below presented. They realized the horizontal asymptote needed to be at room temperature so they looked at the thermostat in my room. Then they proceeded to subtract 70 degrees from each of their data points before creating an equation. After finding an equation, they translated the equation back up by 70 degrees. Brilliant! 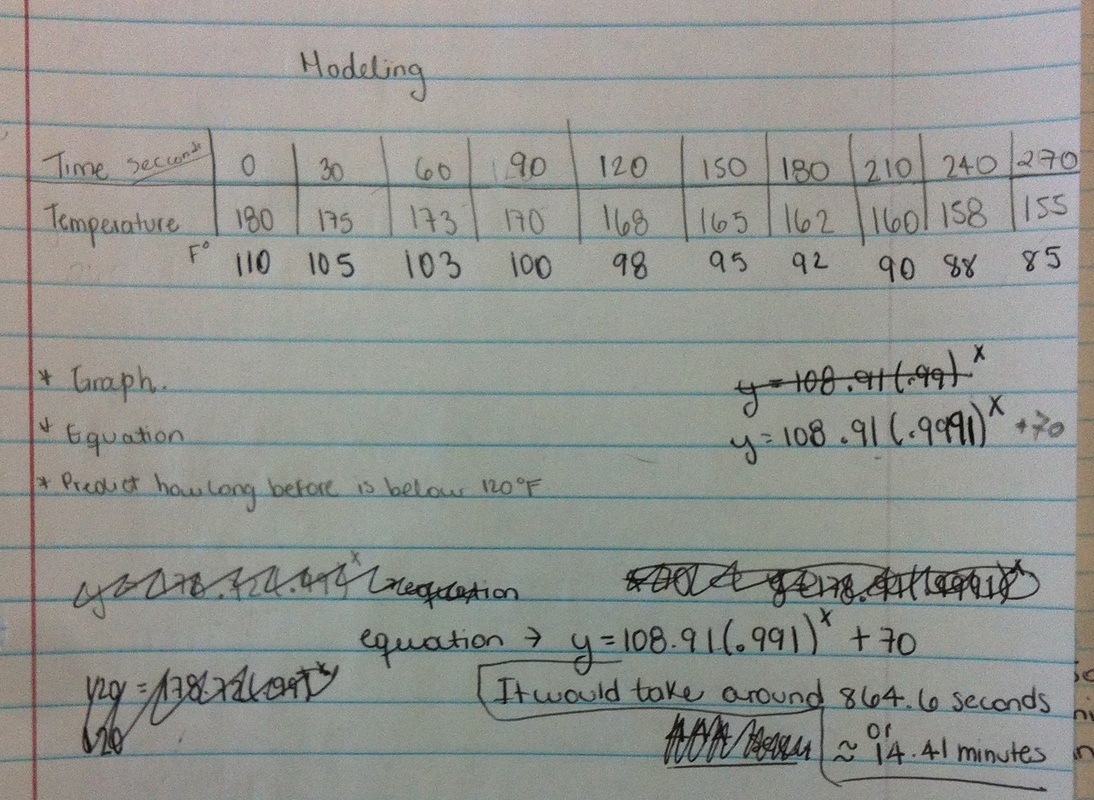
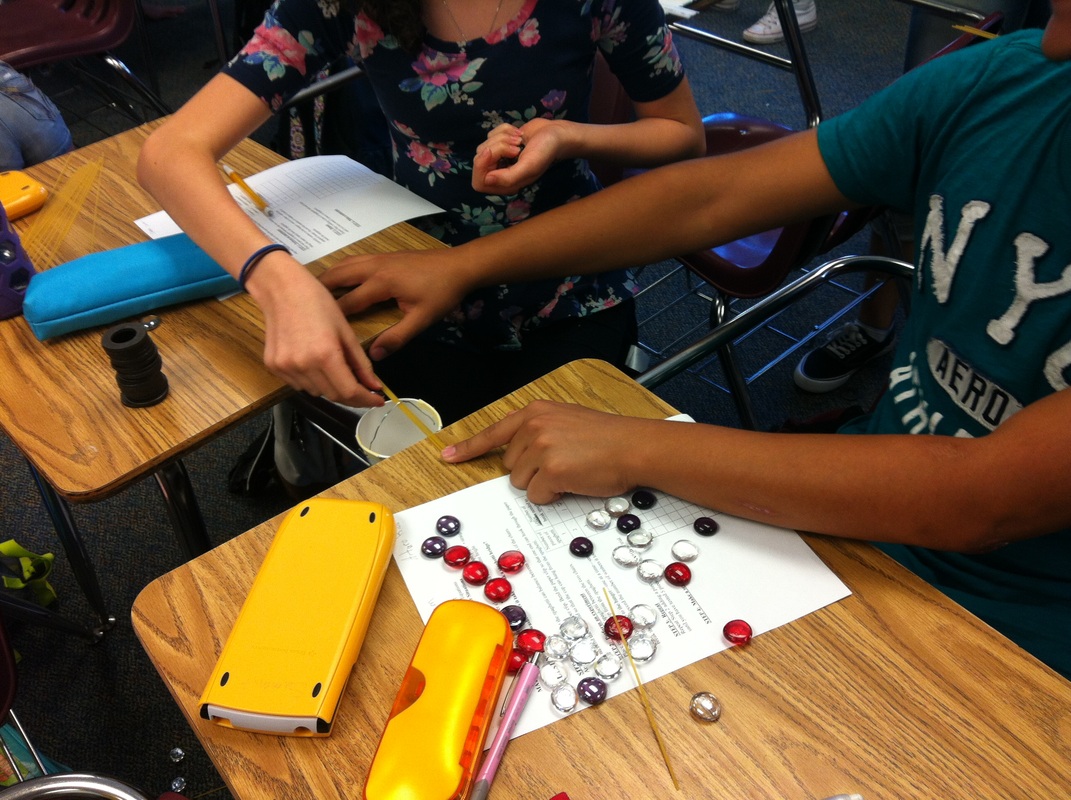
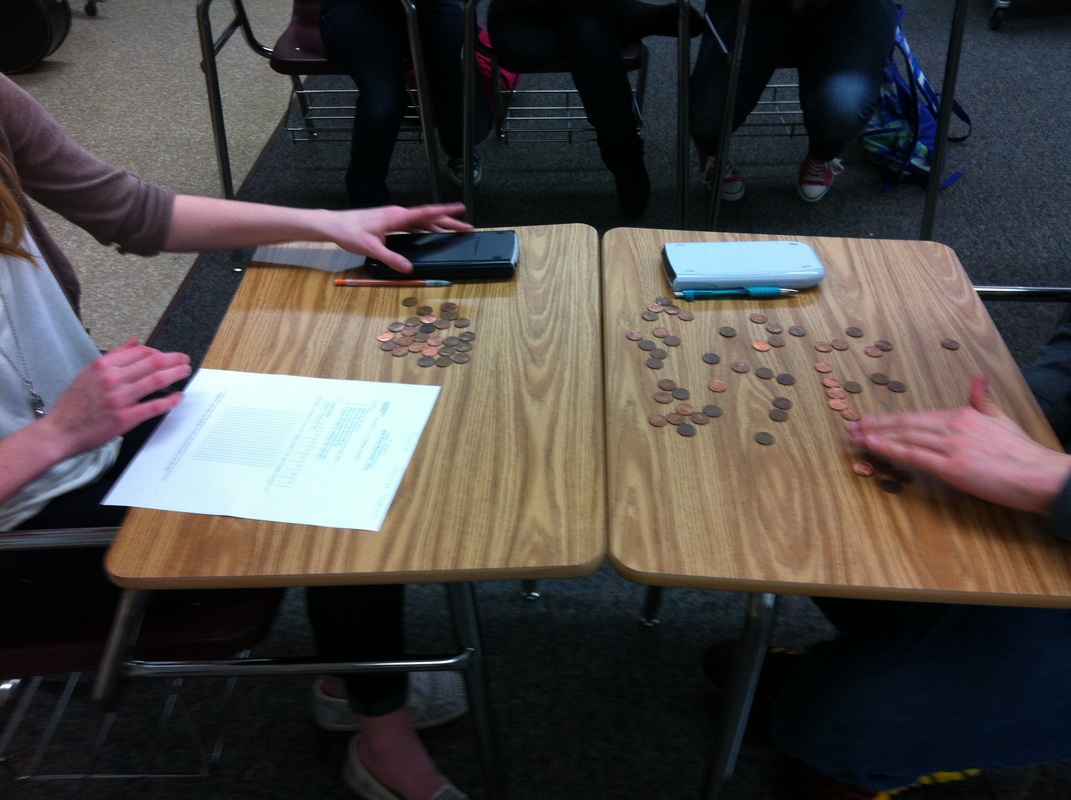
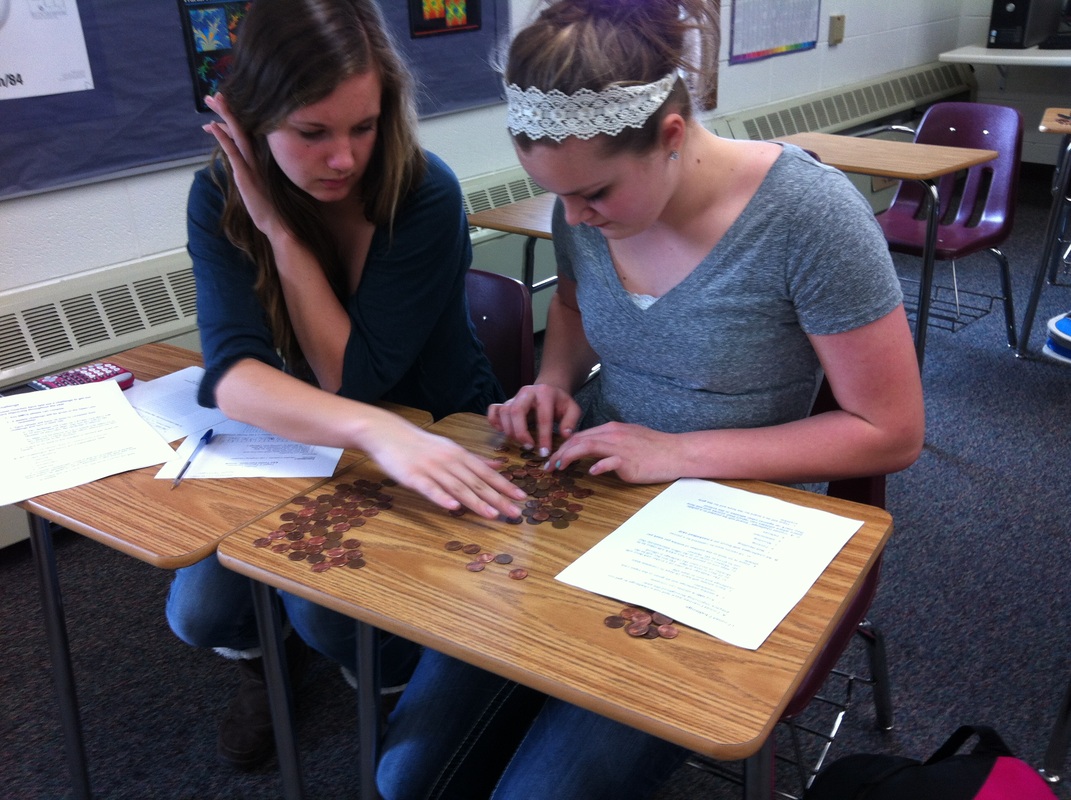
After students get somewhat used to exponential functions and nice neat numbers, I like using this activity. It helps students use what they know about a situation to come up with an ideal equation but then to fiddle with it in order to find a better fit. The process begins by pairing up and playing with pennies (my handouts are at the bottom of this post). I need to be up front with you--you need a lot of pennies. I have a large yogurt container full of pennies and I normally run out. Because I don't have an infinite supply of pennies I have groups alternate whether they start with the growth or decay portion of the activity. To model growth, each group starts with 10 pennies and then drops them on the desk. Students count the number of pennies heads up and then add that many pennies to the next drop. This process happens a total of 7 times and by the end groups have a desk full of pennies. Think of a lot of pennies, then think bigger. My highest group had something like 220 pennies by the end. To model decay, each group starts with 100 pennies and then drops them on the desk. Students count the number of pennies heads up and then takes away that many pennies for the next drop. Again, the process happens 7 times. This one is a whole lot more manageable. By the end it's not unusual for groups to have a 0 as the last value in the table.
After collecting the data, students come up with an ideal equation to model the situation. We have to talk through this one. Students should not use the information in their tables to find this equation. I want them to think of the situation and tell me what the equation should look like: growth, y=10(1.5)^x and decay, y=100(.5)^x. Then I have students use their calculators to create a scatterplot of the data and graph the equation at the same time (step-by-step instructions on the handout). This is where we talk about needing to find a better equation. Some students use their tables to find and average growth factor. Some students just tweak the equation on the graphing calculator. Either way leads to a good discussion of the process of modeling and the messiness of real data. The kids have fun. I have fun. And it all happens in 42 minutes.
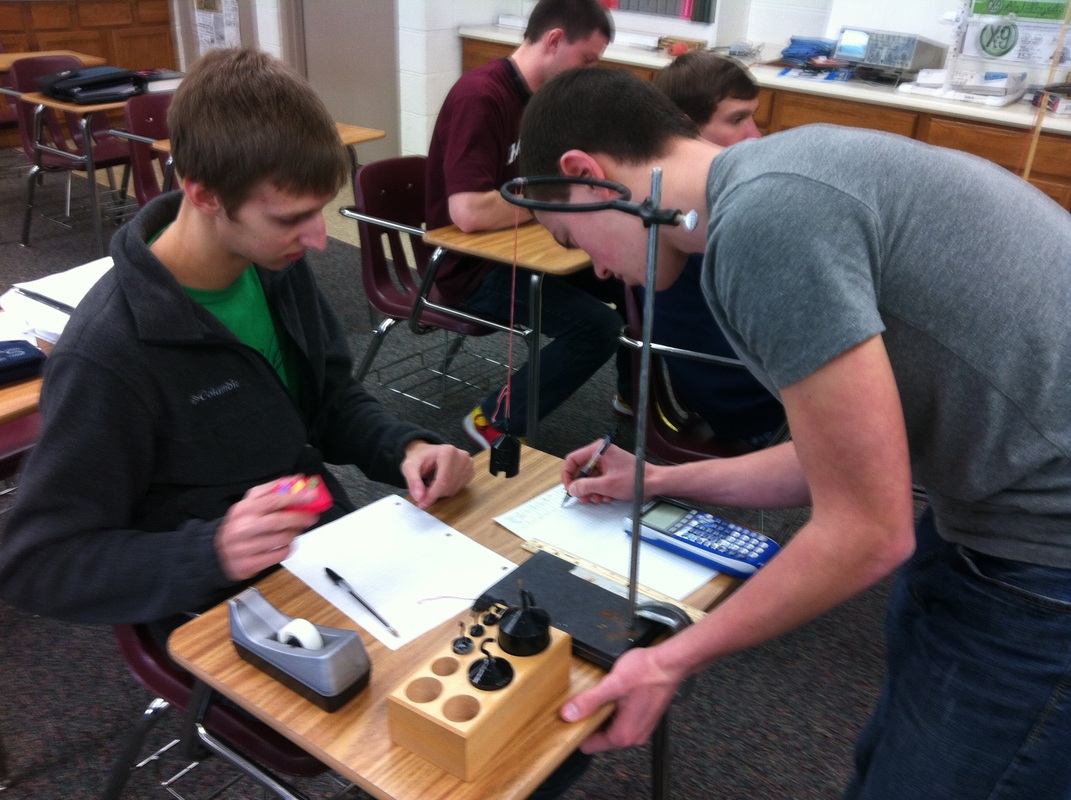
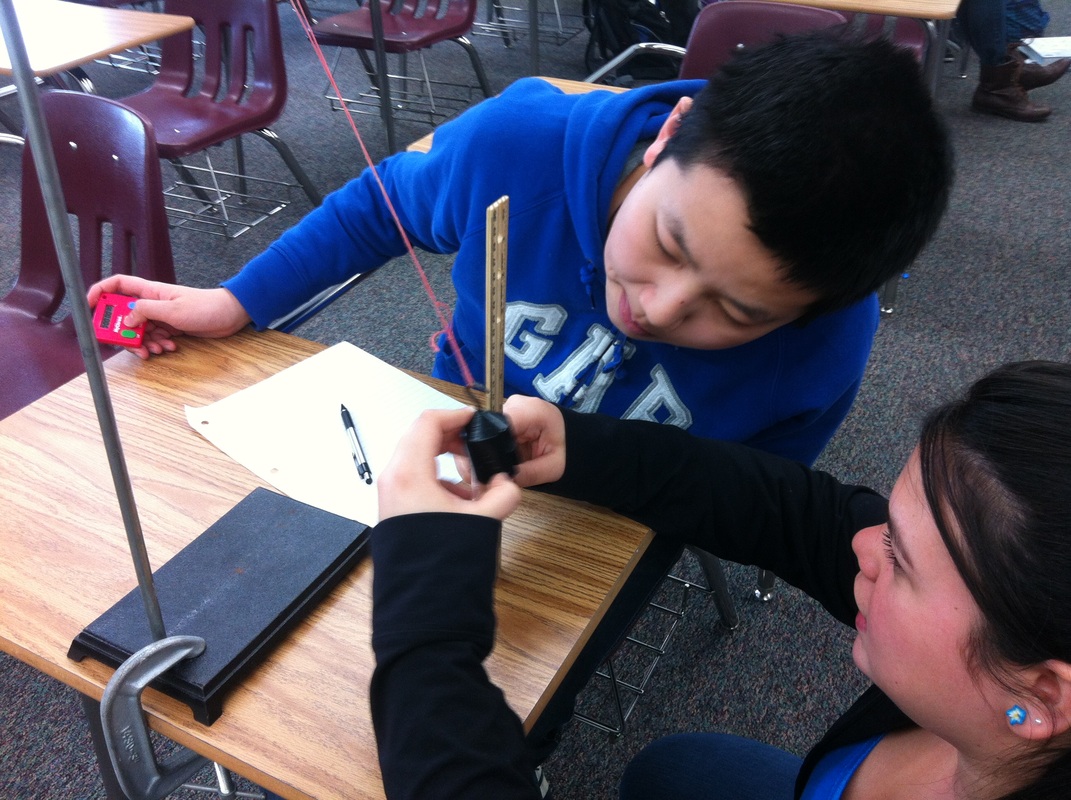
We just finished looking at wave motion. To start, we looked at pendulums and the relationship between the period, the amount of weight, and string length. A couple of stop watches, ring stands from the chemistry lab and weights borrowed from physics and we were good to go. It adds an extra day on the front end but I think it helps my students get a better understanding of what's going on, plus it's fun/interesting. Fun/interesting is an core objective in my class.
While I was shopping for supplies in the physics lab I stumbled upon a spring weight set. I couldn't help myself. I set up some demo videos of pendulums and springs for the students to model. Since my students aren't equipped with laptops, tablets, or the like, I needed some other way to get them the data. I ended up using and Physics Video Tracker to get a data file. Then I imported the data into a Geogebra spreadsheet in order to plot the points and create a data file for the students. I only have 42 minute classes, so any time wasted means multiple days on the same concept. I only have two days budget for the modeling aspect of this exploration of trigonometric transformations. The first two files have sliders for all the variables. The last several do not. I required each student to come up with 4 equations. Two from the easy column and two from the not-so-easy column. We were able to complete the modeling portion lesson and a summary classroom discussion within two class periods. Not bad. Not bad at all. Trig Transformations--Pendulums and Spring Weights
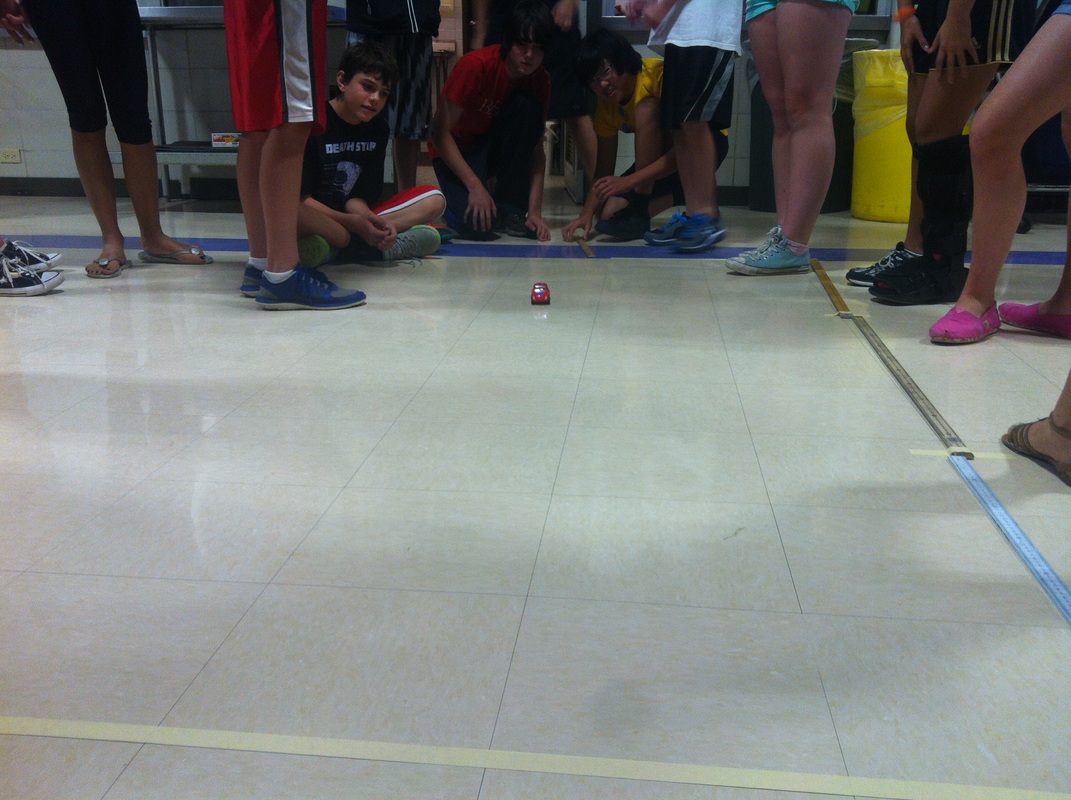
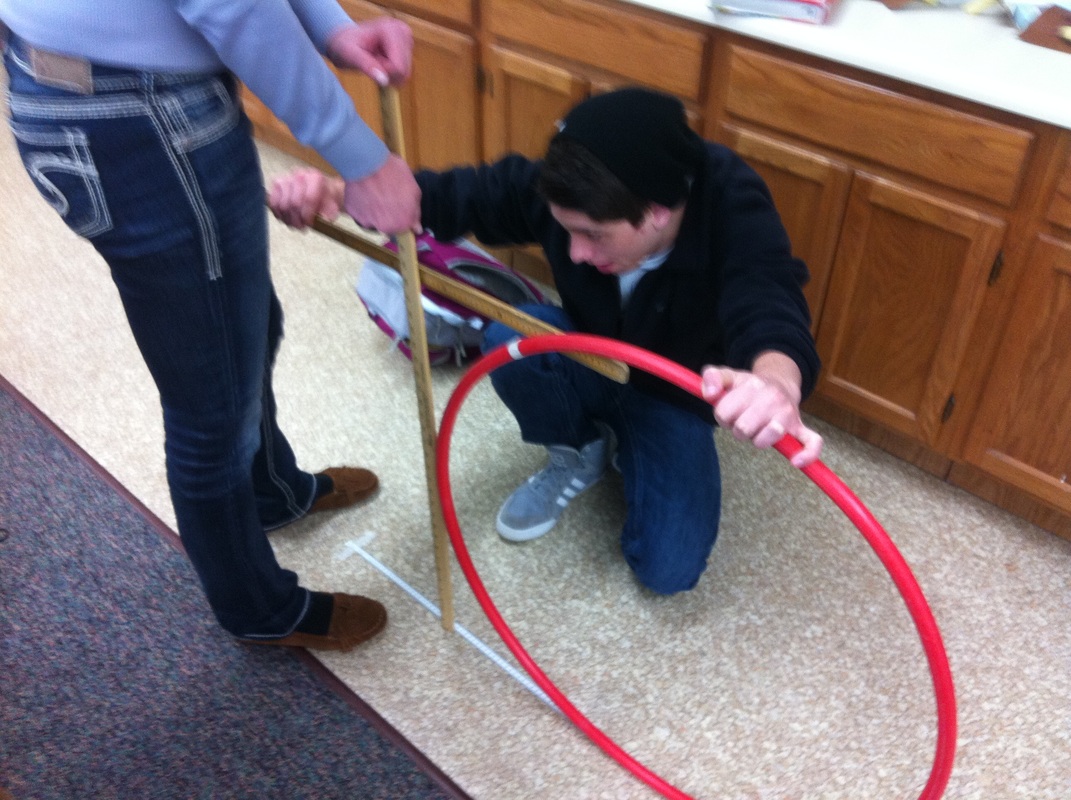
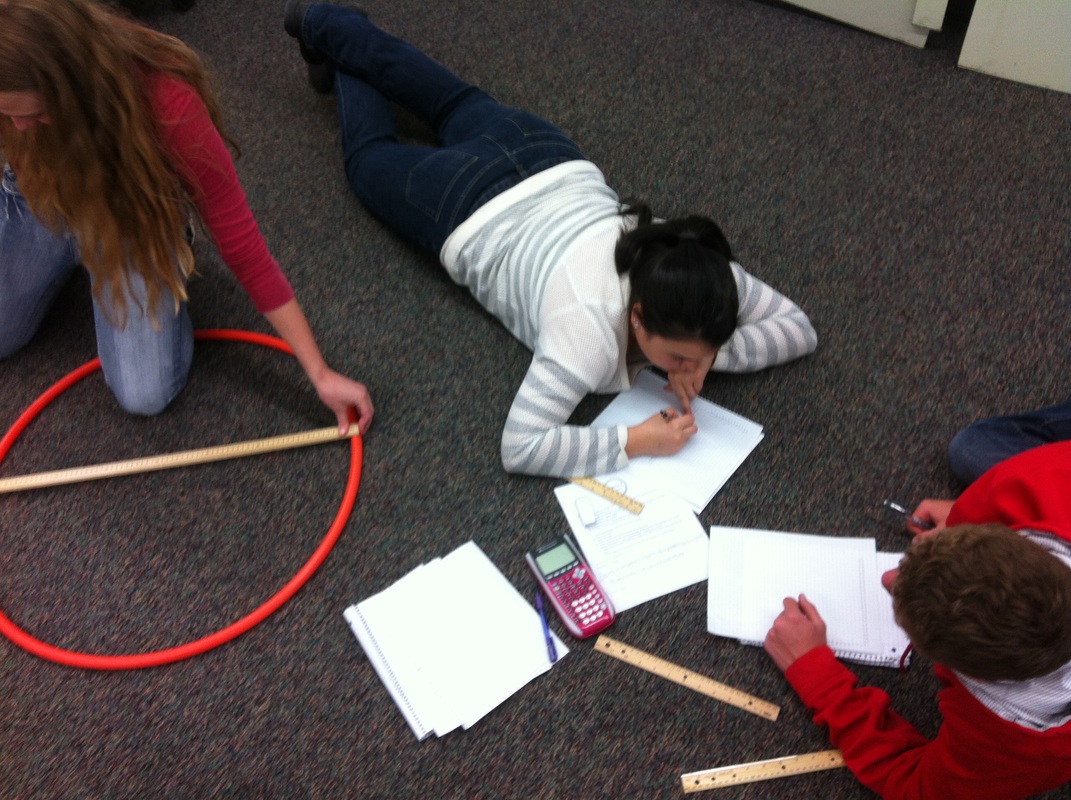
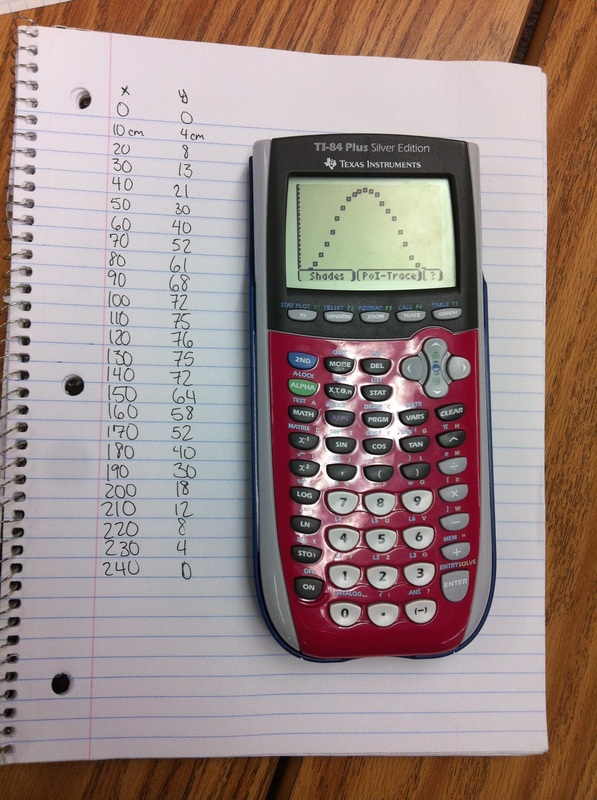
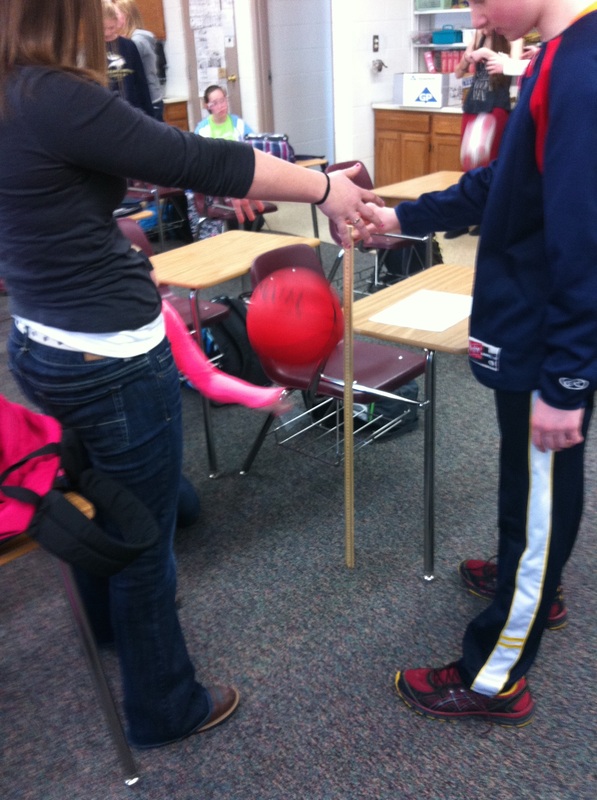
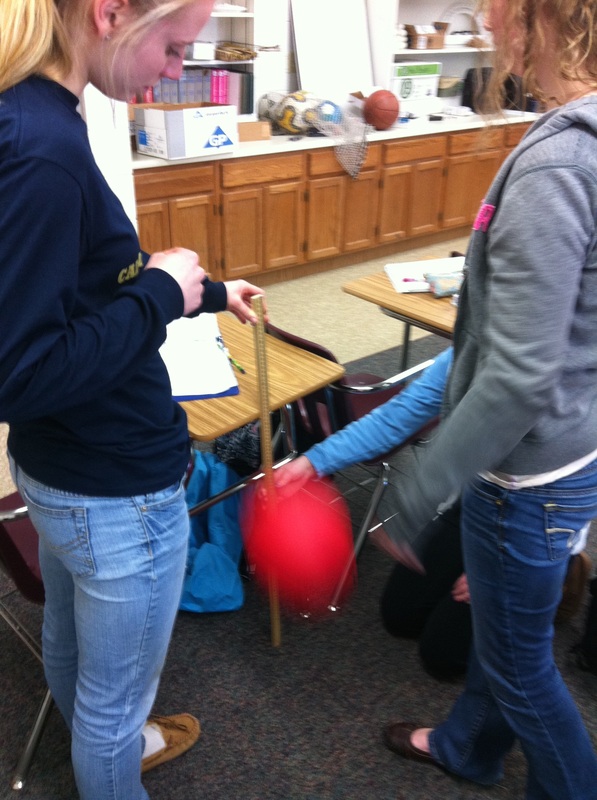
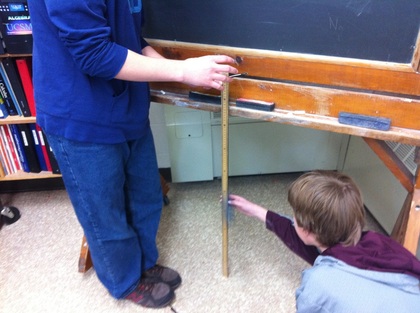
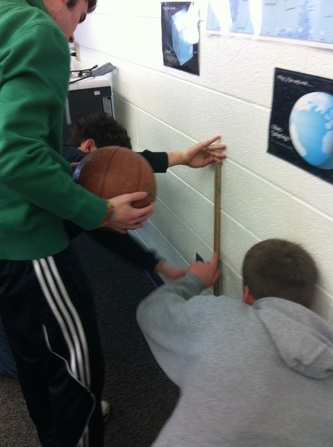
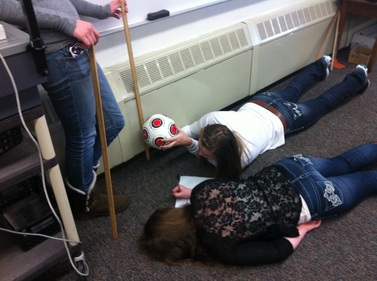 I absolutely love it when kids are out of their seats in my class... and on task. There was a point in class today where almost all my students were laying on the floor trying to figure out the height of the ball bounce. How cool is that? The lesson is pretty basic. I wrote up the lesson requirements on the board (see picture below). I'm not proud of it but it's all I had today. Note: even though we've been doing experiments all year, Algebra 1 still needs the suggestion to make a table; thankfully Algebra 2 does not. 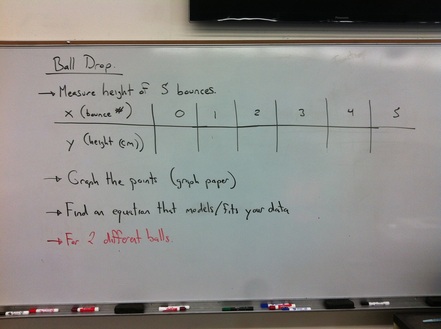 Gathering Data:
For the record, I would like to say that Freshman are awful at measurement. No matter how much we talk about precision, these kids coudn't get a correct height if their grade depended on it (it doesn't by the way). For all of our experiments/activities we measure in centimeters. Some of their measurements were at least 15 cm off. Really?
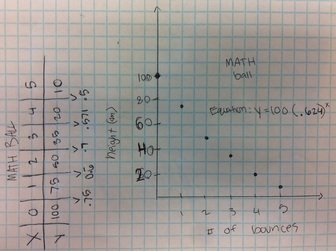
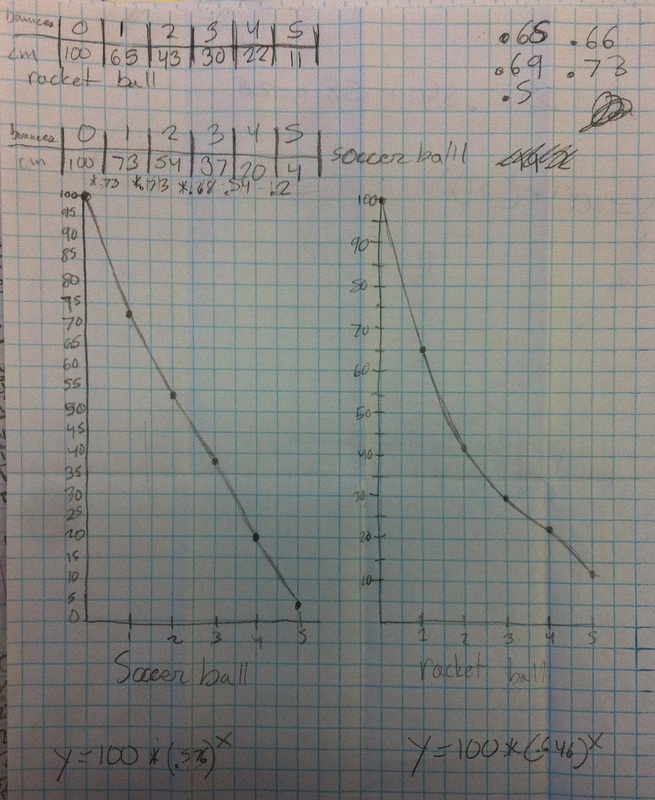
When analyzing the data, groups were pretty quick to realize that picking two random points to find the multiplier wasn't all that accurate. Several students suggested finding the multiplier between each successive bounce and averaging them; I felt like a proud parent. Then they proceeded to make linear equations using the multiplier like it was the slope; I no longer felt proud. We've still got work to do but at least we're having fun doing it.
Things have been more than a bit busy up in my neck of the woods. I feel like I'm doing good just to keep getting the kids out of their seats. Deep in my heart I know there must be a good question I can ask at the beginning which will elicit curiosity; I just didn't have the time to think of one. I'm all ears to those of you who have done this before. Luckily for me, playing with balls during math class was enough of a motivator for the students.
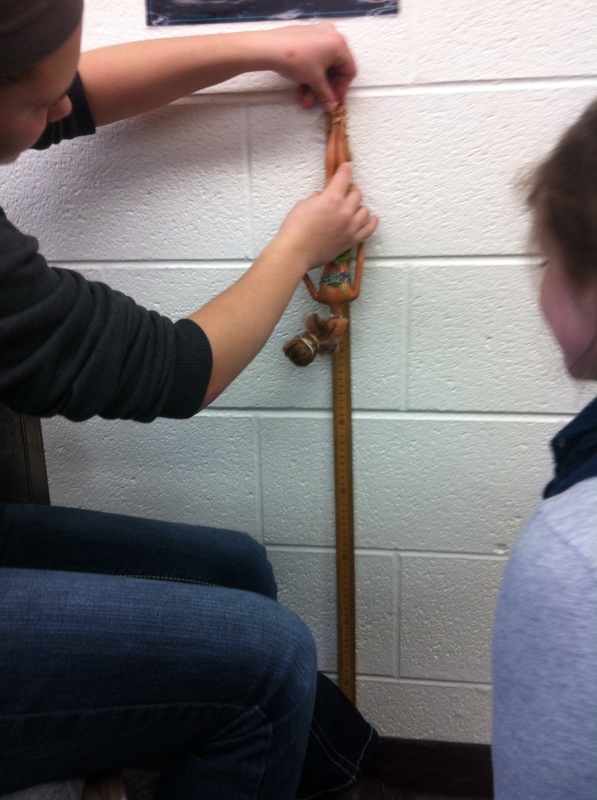
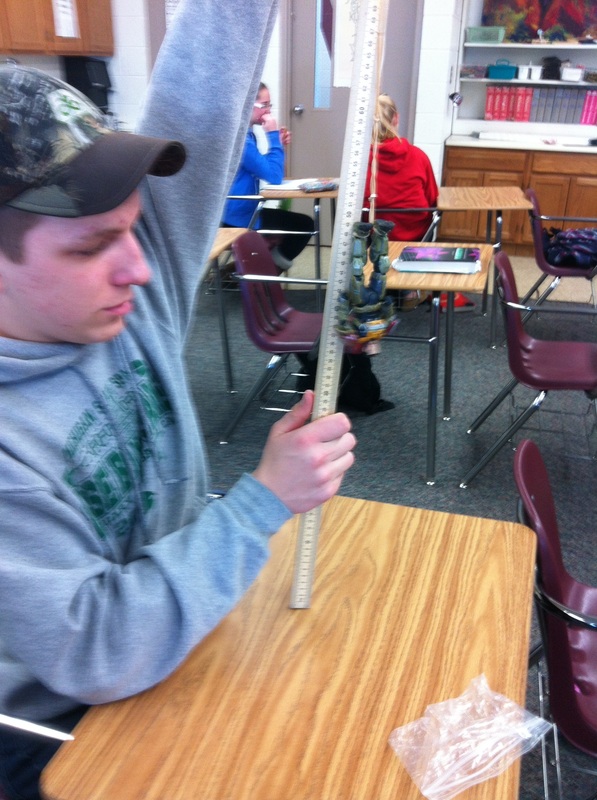
I had enough requests for pictures that I made our 1st Barbie Bungee extravaganza into a video. This last week we ended our focus on linearity in Algebra 1 (finally!). The Barbie Bungee has been around for as long as I've been a teacher (I had conversations with other teachers about it back in 2001). I've never done it before because generally because of my deficit in Barbie dolls. Well, this year I decided I wasn't going to let a little thing like having no Barbies stop me from doing a fun math lesson. I put out an all-call for Barbie dolls, preferably with their clothes (I teach in a Christian school after all). The response? Nothing. Not one doll. It took some doing but I finally convinced my Algebra kids to bring in some kind of figurine to drop. Here's what they came up with. 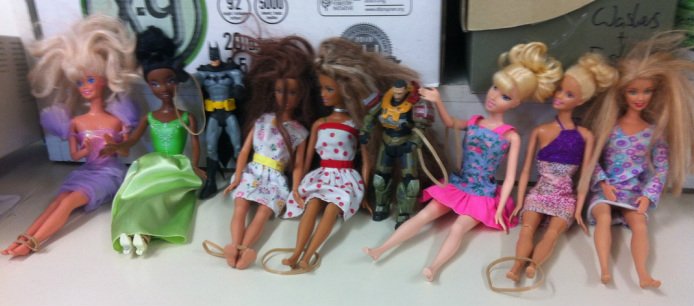
I had a couple of guys not wanting anything to do with Barbie--hello batman and dude from Halo. Day 1: Data collection
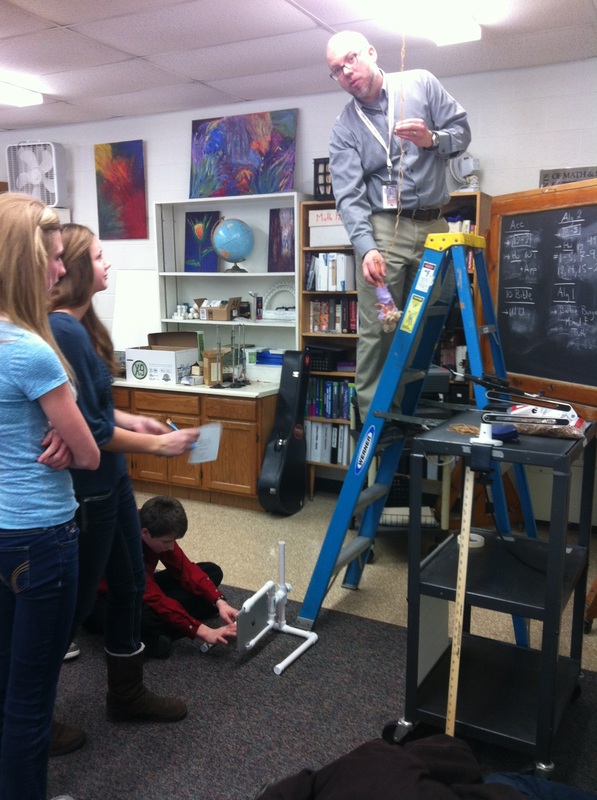
Gathering data and making inferences is slowly getting better as the year goes on. I guess it really comes as no surprise that the more they do it the better they get. When I do this again next year, I need to make sure they have more time to gather data and make connections. The 20 minutes we had in class after questions on homework, the intro, and gathering supplies wasn't quite enough. I had to break my vow of silence and give suggestions on data collection to a group. Maybe it would be a good idea if your collected more information than simply one drop with all of the rubber bands. No, really. I felt bad, but I did it anyway. I'm on a timeline people: can you say 7 snow days?. Many of the groups looked at the table and found the average rate of change and the y-intercept (both the winners and the runners up did this). One group graphed the points and used the line of best-fit (I love it when they see those connections!). One group doubled their data from 7 rubber bands and saw that it wasn't enough and then tripled it. They saw that it was too much so they found the average stretch per rubber band and then took away as many rubber bands as it took to get under the height from the floor to the hook in the ceiling (282.5 cm). Novel but unfruitful. They didn't take into consideration Barbie's initial height so they ended up being pretty high off the ground when all was said and done. Day 2: The moment of truth. I used a hook attached to the ceiling as the starting point for out plastic daredevils.
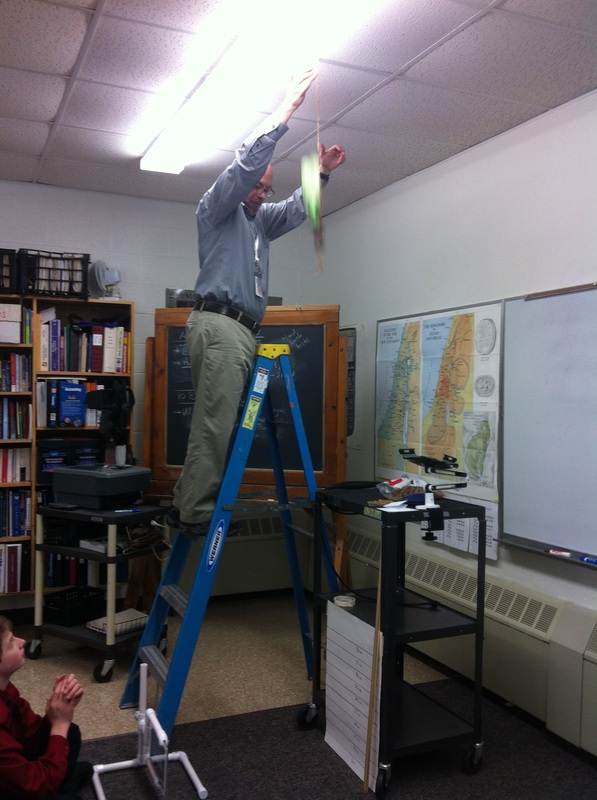
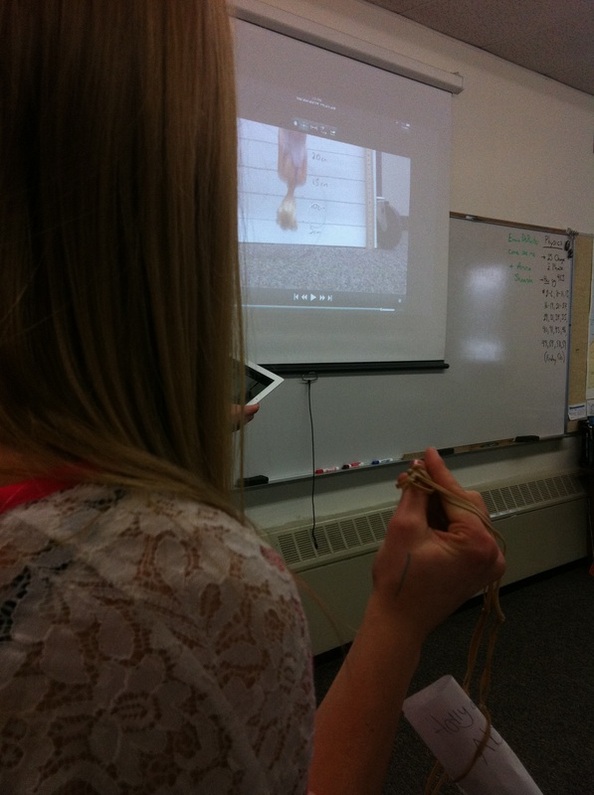
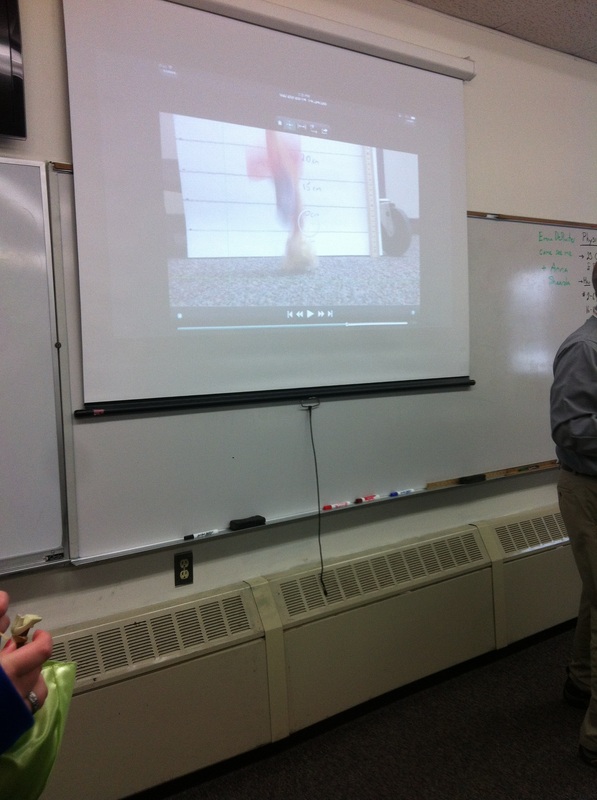
Then we used the iPad and the Apple TV to video and show the happenings up on the screen. The video came in handy several times for the "instant replay" feature (see below).
We had a hair's difference between first and second place. Our winning group had the photo finish above right. Their Barbie's hair just touched the ground but not her little noggin. We all agreed if you got twigs in your hair on a bungee jump and didn't die, that might just be the best bungee jump ever.
All in all, this was a great project to end our study of linearity in Algebra 1. |


Andrew Busch
I teach Math at Ralston Valley High School in Arvada, CO. Categories
All
Archives
March 2019
|
|||||||||||||||||||||||||||||||||||||||||||||||||||||||||||||||||||||||||||||||||||||
 RSS Feed

